
DevOps monitoring integration is the key to improving system reliability, reducing downtime, and making faster issue resolutions possible. By combining metrics, logs, and traces, teams can diagnose issues quickly and improve user experiences while keeping costs under control. This article explains how to implement monitoring effectively across your CI/CD pipelines, infrastructure, and applications.
Key Takeaways:
- Why it matters: Organisations with advanced monitoring practices see a 37% increase in reliability and 50% faster incident response times.
- Core components: Metrics identify trends, logs provide context, and traces reveal bottlenecks in distributed systems.
- Cost management: Use tiered data storage, sampling, and efficient tools like OpenTelemetry to reduce monitoring expenses.
- CI/CD integration: Shift monitoring left by adding checks at build and deployment stages to catch problems early.
- Centralisation: Consolidate observability data into a single platform to improve troubleshooting and collaboration.
This guide provides actionable strategies to build a monitoring system that supports faster recovery, better performance, and reduced costs.
::: @figure 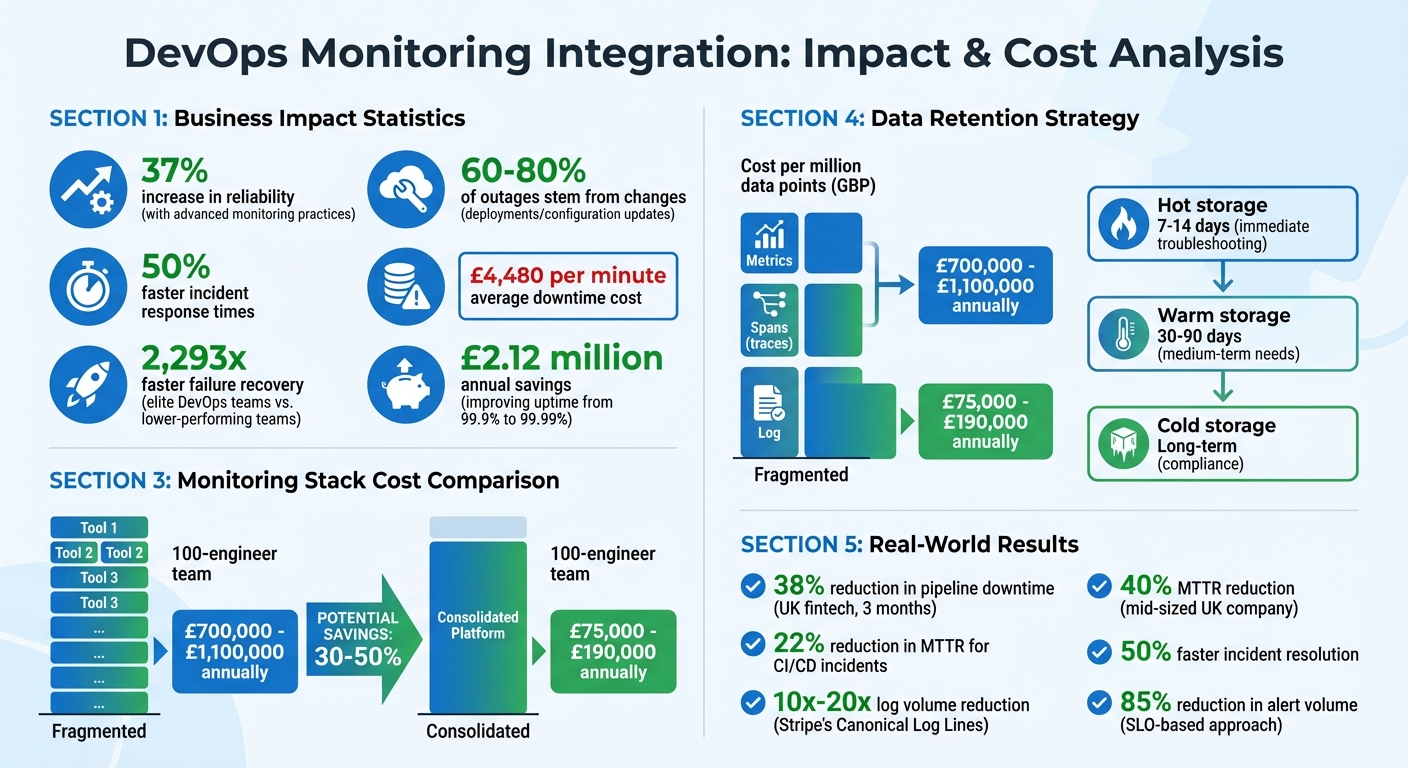 {DevOps Monitoring: Key Statistics and Cost Comparison}
:::
{DevOps Monitoring: Key Statistics and Cost Comparison}
:::
Monitoring DevOps pipelines - Pipeline success through observability
Core Components of DevOps Monitoring
A successful monitoring system revolves around three essential elements: metrics, logs, and traces. Each plays a distinct role - metrics show what is happening, logs explain why, and traces pinpoint where issues arise within distributed systems [4]. Combining these tools effectively, while keeping costs in check, is key to building a reliable observability strategy.
Metrics and Infrastructure Monitoring
Metrics are numerical data points like CPU usage, request rates, or error counts. They form the backbone of alerting systems because they are inexpensive to store (about £0.08 per million points), quick to query, and great for spotting trends over time [3][4]. Since they’re cost-effective, metrics can be retained for extended periods, making them ideal for long-term analysis.
That said, metrics have their limitations. They can tell you what is happening - like a spike in HTTP 500 errors - but not the underlying cause. This is why it’s better to alert based on symptoms, such as latency or error rates, rather than internal metrics like CPU usage.
A user doesn't care if the CPU is at 100% if their request is fast- Rajat Gupta, Engineering Pulse [3]
When setting up alerts, focus on Service Level Objectives (SLOs) that reflect user experience. But be cautious with high cardinality - using unbounded labels like user IDs or email addresses in time-series databases (e.g., Prometheus) can lead to memory issues [3][4]. A smarter approach is to use exemplars, which attach a trace_id to metric histograms. This allows you to trace spikes directly to their root cause [4].
Logs add the necessary context to metrics, making them essential for deeper analysis.
Structured Logging and Log Aggregation
Logs explain why a system failure occurred. To maximise their usefulness, always format logs in JSON. This enables easier parsing and querying without the hassle of regex patterns [3][6]. Essential fields like timestamp, log level, service name, and correlation ID should be included in every log entry to link events across services [6].
Log ingestion can be pricey, typically ranging from £2.40 to £6.40 per GB [4]. To manage these costs, Stripe adopted Canonical Log Lines
, emitting one comprehensive JSON log per request. This method reduced their log volume by 10x to 20x, enabling teams to identify abusive users during rate-limiting incidents with a single query [3].
Centralised log aggregation further simplifies troubleshooting. By consolidating logs from multiple microservices into one location, teams can diagnose system-wide issues without jumping between servers [7][8]. Tools like Grafana Loki offer a cost-effective alternative to Elasticsearch by indexing labels instead of full-text, which is especially helpful in Kubernetes setups [6][9]. To avoid runaway storage costs, set retention policies (e.g., 30–90 days) and sample logs from high-traffic areas [4][6].
Distributed Tracing for Service Dependencies
Distributed tracing complements metrics and logs by mapping out inter-service dependencies. It tracks a single request as it travels through multiple services, revealing bottlenecks and performance issues [8][1]. In complex architectures, where one user action can involve dozens of services, tracing eliminates the need for manual timestamp matching.
For example, during Black Friday in November 2025, PayCore engineers faced a payment failure despite dashboards showing 99.97% uptime. Using distributed tracing, they identified a timeout in the gateway.charge service at 29.8 seconds. Traces linked this to logs, revealing that one of three gateway IPs was rejecting connections. The issue was diagnosed in 5 minutes, and a fix was deployed in 12 [4].
Traces are visualised as Directed Acyclic Graphs (DAGs) of spans. While metrics cost around £0.08 per million points and can be stored long-term, spans are pricier (£0.80–£2.40 per million) and typically retained for 7–30 days [4][10]. To handle large data volumes, many teams now use tail-based sampling, where only high-value traces - like errors or slow requests - are kept, while routine traces are discarded [4][10].
The industry standard for this kind of observability is OpenTelemetry (OTel). As a vendor-neutral framework, OTel helps teams generate and correlate metrics, logs, and traces without being tied to a specific provider [10][5].
Integrating Monitoring with CI/CD Pipelines
Bringing monitoring into your CI/CD pipeline isn’t just a nice-to-have - it’s a game-changer for catching and resolving issues early. Instead of waiting until users encounter problems in production, monitoring can begin as soon as code is written. This shift-left
strategy creates a feedback loop that helps stabilise the software lifecycle from start to finish [13]. Here’s how to weave continuous monitoring into your build and deployment processes for a more resilient CI/CD workflow.
Continuous Monitoring in CI/CD
Continuous monitoring tracks every stage of your delivery pipeline. By tagging telemetry with commit IDs, build numbers, and environment names, teams can quickly trace regressions back to their source [13]. This level of visibility is one reason elite DevOps teams recover from failures 2,293 times faster than lower-performing teams. They connect pipeline metrics (like build times and failure rates) with application telemetry (such as response times and error rates) [15].
A common approach is to use SLO-driven alerts based on Golden Signals
- latency, traffic, errors, and saturation. These alerts notify teams when user experience starts to degrade. For example, in May 2023, a UK-based fintech company using Datadog reduced pipeline downtime by 38% in three months. They achieved this by automating monitors for orphaned Kubernetes pods and integrating Slack notifications for their CI reliability teams. This initiative also slashed their mean time to recovery (MTTR) for CI/CD incidents by 22%.
But monitoring doesn’t stop there. Adding checks at the build and deployment stages further strengthens the pipeline.
Monitoring Checks at Build and Deployment Stages
Research shows that 60–80% of outages stem from changes like deployments or configuration updates [14]. To catch these issues early, automated checks at both the build and deployment stages are essential. For example:
- Monitor build duration and failure rates.
- Use pre-commit linting and automated tests to flag problems before code is committed.
However, even a passing pipeline doesn’t guarantee a healthy deployment. That’s where the heartbeat pattern comes in. By configuring a monitoring endpoint to expect a signal at the end of the deployment script, you can trigger alerts if the signal doesn’t arrive - indicating a hung or failed deployment. Post-deployment health checks should validate HTTP response codes, content accuracy, and latency within the first few minutes. Don’t forget to verify version endpoints (like /health) to ensure new commits are live and old instances aren’t still in the mix.
| Failure Mode | Symptom | Detection Method |
|---|---|---|
| Build Hangs | Pipeline stalls indefinitely | Build duration monitoring, timeout alerts |
| Silent Deploy Failure | Pipeline passes but service is old | Version endpoint check, heartbeat monitoring |
| Rolling Update Stall | Pods stuck on old version | Version endpoint check, pod status monitoring |
| Config/Secret Missing | App crashes on first request | Post-deploy HTTP check with content validation |
| Database Migration Timeout | Deploy blocks on schema change | Deploy duration monitoring, health check failure |
Baseline Metrics and Automated Testing
Performance baselines are crucial for spotting regressions. Collect at least two weeks of historical data to set realistic benchmarks for build times, success rates, and application response times. Synthetic monitoring, which simulates real user interactions like API calls or end-to-end workflows, can validate system behaviour in both staging and production environments [11].
Automated quality gates are another powerful tool. These conditions can block a pipeline or trigger a rollback if critical workflows (like login or checkout) fail [11][13]. For example, if smoke tests fail within 60 seconds, the system can automatically revert to the last stable state [12][13]. This fail-fast
approach not only prevents broken code from reaching users but also saves time and money compared to fixing issues in production.
Alerting and notification systems are critical for proactive issue resolution, enabling teams to respond quickly to issues and minimise downtime.- Splunk [2]
Centralising Observability Data
Centralising observability data builds on the idea of integrating monitoring into CI/CD pipelines, making troubleshooting across your entire system much easier. When logs, metrics, and traces are scattered across different tools, finding the root cause of an issue can feel like solving a complex puzzle. By consolidating these data types into a single platform, teams can correlate events across the stack, cutting investigation times dramatically - from 30 minutes to just 5 minutes - by eliminating the need to jump between multiple tools [17].
Benefits of Centralised Data Platforms
A unified observability platform acts as a single source of truth for all telemetry data. Instead of juggling multiple dashboards and trying to piece together fragmented information, engineers can query one system to get a complete picture of what’s happening across services, environments, and infrastructure [17][18]. This reduces the mental strain during incidents - no more late-night struggles with tool sprawl
[16]. It's worth noting that 80% of observability practitioners are actively working to consolidate their tools to escape the chaos of fragmentation [16].
Centralisation also enhances collaboration between teams. When everyone relies on the same dataset, there’s no debate over conflicting metrics or missing log entries. The result? Faster Mean Time to Recovery (MTTR) and smoother communication during post-mortems.
Cross-Environment and Service Correlation
The real advantage of centralised data lies in its ability to connect the dots. For example, linking a CPU usage spike to a specific log entry or tracing a slow API request across development, staging, and production environments becomes far easier [17]. By using tools like Trace IDs embedded in logs and HTTP headers, you can follow a single user request as it flows through microservices, databases, and third-party APIs [1][19][17]. This approach doesn’t just tell you when something went wrong - it helps uncover why it happened [1].
Structured logging further improves this process by allowing you to filter key fields like tenant_id or trace_id, making cross-environment correlation more efficient. Using OpenTelemetry, a vendor-neutral standard, ensures your observability stack remains adaptable and avoids vendor lock-in, keeping your options open for the future [1][17][18].
Cost-Effective Observability Data Management
While centralisation offers clear benefits, it can quickly become expensive if not managed properly. Monitoring costs can consume up to 70% of an infrastructure budget, with log indexing costing anywhere from 5× to 150× more than raw cloud storage [21][22]. To keep costs under control, many teams implement tiered storage:
- Hot storage: Retain data for the past 7–14 days for immediate troubleshooting.
- Warm storage: Keep data for 30–90 days for medium-term needs.
- Cold storage: Archive data for long-term compliance purposes [20].
Pre-ingestion filtering and sampling can also help reduce data volumes, while using binary formats like OTLP instead of JSON can lower bandwidth and storage requirements [20].
To put things into perspective, a fragmented monitoring stack for a 100-engineer team can cost between £700,000 and £1,100,000 annually. In contrast, a consolidated platform typically costs between £75,000 and £190,000 [22]. By combining retention policies, efficient querying, and tiered storage, you can achieve comprehensive visibility without breaking the bank. This balance not only supports faster incident resolution but also boosts overall DevOps efficiency.
Need help optimizing your cloud costs?
Get expert advice on how to reduce your cloud expenses without sacrificing performance.
Best Practices for Effective Alerting
Once data centralisation is in place, the next step in creating a solid DevOps monitoring setup is effective alerting. This is crucial for cutting through the noise of excessive notifications, a common issue known as alert fatigue, which many DevOps teams face [23]. By focusing on alerts that are actionable and provide meaningful context, teams can ensure that their monitoring efforts are both efficient and effective.
Designing an Alert Strategy
Every alert should clearly state the problem, its impact on the business, and who is responsible for resolving it [23]. For example, instead of a vague alert like High CPU usage
, a more actionable message would be: Service dropping requests due to CPU saturation – scale up. Affects user checkout completion. Payment team on-call.
This level of detail ensures that the right team knows what action to take and why [23][24].
Focus on symptoms that affect users rather than internal metrics alone. For instance, tracking Service Level Objective (SLO) breaches can help identify when error budgets are being consumed too quickly. This approach not only enhances incident detection but can also reduce the volume of alerts by up to 85% [23].
| Severity Level | Response Expectation | Notification Channel | Example Scenario |
|---|---|---|---|
| Critical | < 5 minutes | Phone call, SMS, PagerDuty | Complete service outage or data loss |
| High | < 15–30 minutes | PagerDuty, Slack | Partial outage or critical component failure |
| Medium | 1–4 hours | Team Chat, Email | Performance degradation |
| Low | Next business day | Dashboard, Email | Non-critical issues (e.g. disk usage at 60%) |
Thresholds and Anomaly Detection
Effective thresholds and anomaly detection are key to reducing the noise from alerts. Static thresholds work well for fixed limits, like when disk usage hits 95%, while dynamic thresholds are better suited for systems with variable workloads. For example, percentile-based thresholds like p95 or p99 can help identify patterns without being triggered by temporary spikes [25][27]. However, relying on p50 (median) values might overlook issues that impact smaller groups of users.
For uptime monitoring, ensure reliability by requiring confirmation from at least two geographic regions before triggering a critical alert. This helps avoid false positives caused by localised network issues [29].
Regularly review and fine-tune alert settings - monthly reviews are a good practice. Aim for fewer than five alert activations per rule each week and keep false positives below 10% [25][27]. Tracking metrics like the alert-to-incident ratio, which should ideally be above 0.8, can ensure that alerts are meaningful [27]. Additionally, tools like flapping detection and alert correlation can group related issues into a single incident, reducing noise even further [23].
Routing Alerts Effectively
Alerts should always reach the right people, and routing based on severity and expertise is essential. Use metadata labels like team: backend or service: database to ensure notifications are directed to the appropriate teams [24]. For critical issues, high-priority channels such as PagerDuty, SMS, or phone calls are best. Less urgent warnings can be sent through Slack or email [29]. To make alerts more actionable, include links to relevant runbooks, dashboards, and logs [26][29].
Multi-tier escalation processes are vital for handling unacknowledged alerts quickly [29]. This is particularly important given the high cost of downtime - estimated at £4,480 per minute [23][28]. Inhibition rules can suppress lower-priority alerts when a critical alert for the same service is active, and cooldown periods of 15–30 minutes can prevent duplicate notifications [26][29]. By implementing these measures, teams can maintain focus and respond effectively to critical issues.
Hokstad Consulting's Approach to DevOps Monitoring
Tailored Monitoring Solutions
Hokstad Consulting takes a personalised approach to monitoring by analysing your DevOps setup - covering CI/CD pipelines and infrastructure - to create solutions that align with your specific goals. Instead of relying on off-the-shelf tools, they focus on key performance indicators (KPIs) like reducing downtime, enhancing user experience, or speeding up deployment cycles. For example, a mid-sized UK company reduced its mean time to recovery (MTTR) by 40% after implementing continuous monitoring and customised dashboards tailored to different roles [30][34].
Their monitoring strategy spans the entire development lifecycle, from development to production, tracking essential metrics such as CPU usage, response times, and application performance. They integrate advanced tools for full-stack monitoring, including eBPF metrics, AI-based anomaly detection, and unified platforms that consolidate metrics, logs, and traces across hybrid environments. These solutions are deployed using infrastructure-as-code practices (e.g., ARM templates or PowerShell), ensuring scalability and preventing configuration drift as systems expand [31][34].
Cost Optimisation and Cloud Efficiency
Hokstad Consulting helps clients cut monitoring costs without sacrificing performance. By applying granular retention policies - keeping non-critical data for just 2–3 weeks - and leveraging AI-driven downsampling for critical KPIs like MTTR and alert fatigue, they deliver 30–50% savings on cloud bills for observability data. Clients have reported annual savings of £10,000–£50,000 through optimised storage and intelligent filtering [31][30].
They also fine-tune instance sizing and auto-scaling to maintain CPU and memory usage within a cost-effective range of 60–80%. Automated alerts and anomaly detection ensure system availability while reducing unnecessary log ingestion costs. Centralised platforms further avoid redundant storage by correlating data across services. Key metrics tracked include time to detect (MTTD), time to resolve (MTTR), false positive alert rates, and cost per monitored resource, with all improvements validated against pre- and post-implementation benchmarks [30][31]. These savings often become part of a larger transformation strategy.
Expert Guidance for DevOps Transformation
Hokstad Consulting provides step-by-step guidance to integrate monitoring into DevOps transformations. They start by defining monitoring objectives tied to business KPIs, then introduce monitoring earlier in the CI/CD pipeline. Automated performance gates are added to ensure only code meeting quality benchmarks moves to production. This includes embedding Application Performance Monitoring (APM) checks into deployment pipelines to catch regressions early, reducing rework and downtime costs [32][34][35].
With this phased approach, clients have seen up to 50% faster incident resolution and increased deployment frequency [31][34]. One UK retailer achieved 99.9% uptime after adopting cross-environment correlation and unified tools for development and operations teams [31][34]. Hokstad also offers ongoing support through retainer-based services for performance tuning, incident response, and regular security audits. For cost optimisation projects, they even provide a No Savings, No Fee
engagement model, ensuring flexibility and client confidence.
Conclusion
Summary of Benefits
Integrated monitoring enhances system reliability, operational efficiency, and cost management. By embedding observability throughout the workflow - from CI/CD pipelines to production - teams gain real-time visibility into their systems. This not only speeds up issue resolution but also significantly reduces downtime. For instance, improving uptime from 99.9% to 99.99% could save a business around £2.12 million annually, assuming downtime costs £4,500 per minute.
Monitoring also drives better performance metrics. Companies adopting continuous monitoring and automated alerts have reported cloud cost savings of up to 50%, thanks to smarter data retention and resource allocation. Centralised observability platforms further streamline operations by removing redundant storage and enabling cross-environment data correlation. This helps teams hit critical targets, such as maintaining response times under 200ms and keeping error rates below 1%.
Monitoring and logging are not just optional add-ons in the world of DevOps; they are fundamental pillars that empower teams to deliver high-quality software with speed and confidence.- Jason McGee, DevOps Engineer [37]
These advantages provide a strong foundation for refining your monitoring strategy.
Next Steps for Implementation
Start by defining clear monitoring goals tied to KPIs - whether it's reducing recovery times, improving user satisfaction, or accelerating deployment cycles. Identify what needs monitoring and why, and set baseline metrics before introducing new tools [33].
Incorporate monitoring earlier in your development process. Adding automated performance checks to CI/CD pipelines can catch problems sooner, cutting down on rework and downtime. Centralise logs, metrics, and traces on a unified platform to make troubleshooting more efficient [36]. Regularly review and update monitoring configurations to ensure dashboards and alerts stay relevant as your infrastructure evolves. Collaborating with experts who specialise in both technical execution and cost management can help fast-track your efforts while ensuring long-term success.
FAQs
What should we monitor first in a DevOps setup?
In a DevOps environment, it's crucial to keep a close eye on application performance and system health. Pay attention to metrics like response times, error rates, and resource usage. These indicators can help you pinpoint bottlenecks and spot performance issues before they escalate.
Dashboards can be incredibly helpful for tracking key metrics, such as deployment frequency and mean time to recovery (MTTR). Having access to real-time metrics and logs ensures you can tackle issues quickly and keep systems running smoothly.
How do we connect metrics, logs and traces for faster debugging?
To bring metrics, logs, and traces together effectively, it's important to use a unified approach that links these data types in a seamless way. Tools like OpenTelemetry, Prometheus, Grafana, and Jaeger can help centralise the collection of this data in one place.
Make sure to use consistent naming conventions, timestamps, and labels across all your signals. This integration allows for real-time visualisation, making it easier for teams to pinpoint and fix issues by tracing them back to their source.
How can we cut monitoring costs without losing visibility?
To keep monitoring costs low while still keeping a clear view of your systems, it’s all about fine-tuning your tools and processes. Opt for budget-friendly monitoring tools that offer unified dashboards and real-time alerts - these features let you stay informed without overspending.
Consider leveraging open-source solutions to cut licensing fees, and automate tasks like resource management to save both time and money. Keep a close eye on critical metrics like CPU usage and memory consumption to avoid overprovisioning.
Another smart move? Trim the fat. Use strategies like right-sizing resources, enabling auto-scaling, and scheduling shutdowns for non-production environments when they’re not in use. These steps help maintain full visibility into your systems without adding unnecessary costs.