
Monitoring Kubernetes CI/CD resources can be challenging due to the dynamic nature of containers and pods. Tools like Prometheus, Argo CD, GitHub Actions, and GitLab CI/CD simplify this process by offering metrics collection, state monitoring, and pipeline automation. Prometheus excels in resource tracking, while Argo CD ensures cluster states match Git configurations. CI/CD tools like GitHub Actions and GitLab CI/CD streamline workflows for containerised environments. Security tools such as Trivy and KubeLinter further enhance visibility by identifying misconfigurations and vulnerabilities. Selecting the right tool depends on your team’s expertise, infrastructure complexity, and budget. Open-source options save on licensing costs but require more management, while SaaS platforms reduce setup time but can increase expenses as workloads scale. Combining these tools with best practices like alerting, centralised observability, and historical data analysis ensures efficient resource management and cost savings.
CI/CD Tutorial for Kubernetes: Build & Deploy with GitLab, Harbor and ArgoCD
Top Tools for Monitoring Kubernetes CI/CD Resources
Keeping an eye on Kubernetes CI/CD resources can feel like juggling multiple tasks at once. The right tools simplify this process by tracking resources and spotting issues before they escalate. Here's a closer look at how some of the top tools handle these challenges.
Prometheus has earned its reputation as a go-to for metrics collection in Kubernetes environments. It was the second project to join the Cloud Native Computing Foundation back in 2016, right after Kubernetes itself. Prometheus collects metrics as time-series data over HTTP, making it perfect for tracking CPU and memory usage in detail [10]. This data powers automated scaling through tools like the Horizontal Pod Autoscaler (HPA) and Vertical Pod Autoscaler (VPA) [1][12]. While it prioritises reliability over pinpoint precision, it's incredibly effective for diagnosing outages and performance issues.
On the other hand, Argo CD focuses on continuously monitoring your applications. It compares the live state of your Kubernetes clusters to the desired state stored in Git [11]. If something doesn't match - whether due to manual changes or overlooked configurations - Argo CD flags it as OutOfSync
[13]. This feature is crucial for avoiding wasted resources caused by unintended configurations. Plus, Argo CD supports PreSync, Sync, and PostSync hooks, making it a solid choice for managing complex rollouts like blue/green or canary deployments. These hooks let teams test resource stability before committing to a full deployment [13].
For handling containerised workloads, CI/CD integrators step in to bridge the gap. GitHub Actions offers containerised workflows and parallel processing to keep CI jobs resource-efficient. Similarly, GitLab CI/CD provides pipeline templates, security scanning, and progressive delivery methods, all tailored to the temporary nature of containers. These tools ensure pipelines run smoothly without unnecessary resource drain.
To round out your monitoring setup, consider adding security and configuration tools. Options like Trivy, KubeLinter, Checkov, and Kubescape are designed to spot misconfigurations and vulnerabilities. They play a key role in preventing resource leaks and security breaches. When combined with metrics from Prometheus or the state monitoring capabilities of Argo CD, these tools give you a well-rounded view of both performance and security across your CI/CD pipeline.
Tool Comparison
::: @figure 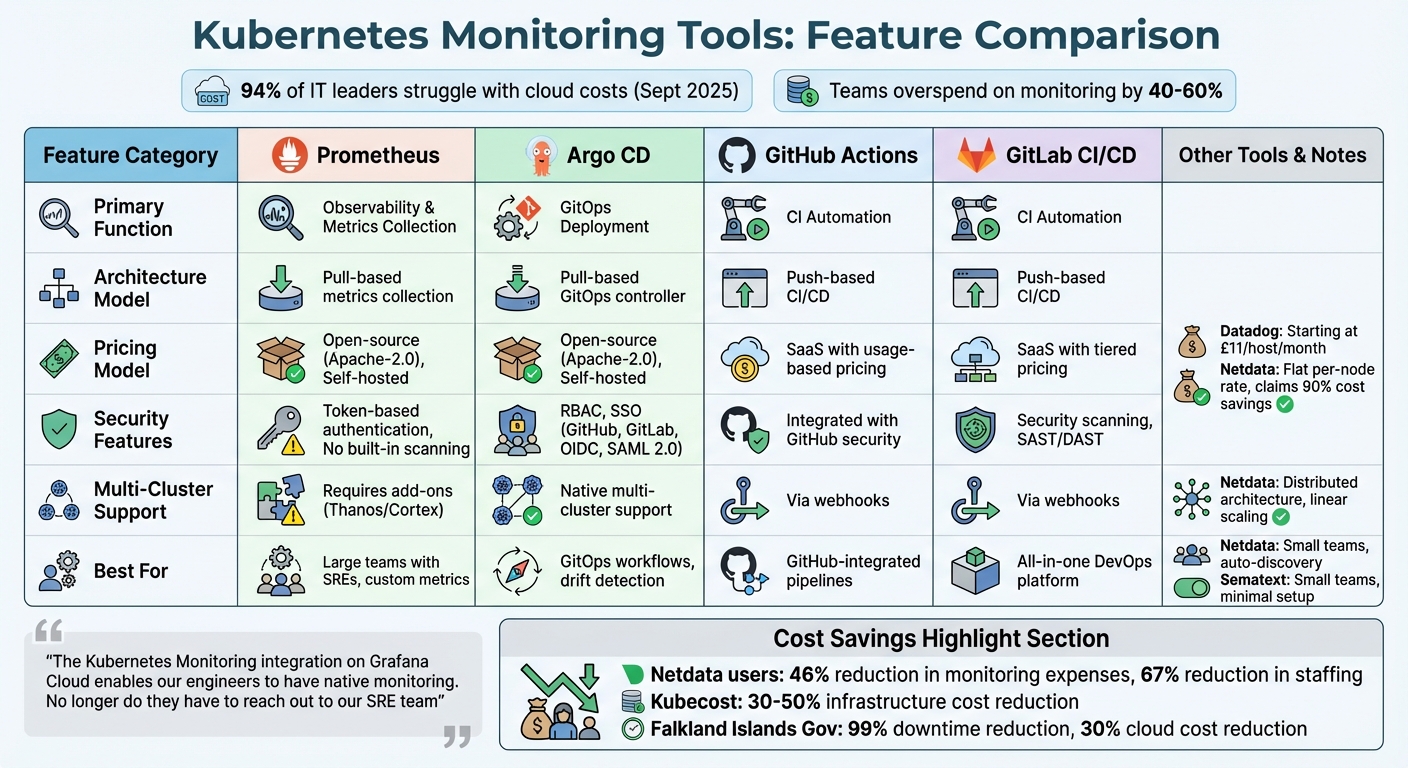 {Kubernetes CI/CD Monitoring Tools Comparison: Features, Pricing, and Use Cases}
:::
{Kubernetes CI/CD Monitoring Tools Comparison: Features, Pricing, and Use Cases}
:::
Choosing the right monitoring tool becomes much simpler when you understand what each one offers. These tools cater to a range of needs, from collecting metrics to supporting GitOps workflows, each with its own strengths and limitations. Here's a breakdown of their key differences to help you decide.
Argo CD is the only tool fully designed for GitOps. It uses a pull-based controller to keep Kubernetes clusters in sync with Git repositories, offering automated drift detection via its web interface [11][16]. On the other hand, Prometheus focuses on observability, gathering millions of metrics to monitor resource health [17]. GitHub Actions and GitLab CI/CD are primarily built for CI automation, employing a push-based model. However, they can integrate into GitOps workflows through webhooks [16]. These distinctions set the stage for comparisons across pricing, security, and scalability.
Pricing Models
Pricing varies widely across these tools. Both Prometheus and Argo CD are open-source under the Apache-2.0 licence, making them free to self-host [11][15]. Managed services like Grafana Cloud offer tiered pricing, while self-hosting comes with typical AWS expenses [17]. For those looking to save, Netdata provides a flat per-node rate with unlimited metrics and logs, claiming up to 90% cost savings compared to traditional options [18]. Meanwhile, Datadog starts at £11 per host per month, but costs can rise quickly with an increasing number of containers [5].
Security Features
Security is another area where these tools differ. Argo CD offers advanced features like RBAC and SSO integration (supporting GitHub, GitLab, OIDC, and SAML 2.0), making it suitable for secure, multi-tenant environments [16]. In contrast, Prometheus relies on token-based authentication and lacks built-in security scanning [15]. For organisations needing deeper security insights, Dynatrace provides runtime vulnerability analytics, though it follows an enterprise pricing structure [19].
Multi-Cluster Support
When it comes to managing multiple clusters, architectural differences become apparent. Argo CD supports multi-cluster environments natively through its declarative configuration [16]. Prometheus, however, requires add-ons like Thanos or Cortex to enable robust multi-cluster visibility and long-term data storage [2][5]. Netdata takes a different approach, using a distributed architecture where each cluster runs independently. This design avoids central bottlenecks and allows for linear scaling [18].
The Kubernetes Monitoring integration on Grafana Cloud enables our engineers to have native monitoring. No longer do they have to reach out to our SRE team[3].
Each tool brings unique advantages to the table, from pricing flexibility to advanced security features and scalable architectures. Understanding these differences can help you make an informed choice based on your specific needs.
Selecting the Right Tools
Choosing the right monitoring tools isn't just about features - it’s about finding a balance between your team’s expertise, infrastructure needs, security priorities, and budget. Striking this balance can save a lot of headaches (and money), especially since research shows many teams overspend on monitoring by 40–60% [8].
Start with your team’s size and skill set. For smaller teams, tools like Netdata or Sematext are ideal. They automatically discover services, reducing the workload for developers [5][6][8]. On the other hand, larger organisations with dedicated Site Reliability Engineers (SREs) often lean toward Prometheus and Grafana. While these require more manual setup, they offer extensive customisation options. In fact, users of Grafana Cloud's Kubernetes Monitoring noted significant reductions in custom development time [3][5].
Infrastructure complexity also plays a major role. If you're managing multi-cloud or hybrid setups, you’ll need tools that provide unified visibility across providers - Datadog and Netdata are strong contenders here [5][8]. For high-scale environments, a standard Prometheus setup might struggle without distributed time-series databases like Thanos or Cortex to handle the load [2]. Security-focused organisations should look at pull-based CI/CD workflows like those in Argo CD, which avoid storing sensitive cluster credentials on external servers [20]. If data sovereignty is a concern, self-hosted tools such as SigNoz or Netdata allow you to keep metrics and logs on-premises, ensuring compliance with strict regulatory requirements [5][8].
Budget is another critical factor. Open-source tools can save on licensing fees but often come with the added cost of infrastructure management. Meanwhile, SaaS solutions minimise operational overhead but can lead to escalating costs as your cluster scales. For instance, Netdata users reported a 46% cut in monitoring expenses and a 67% reduction in staffing needs [8].
A practical approach is to start with native tools like Kubernetes Dashboard or cAdvisor for initial assessments [5][9]. Set up budget alerts to catch overspending early, and prioritise tools that align with your team’s current capabilities [3][5][7]. This way, you can optimise both performance and costs while avoiding unnecessary complexity.
Implementation Best Practices
To maintain smooth operations in your Kubernetes CI/CD pipelines, integrating monitoring tools is a must. These tools help you identify and fix problems quickly. By centralising observability - combining metrics (in Prometheus format), logs (from standard output/error), and traces (via OpenTelemetry Protocol) - you get a full view of your system. This unified setup eliminates the hassle of jumping between tools to figure out what’s going on, making it easier to manage alerts and track performance benchmarks effectively [2].
The idea of a single pane of glass
is especially useful in this context. It allows instant data correlation during incidents, saving time and effort [3][22]. Take Beeswax, for example: their Lead Site Reliability Engineer, James Wojewoda, used Grafana Cloud’s native monitoring integration to empower engineers with self-service troubleshooting. By providing dashboards that display CPU usage, logs, and metrics, the team significantly reduced the need for engineers to rely on SREs for routine issues [3].
The Kubernetes Monitoring integration on Grafana Cloud enables our engineers to have native monitoring. No longer do they have to reach out to our SRE team. Instead, they just click a button... and see all the information - CPU usage, logs, metrics - they need to solve the problem themselves[3].
When managing alerts, focus on high-value metrics to avoid overwhelming your team with unnecessary notifications. Metrics like API request rates, call errors, and latency are particularly useful for spotting service issues quickly, compared to more detailed resource metrics [22]. Alerts should also be routed directly to the relevant team instead of being broadcast broadly, reducing noise and improving response times [22]. For instance, in 2025, the Falkland Islands Government’s adoption of Netdata’s automated alerting system cut website downtime by 99% and reduced their cloud costs by 30% through better resource allocation [8]. Similarly, Codyas, a tech firm, lowered their monitoring staff requirements by 67% and cut operational costs by 46% using AI-powered tools for incident detection [8].
To support long-term planning, keep historical data for trend analysis and capacity forecasting [23][4]. Tools like kube-state-metrics are great for monitoring deployments and pods, and you can set alerts for unhealthy nodes or failed pods [21]. For example, thresholds could trigger alerts when average CPU or memory usage exceeds 90% over a sustained period [4]. Using Helm charts to deploy monitoring agents like Fluent Bit or OpenTelemetry Collector ensures consistent configurations across your infrastructure, making management simpler [14][3]. Centralising logs and metrics with node-level agents also preserves temporary pod data, which is essential for post-mortem analysis even after pods are terminated [2][4]. Establishing performance baselines further integrates monitoring into the deployment process.
Embedding monitoring into your CI/CD pipeline takes things a step further. By using metrics to analyse your infrastructure during deployments, you can automate stop/go decisions or trigger rollbacks for failed releases [22]. Following these practices not only improves resource management but also optimises your Kubernetes CI/CD processes.
Conclusion
Monitoring Kubernetes CI/CD resources effectively depends on choosing tools that align with your operational goals and technical expertise. Core options like Prometheus, Argo CD, GitHub Actions, and GitLab CI/CD excel in tracking metrics, deployments, and pipelines. For cost management, tools like Kubecost can cut infrastructure expenses by 30–50% by identifying and eliminating waste [7].
When selecting tools, consider how they fit into your operational structure. Open-source, self-hosted tools grant full control over your data and eliminate licensing costs, but they require a solid investment in infrastructure and maintenance skills. On the other hand, managed SaaS platforms provide quicker implementation and AI-powered insights, though they may lead to unpredictable expenses as usage scales [5].
The way you implement these tools is just as critical as the tools themselves. Using open standards like OpenTelemetry can help avoid vendor lock-in and ensure flexibility [5]. Proactive measures, such as setting up alerts with clear thresholds, enforcing resource quotas, and regularly reviewing monitoring data, are vital for maintaining peak performance. Tools offering per-second data granularity are particularly useful for catching fleeting issues that might go unnoticed with minute-based monitoring [18].
Monitoring doesn’t just improve performance - it can also lead to substantial cost savings. With 94% of IT leaders struggling to manage cloud costs as of September 2025 [9], integrating cost visibility into your monitoring strategy is essential. Tools that provide detailed insights into spending across namespaces, pods, and clusters empower teams to optimise resource allocation and make smarter decisions about rightsizing.
FAQs
How do Prometheus and Argo CD differ when monitoring Kubernetes resources?
Prometheus and Argo CD cater to different needs when it comes to keeping an eye on Kubernetes resources.
Prometheus is a robust toolkit designed for monitoring and alerting. It collects detailed metrics on resource usage, system performance, and overall health across your Kubernetes environment. This makes it perfect for tracking cluster-wide data, spotting trends, and setting up custom dashboards to visualise key metrics and alerts.
On the other hand, Argo CD is a GitOps-focused continuous delivery tool. Its strength lies in monitoring application deployments and synchronisation statuses. It provides insights into application health, reconciliation times, and deployment workflows, offering a more focused view of Kubernetes applications.
Prometheus excels at system-wide monitoring, while Argo CD hones in on deployment-specific metrics. Together, they can work seamlessly to cover both broad and application-specific monitoring needs.
How do tools like Trivy and KubeLinter improve security in Kubernetes CI/CD pipelines?
Tools like Trivy and KubeLinter are essential for bolstering the security of Kubernetes CI/CD pipelines. Trivy focuses on scanning for vulnerabilities across container images, code repositories, and infrastructure-as-code configurations. This helps uncover potential risks early in the development cycle, well before deployment. On the other hand, KubeLinter examines Kubernetes manifests for misconfigurations, ensuring your resources align with recommended best practices.
Incorporating these tools into your CI/CD workflows allows you to tackle security issues proactively, maintain compliance standards, and strengthen your deployment pipeline. The result? Fewer security incidents and a smoother path to delivering dependable, secure applications.
What should I consider when choosing between open-source and SaaS tools for monitoring Kubernetes resources?
When weighing up open-source versus SaaS tools for monitoring Kubernetes, it’s essential to consider costs and management needs. Open-source options like Grafana are self-hosted, so your expenses are limited to infrastructure and upkeep. While this can save money, it demands a skilled team to handle the setup and maintenance. SaaS tools, on the other hand, come with subscription fees but take care of management for you, streamlining operations - though often at a higher price.
Customisation and scalability are equally important. Open-source tools give you the freedom to tailor them to your exact requirements. However, this flexibility comes with the responsibility of regular maintenance. SaaS tools, by contrast, come pre-configured with features and can scale automatically, making them a convenient choice for organisations with fewer resources or less technical expertise.
Your decision will ultimately hinge on your organisation's specific needs, budget constraints, and capacity to manage the complexities of Kubernetes monitoring.