
Want faster apps and fewer errors? Application Performance Monitoring (APM) tools are your best bet. They help identify slowdowns, trace issues to their root cause (e.g., database queries or external APIs), and improve system performance. For instance, Alaska Airlines reduced issue detection time from hours to under 10 minutes using APM tools.
Here’s a quick rundown of the top APM tools:
- Datadog: Great for cloud-native setups. Features include AI-driven anomaly detection and real-time tracing. Pricing starts at £24/month per host.
- New Relic: Full-stack monitoring with usage-based pricing (£0.23/GB after 100 GB free). Ideal for teams consolidating tools.
- AppDynamics: Focuses on linking performance to business outcomes like revenue. Offers AI-driven insights and custom pricing.
- Dynatrace: Known for its AI-powered root cause analysis and automated setup. Pricing is tailored to needs.
- Splunk Observability Cloud: Excels in real-time troubleshooting with flexible pricing options.
Key features to look for:
- AI-powered anomaly detection
- Distributed tracing for microservices
- Support for OpenTelemetry
- Synthetic monitoring to simulate user traffic
- Deep database visibility
Quick Tip: Use free trials (14–30 days) to test how these tools fit your infrastructure. Focus on metrics like tail latency (95th/99th percentiles) to measure real user impact.
The right APM tool can transform how your systems perform. Choose based on your tech stack, deployment model, and business goals.
Application Performance Monitoring Tools
Datadog
Datadog is a go-to choice for monitoring cloud-native environments like Kubernetes and microservices. Its Single Step Instrumentation feature ensures visibility in just minutes, while the Watchdog AI automatically identifies latency anomalies to speed up investigations. One standout feature is Tracing without Limits, which allows real-time search and analysis of all traces without sampling, offering detailed, thread-level insights into execution and resource usage. Recognised as a Leader in the 2025 Gartner Magic Quadrant for Observability Platforms, Datadog offers a 14-day free trial, with pricing plans starting at £24 and going up to £31 per month [4][7][13].
New Relic
New Relic delivers full-stack observability with an agent-based system that monitors web applications in real-time. It supports multiple programming languages, including Java, .NET, Node.js, PHP, Python, and Ruby. The platform excels in tracking detailed transactions and SQL performance, making it easier to pinpoint database-related latency issues. New Relic provides a free tier with 100 GB of data ingestion per month, after which it operates on a pay-as-you-go basis at approximately £0.23 per gigabyte. Its user-friendly interface makes it particularly appealing for teams new to application performance monitoring (APM) [4][12].
AppDynamics

AppDynamics focuses on linking technical performance to business outcomes, such as revenue impact, through its monitoring of key business transactions. Its Cognition Engine, powered by AI and machine learning, automates anomaly detection and offers code-level visibility to help identify issues in third-party APIs or specific lines of code. In 2024, Nemo Hajiyusuf, Software Engineering Manager at Alaska Airlines, highlighted how AppDynamics drastically improved their detection times:
With AppDynamics, our mean time to detection went from hours to less than 10 minutes, which is a huge win for us.[9]
Similarly, Tim Masey, Vice President of IT Infrastructure & Security at Carhartt, praised its comprehensive visibility:
AppDynamics is the only solution to offer visibility into every corner of our environment and identify areas of weakness and opportunity.[8]
AppDynamics offers a 30-day free trial, with Premium and Enterprise pricing available upon request [4].
Dynatrace

Dynatrace leverages its Davis AI for root cause analysis and PurePath technology for detailed transaction tracing across multi-cloud environments. Its OneAgent feature automatically detects server components and configuration changes in real time, eliminating the need for manual setup. Additionally, continuous code-level profiling pinpoints I/O bottlenecks and memory leaks down to the exact method name. For example, Kroger reported a 99% reduction in support tickets thanks to Dynatrace’s AI-driven monitoring. Chung Wing Mok from WeLab Bank also shared:
Dynatrace's Davis AI engine provides us with insights for early detection of potential system issues without false alarms, reducing the time required to identify root causes from hours to minutes.[10]
Dynatrace was recognised as the leader in Vision
in the 2025 Gartner Magic Quadrant for Digital Experience Monitoring. The platform offers a 15-day free trial, with subscription pricing tailored to specific monitoring needs [4][10][11].
Splunk Observability Cloud
Splunk Observability Cloud is designed for real-time troubleshooting and predictive analytics across hybrid environments. It excels in correlating large volumes of log data with performance metrics, helping organisations minimise downtime and improve reliability. The platform integrates with Splunk Log Observer Connect, enabling logs to be analysed alongside APM data for faster issue resolution. This makes it a strong choice for organisations requiring high availability while managing complex infrastructures. Splunk offers a 14-day free trial with flexible pricing options based on workload, data volume, or host count, supporting both SaaS and on-premise deployments [4][8][9].
Next, we explore features that can further optimise system throughput and reduce latency.
Observability vs. APM vs. Monitoring
Features That Improve Throughput and Reduce Latency
When choosing an APM tool, certain features play a key role in managing high traffic and improving response times. One standout capability is AI-driven anomaly detection. Tools like Dynatrace's Davis AI and Datadog's Watchdog automatically create performance baselines, cutting through the noise to identify the root cause of slowdowns. This automation eliminates the need for manual threshold adjustments, allowing teams to focus on real problems.
Code profiling is another critical feature. It detects bottlenecks in areas like I/O, CPU-heavy tasks, and memory leaks in real time, enabling developers to optimise the specific parts of their code causing issues. When paired with distributed tracing across microservices, it offers complete insight into the sources of latency. Tools that capture 100% of traces ensure even intermittent performance spikes aren’t missed [14][16].
Support for OpenTelemetry (OTel) is becoming increasingly crucial in cloud-native environments. OTel provides a standardised way to collect telemetry data, ensuring compatibility across different technology stacks. This not only prevents vendor lock-in but also allows organisations to instrument their systems once while maintaining flexibility in their monitoring tools [14]. Such standardisation is the foundation for more proactive monitoring strategies.
Synthetic monitoring is another valuable feature. By simulating user traffic, it identifies latency issues before they impact real users. Combining this with Service Level Objectives (SLOs) helps teams measure performance against business-specific KPIs, like checkout times or API response speeds, aligning technical metrics with broader business goals [15][18].
Additionally, deep database visibility pinpoints whether slowdowns are caused by inefficient SQL queries or resource saturation. This capability maps out the relationships between services and their database dependencies, offering an end-to-end view of performance [11][16].
These features can lead to major operational benefits. For example, Equinox managed to cut deployment fix times by up to 50% after adopting Elastic APM to monitor over 200 microservices [14]. IT teams, who often spend 60–70% of their time on manual troubleshooting, can significantly reduce this burden with these tools, freeing up resources for more strategic work [17].
Need help optimizing your cloud costs?
Get expert advice on how to reduce your cloud expenses without sacrificing performance.
Tool Comparison
::: @figure 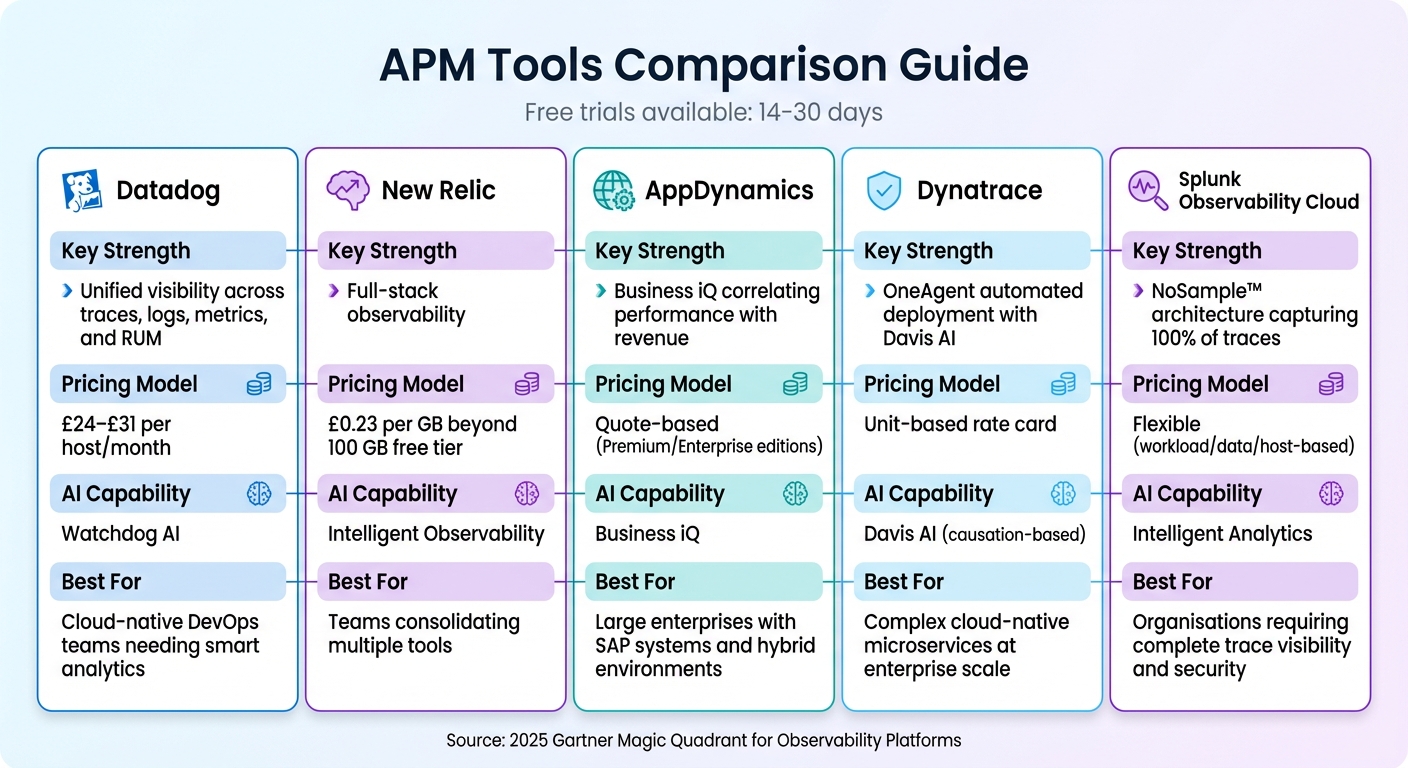 {APM Tools Comparison: Features, Pricing, and Best Use Cases}
:::
{APM Tools Comparison: Features, Pricing, and Best Use Cases}
:::
APM tools each bring unique advantages, so the right choice depends on your infrastructure, budget, and specific needs. Datadog offers a comprehensive view of traces, logs, metrics, and RUM, making it particularly suited for cloud-native setups. Its Watchdog AI simplifies root cause analysis, while its quick, single-step instrumentation ensures teams can get started in minutes [7]. This reinforces Datadog’s reputation for quick deployment and smart AI features, as highlighted earlier.
New Relic provides full-stack observability with a usage-based pricing model of approximately £0.23 per GB after an initial free 100 GB monthly tier [4][20]. This model has proven highly effective for companies like BlackLine, which saved £12.4 million annually (around $16 million) by consolidating monitoring tools in 2025 [20]. Additionally, New Relic has been recognised as a Gartner® Magic Quadrant™ Leader 13 times consecutively as of 2025 [20], further building on its strong credentials.
AppDynamics differentiates itself with its Business iQ feature, which links application performance directly to business outcomes like revenue and conversion rates [8]. For instance, Carhartt saved over £387,000 (more than $500,000) and avoided service outages worth millions [8]. Similarly, Alaska Airlines achieved remarkable efficiency gains, with Software Engineering Manager Nemo Hajiyusuf noting:
With AppDynamics, our mean time to detection went from hours to less than 10 minutes, which is a huge win for us[9].
Dynatrace uses its Davis AI engine for causation-based root cause analysis and OneAgent for automated full-stack deployment [11][1]. This combination has led to a 99% reduction in support tickets [11]. On the other hand, Splunk Observability Cloud employs a NoSample™ architecture to capture 100% of transaction traces, ensuring no performance anomalies are overlooked [1]. This makes it especially valuable for organisations handling high transaction volumes and needing complete visibility. Below is a comparison table summarising the key strengths and pricing models of each tool.
Comparison Table
| Tool | Key Strength | Pricing Model | AI Capability | Best For |
|---|---|---|---|---|
| Datadog | Unified visibility across traces, logs, metrics, and RUM | £24–£31 per host/month (approx. $31–$40) | Watchdog AI | Cloud-native DevOps teams needing smart analytics |
| New Relic | Full-stack observability | £0.23 per GB beyond 100 GB free tier (approx. $0.30) | Intelligent Observability | Teams consolidating multiple tools |
| AppDynamics | Business iQ correlating performance with revenue | Quote-based (Premium/Enterprise editions) | Business iQ | Large enterprises with SAP systems and hybrid environments |
| Dynatrace | OneAgent automated deployment with Davis AI | Unit-based rate card | Davis AI (causation-based) | Complex cloud-native microservices at enterprise scale |
| Splunk | NoSample™ architecture capturing 100% of traces | Flexible (workload/data/host-based) | Intelligent Analytics | Organisations requiring complete trace visibility and security |
How to Choose the Right Tool
When selecting an APM tool, start by considering your infrastructure. If you're working with cloud-native microservices or serverless functions (like AWS Lambda or Azure App Service), look for a tool that supports distributed tracing and automatic service discovery [19]. For monolithic applications or hybrid setups, make sure the tool offers agents compatible with your tech stack - whether that's Java, .NET, Python, Go, or Node.js [21]. From there, think about your deployment model to narrow down your options further.
Your deployment model matters when it comes to balancing performance and operational needs. SaaS solutions are ideal for reducing overhead and enabling faster deployment, while self-hosted options give organisations greater control over their data - an important factor for those with strict compliance requirements [6]. Think about whether your team has the capacity to manage a self-hosted setup or if a managed service would better integrate with your DevOps workflows.
Take advantage of free trials (usually lasting 14 to 30 days) offered by most vendors to test how the tool affects system performance. These trials let you assess how well the tool keeps system overhead low, typically under 1% [22]. Start small by deploying the tool on a single service to reduce risk [2]. Pay close attention to tail latency metrics - like the 95th and 99th percentiles - rather than averages. These metrics reveal how the system performs for users facing the worst delays, giving a clearer picture of real-world impact [3].
Another key consideration is support for open standards such as OpenTelemetry (OTel) and Prometheus. These standards ensure data portability and compatibility with multiple data sources [19]. This becomes especially important as your infrastructure grows and needs to handle high-cardinality data - like unique user IDs, regions, or custom tags - without compromising performance [5]. Balancing this technical flexibility with your organisation's priorities is crucial.
Finally, align the tool with your business goals. For example, if linking application performance to revenue is a priority, AppDynamics' Business iQ might justify its premium pricing. On the other hand, if you're looking to consolidate tools, New Relic's usage-based pricing model - around £0.23 per GB beyond the free tier - could provide predictable costs [4]. Match the tool’s capabilities to your specific goals, whether that’s using AI-driven root cause analysis, achieving full trace visibility, or integrating smoothly into your CI/CD workflows.
Conclusion
Choosing the right application performance monitoring (APM) tool can significantly influence the throughput and latency of your infrastructure. Each tool discussed in this roundup - ranging from Datadog's unified observability capabilities to Dynatrace's AI-powered root cause analysis - addresses distinct performance challenges. Whether you're working with microservices, serverless architectures, or hybrid environments, the key lies in aligning a tool's features with your technical stack, deployment model, and business goals.
Modern APM platforms go beyond surface metrics. They pinpoint bottlenecks down to the code level, trace requests across distributed systems, and link application performance directly to infrastructure health. This ability to connect technical insights to operational outcomes makes selecting the right tool a crucial step in maintaining a competitive edge.
While these tools offer powerful features, bridging the gap between implementation and optimal performance often requires expert guidance. Engineering teams managing high-cardinality data - such as user IDs, regions, or feature flags - can encounter scaling challenges and unpredictable costs [5]. Custom instrumentation and strategic configurations are essential, but many teams lack the resources or expertise to execute these effectively.
This is where tailored consulting services come into play. For instance, Hokstad Consulting specialises in enhancing DevOps workflows, optimising cloud infrastructure, and reducing hosting costs. They help businesses address instrumentation challenges and align infrastructure with actual usage patterns. Their services include cloud cost engineering (with potential savings of 30–50%), seamless migrations with zero downtime, and custom development to automate deployment processes. These efforts are designed to complement your APM strategy, ensuring your monitoring tools deliver measurable performance gains.
From improving detection times to reducing API latency, the right combination of monitoring tools and expert support can redefine how your applications perform in real-world scenarios. By integrating these tools with strategic guidance, you can turn monitoring efforts into tangible improvements across your systems.
FAQs
What should I look for in an Application Performance Monitoring (APM) tool?
When selecting an APM tool, it's crucial to focus on real-time insights into essential metrics such as response times, throughput, error rates, and resource usage (like CPU, memory, and network performance). A tool that offers end-to-end transaction tracing is invaluable, as it helps pinpoint bottlenecks across services, APIs, or databases with precision.
Key features to consider include integrated log collection, analytics powered by AI to detect anomalies, and forecasting tools that anticipate performance issues before they impact users. Practical factors like low monitoring overhead, support for multiple programming languages, and compatibility with modern environments such as Kubernetes or serverless architectures are equally important. Tools with customisable alerts, intuitive visualisations, and role-based access controls ensure a balance of efficiency and ease of use.
For expert guidance, Hokstad Consulting can assist in choosing and implementing an APM solution tailored to your organisation’s performance requirements and budget optimisation strategies.
How do APM tools connect application performance to business results?
APM tools take technical data - like response times, error rates, and throughput - and turn it into actionable insights that matter to businesses. For example, they reveal how issues like latency or downtime affect customer satisfaction, conversion rates, and even revenue. By tying these metrics to key performance indicators (KPIs), organisations gain a clear picture of how application performance directly impacts both user experience and financial results.
With this understanding, businesses can focus on improvements that minimise downtime, enhance speed, and safeguard revenue, ensuring their applications consistently deliver value.
Why is OpenTelemetry support essential in application performance monitoring tools?
OpenTelemetry plays a key role by offering a standardised, vendor-neutral framework for gathering and analysing telemetry data across various systems and programming languages. This approach ensures systems work well together, minimises dependence on specific vendors, and prevents data from becoming isolated in silos.
With its ability to provide detailed context and smooth integration, OpenTelemetry enables teams to pinpoint and address performance problems more quickly, simplifying the troubleshooting process and boosting overall productivity.