
Managing cloud costs across AWS, Azure, and Google Cloud is complex. Each platform has different billing structures, making it hard to track spending. Multi-cloud cost tools simplify this by providing a unified view, real-time insights, and automation to control expenses. Here's what you need to know:
- Unified Cost Data: Consolidates billing from multiple providers into a single format, enabling easier comparisons and analysis.
- Real-Time Visibility: Detects cost anomalies as they happen, avoiding surprises on monthly invoices.
- Granular Allocation: Assigns costs to specific teams, projects, or departments using resource tags.
- Optimisation Across Clouds: Identifies cost-saving opportunities by comparing services and regions.
- Automation: Rightsizes resources and manages commitments to reduce waste.
- Kubernetes Cost Tracking: Breaks down expenses within shared clusters for better accountability.
- Governance: Enforces policies to avoid overspending and ensures resources are used efficiently.
- DevOps Integration: Embeds cost management into CI/CD pipelines for better control during deployment.
- Reporting and Forecasting: Combines data into actionable insights and future projections.
These tools are essential for businesses operating in multi-cloud environments, helping reduce waste, improve accountability, and streamline cloud cost management.
Multi-Cloud Cost Management Tools | Vega Cloud & FinOptik
1. Unified Cost Data and Consolidation
Cloud providers each have their own way of handling billing, which can make comparing costs a headache. For instance, AWS combines compute and memory costs into line-item billing, while GCP separates these charges and organises them by project. Azure takes yet another route, using its own meter categories and service classifications. This leaves finance teams with the tedious task of manually collecting and stitching together data from various portals.
Multi-cloud cost tools step in to simplify this chaos by standardising data from different providers into a unified format. Many platforms now use the FinOps Open Cost and Usage Specification (FOCUS), which translates provider-specific fields - like AWS’s lineItem/ProductCode or Azure’s metercategory - into consistent, standardised columns. This creates a single source of truth, so there’s no need to juggle multiple dashboards anymore.
Currency differences add another layer of complexity, especially for organisations operating across regions. Invoices often come in various currencies, but consolidation tools handle this by automatically converting everything into a single reporting currency, such as £. They also synchronise billing periods, ensuring accurate, like-for-like comparisons across providers.
Some advanced platforms go even further by linking billing line items directly to Configuration Items (CIs) in a Configuration Management Database (CMDB). This means costs are tied to specific resources - like particular instances, storage buckets, or databases. By connecting billing data to actual resources, these tools give teams actionable insights into spending. The result? A clear breakdown of where every pound is going, with no need for manual reconciliation.
This unified view also makes it easier to compare providers objectively. You can pinpoint which cloud service is the most cost-effective for a specific workload, uncover hidden fees buried in complex line items, and track metrics like cost per customer or cost per transaction. Instead of waiting for monthly invoices to uncover surprises, these tools give you near real-time visibility into your entire multi-cloud setup. This level of insight lays the groundwork for more effective cost management, as explored in the next sections.
2. Real-Time Cost Visibility and Anomaly Detection
Waiting for monthly invoices to identify cost issues often means overspending goes unchecked for too long. Multi-cloud cost tools change this by refreshing data every hour, pulling directly from provider APIs like Azure Billing APIs, AWS Cost and Usage Reports, and GCP BigQuery exports. Instead of reacting to expenses that have already been incurred, these tools let you address problems as they arise. This frequent data refresh enables smarter analysis of spending trends.
The real advantage lies in machine learning algorithms that examine historical data - usually covering 90 days to a year - to define what normal
spending looks like for your setup. These systems adapt to usage patterns, accounting for differences like weekday versus weekend activity, and can tell the difference between predictable traffic spikes and actual anomalies. Any unusual deviations are flagged immediately. For example, platforms utilising real-time anomaly detection have identified over 5,500 cost issues and flagged more than £16 billion in anomalous spending [6]. As Keith MacKenzie, Content Marketing Manager at CloudZero, explains:
Scheduled anomaly detection reports what you already paid for. Real-time detection gives you a chance to stop it and change what happens next[6].
Advanced tools go beyond overall spending, offering detailed insights into specific service categories. They can pinpoint whether a cost spike comes from data transfer or compute services and connect this to specific business dimensions like teams, customers, or products. This level of detail is crucial - addressing a £5,000 anomaly in a testing environment requires a different approach than handling the same issue in production.
When anomalies are flagged, integrated alert systems send notifications directly to the relevant team or engineer via Slack, Microsoft Teams, Jira, or email. This ensures the right person is informed immediately. Some platforms, like Cast.ai, are tailored for Kubernetes environments and can detect issues in as little as 60 seconds [2], allowing teams to act before costs spiral out of control. This streamlined alerting process encourages a proactive stance across multi-cloud setups.
To make this system effective, a robust remediation workflow is essential. This involves receiving the alert, identifying the resource using tagging, taking corrective actions like resizing or shutting down workloads, and reviewing policies to avoid similar issues in the future. For experimental or high-risk projects, you could add manual percentage-based thresholds alongside machine learning alerts to maintain tighter spending control.
3. Granular Cost Allocation and Showback/Chargeback
Once you’ve achieved visibility into cloud costs, the next step is to assign every pound to its rightful owner. Without precise allocation, it’s hard to hold teams accountable for their spending. Multi-cloud cost tools solve this by using resource tags like team:engineering or project:mobile-app to attribute costs to specific teams, projects, or departments. If tagging is incomplete, these platforms step in, applying proportional rules to divide shared costs like networking or storage.
Understanding the difference between showback and chargeback is crucial for accountability. Showback provides teams with a detailed breakdown of their cloud usage without actually billing them. This approach is educational, encouraging teams to optimise voluntarily. Chargeback, on the other hand, involves real financial transactions, where departments are billed for their cloud consumption, making them directly responsible for the costs. Many organisations start with showback to educate teams and ensure data accuracy before introducing chargeback’s financial implications [7].
Shared resources - like load balancers or monitoring tools - add complexity. These costs can be split evenly, allocated proportionally based on usage, or assigned to a central IT budget. For instance, Cloudaware charges around £0.006 per Configuration Item per month for its CMDB base, with an extra 20% for the FinOps module [8]. Smaller deployments might benefit from Vantage’s free tier, which covers up to £2,000 in monthly cloud spend, while enterprise tools like Apptio Cloudability can cost between £24,000 and £105,000 annually [8]. For businesses with up to £400,000 in yearly cloud spending, Finout offers plans starting at £800 per month and boasts a 4.5/5 rating on G2 [8]. These pricing options make advanced cost allocation tools accessible to organisations of various sizes.
Granular cost allocation turns a single, overwhelming cloud bill into actionable insights by linking expenses to specific business units. This level of transparency empowers teams to rethink their resource use, uncover inefficiencies, and find ways to cut costs while maintaining performance.
4. Multi-Cloud and Multi-Region Optimisation
When comparing costs across cloud providers, regional pricing differences add another layer of complexity. Multi-cloud cost tools simplify this process by standardising billing data from sources like AWS Cost and Usage Reports, Azure Enterprise Agreements, and GCP Billing Exports. This allows for precise comparisons across regions - for example, evaluating the cost of an AWS EC2 instance in London versus an Azure Virtual Machine in Dublin [2]. This regional insight complements the broader, unified cost view, which is essential for effective cross-cloud rightsizing.
The real power of these tools lies in cross-cloud rightsizing. Instead of just suggesting a smaller instance within a single provider like AWS, these platforms analyse resource usage to recommend the best instance across providers. For instance, a memory-intensive application might perform better with Google Cloud’s decoupled pricing model than with AWS’s bundled approach [2].
Pricing for these tools varies widely, from free tiers for smaller deployments to enterprise plans. Options include subscription-based, flat-fee, and performance-based models, catering to different organisational needs.
Taking this a step further, the industry is moving towards autonomous optimisation. Tools such as Zesty and nOps now go beyond offering recommendations - they actively adjust capacity or shift workloads to cheaper spot instances in real time, based on demand [9][5]. This evolution aligns with the FinOps FOCUS framework, which standardises billing and usage data, making multi-cloud analysis more consistent [5]. By 2026, this approach has expanded to include cost optimisation for AI and ML workloads across providers like OpenAI and Anthropic [3].
Real-time optimisation is further enhanced by platforms that monitor metrics like CPU, memory, and disk I/O. For example, they can identify idle resources - such as instances with less than 5% CPU usage over 10 days - and automatically trigger rightsizing [9]. This ensures workloads are shifted between clouds based on actual performance needs and cost efficiency, delivering a smarter, data-driven approach to cloud management.
5. Automated Rightsizing and Commitment Planning
Automated rightsizing and commitment planning are two strategies that work together to help lower cloud costs. By analysing usage patterns, modern tools can suggest the best instance sizes and highlight chances to save money through Reserved Instances (RIs), Savings Plans (SPs), or Committed Use Discounts (CUDs). This helps reduce the cost of resources already in use. The process fits neatly into the unified cost management framework mentioned earlier.
These tools can also identify on-demand resources that should be covered by pre-purchased commitments. Platforms like ProsperOps and Usage.ai go a step further by automatically buying and rebalancing commitment portfolios daily. This constant adjustment to workload changes helps avoid the risk of overcommitting to resources that may no longer be needed [11].
Effective rightsizing depends on using accurate metrics. Instead of relying on simple averages for CPU or memory usage, advanced tools use p95 metrics over a 14-day period to ensure peak performance is maintained [12]. For example, instances with less than 5% CPU usage over 10 days can be flagged for action. Policy-driven rules can then automate responses, such as creating a Jira ticket or shutting down the underused instance [9].
Real-world examples highlight the benefits of combining automated rightsizing with commitment planning. Boeing, for instance, used Cloudaware to track Azure OpenAI tokens and optimise SP/RI coverage, saving an estimated £758,000 annually. Caterpillar also leveraged Cloudaware's CMDB-driven FinOps platform to address tagging issues and improve rightsizing efficiency, achieving annual savings of around £496,000 [10]. These cases show how integrating these strategies can lead to substantial cost reductions.
Flexible pricing models further enhance these savings. For example, Zesty charges 10–20% of verified monthly savings, Usage.ai bases its fees on realised savings, and Cloudaware charges about £0.006 per configuration item per month, with an additional 20% premium for its FinOps module [9][11]. When evaluating these models, look for features like buyback protection or cashback options to reduce the risks associated with commitments.
6. Storage Cost Optimisation and Data Lifecycle Management
Managing data without a clear strategy can quickly eat into cloud budgets, especially when all data is treated the same. A 2024 study revealed that 63% of object storage costs come from data stored in Standard storage classes, even when more affordable tiers like Nearline or Coldline would suffice [13]. Modern cost management tools help tackle this by identifying unused resources, such as unattached block storage volumes from AWS EBS or Azure Managed Disks, which silently rack up expenses. These tools also analyse usage patterns, suggesting when to shift data from hot
storage to more economical cool
or archive
tiers. This makes automated strategies essential for keeping storage costs under control.
Automated lifecycle policies are a game-changer. These policies can move objects between storage classes or delete them based on criteria like age, modification date, or version state. By implementing such policies, organisations can cut storage costs by 30%–50%, translating to savings of around £153,600 annually for 100TB of Standard storage. Tools like Terraform are often used to define these policies, ensuring consistency and making audits easier [13].
Understanding the pricing structure of different storage tiers is key to making smart decisions. For example, under GCP pricing, Standard storage costs about £0.016 per GB per month, while Coldline and Archive tiers are significantly cheaper at £0.003 and £0.001 per GB, respectively [13]. However, retrieval fees can add up - Nearline retrieval costs £0.008 per GB, whereas Coldline or Archive retrieval jumps to £0.040 per GB. Always factor in these fees before moving data to ensure savings outweigh the costs.
Beyond tiering, advanced cost tools tackle other inefficiencies, such as redundant snapshots that accumulate over time. They can also delete failed multipart uploads automatically, saving space and money. For workloads with lower input/output demands, these tools might recommend switching from pricey SSDs to more affordable HDDs. Block storage autoscaling is another feature that dynamically adjusts volume sizes, preventing overprovisioning and keeping costs lean.
When optimising storage, avoid moving objects under 128KB to Infrequent Access tiers, as these tiers have minimum charge requirements [14]. Also, be mindful of minimum storage duration charges - 90 days for Glacier and 180 days for Deep Archive - since deleting data prematurely can lead to penalties [14][15]. For workloads with unpredictable access patterns, features like Autoclass can be helpful. Although they come with extra management fees, they automatically reassign objects based on real usage patterns [13]. Lastly, setting up rules to delete incomplete multipart uploads after seven days can reclaim wasted space and further trim costs [13].
7. DevOps and CI/CD Pipeline Integration
Integrating cost management into DevOps workflows takes budget control to the next level. By embedding cost considerations directly into development processes, teams can avoid overspending before it even happens. Modern tools now integrate seamlessly into CI/CD pipelines, offering cost estimates before deployment. For instance, Infracost works with Terraform plans in platforms like GitHub Actions or GitLab pipelines, providing cost breakdowns directly in pull requests. This setup allows developers to see the financial impact of their changes before merging, following a shift-left
approach that catches expensive errors early, when they’re easiest to address [17].
Without such integration, cloud expenses can spiral out of control. Currently, only 39% of organisations track unified spending across all cloud platforms [16]. Additionally, SaaS startups lose over 40% of their cloud budgets to issues like untagged workloads or poorly aligned reserved instances [18]. To tackle this, enforcing mandatory Infrastructure as Code (IaC) tagging - such as tags for Environment, Team, Project, and CostCentre - at the resource creation stage ensures traceability throughout the development process [17].
AI-powered platforms also play a key role in controlling costs during deployment. These tools provide real-time cost insights while keeping deployment speeds intact. Solutions like Sedai and Zesty automatically adjust resources based on workload demand, removing the need for manual intervention [16]. By automating these repetitive tasks, such platforms can boost engineering productivity by up to six times. They monitor application performance and adjust resource sizes dynamically, ensuring efficient use of infrastructure.
For organisations seeking expert help in integrating cost management into their DevOps workflows, Hokstad Consulting offers tailored solutions. Their services include automated CI/CD pipeline setups, custom development, and cloud cost audits, which can reduce expenses by 30–50% while improving deployment cycles. Additionally, they provide AI strategies and tools to simplify infrastructure management further.
These investments align with the cost-saving strategies mentioned earlier. For example, CloudZero offers tiered pricing starting at approximately £1,500 per month for managing up to £100,000 in monthly cloud spend [9]. This enables teams to gain detailed visibility into application-level costs, allowing them to optimise resources before they become financial burdens.
8. Governance Controls and Policy Enforcement
Effective governance plays a vital role in managing multi-cloud costs. Without it, cloud budgets can spiral out of control, exceeding planned expenses by as much as 30% [20]. Multi-cloud cost tools tackle this issue by implementing policy-driven guardrails that curb unauthorised resource use and overspending.
Take Flexera One, for instance. It includes over 150 pre-configured policies aimed at enforcing tagging standards, usage limits, and cost caps across various cloud platforms [2]. These policies can send real-time alerts when resources lack required tags or exceed budget limits. For example, a policy might block developers from launching costly GPU instances without prior approval. Such measures ensure resources are deployed efficiently and with greater control.
Role-Based Access Control (RBAC) further enhances governance by limiting access to high-cost resources [20]. This ensures only authorised personnel can deploy specialised services in specific regions. Tools like Harness take it a step further with governance-as-code, embedding cost constraints directly into Infrastructure-as-Code (IaC) templates [2]. When paired with auto-remediation in CI/CD pipelines, these tools catch and address expensive mistakes during the deployment process.
The cost of neglecting governance is steep. Around 21% of enterprise cloud infrastructure spending - estimated at £44.5 billion by 2025 - is wasted on underutilised resources [19]. Approval workflows can reduce this waste by requiring centralised reviews of new resource tags and names, ensuring every deployment is tied to a specific cost centre or project from the beginning. Additionally, some platforms align their pricing with governance outcomes. For example, Usage.ai uses ROI-based pricing, charging a percentage of the actual savings achieved [3].
These governance measures not only minimise waste but also promote disciplined and cost-effective cloud management.
9. Kubernetes-Specific Cost Attribution
When it comes to managing Kubernetes costs, the challenge lies in breaking down expenses within shared clusters. Traditional cloud billing tools treat virtual machines as straightforward line items but fail to provide insight into the intricate workings of Kubernetes clusters. These clusters often host multiple applications, teams, and microservices, making cost attribution a complex task. In fact, 44% of organisations report being unable to allocate Kubernetes costs at the workload level [30,34].
To address this, effective tools can track costs at various levels - namespace, pod, and even container. For many mid-sized organisations, starting with namespace-level attribution is common. This approach calculates each namespace's share of the total cluster resource requests, achieving an accuracy of 60–70% [21]. For those seeking more precision, pod-level attribution can push accuracy to 85–90% by using a weighted formula. A commonly recommended split is 70% based on resource requests and 30% on actual consumption [21].
More advanced tools go further by deploying agents that monitor CPU and RAM usage every 15 seconds. This method provides detailed cost insights at the container level, unlike broader API-based approximations [22]. Such precision is critical because up to 70% of requested Kubernetes CPU and memory resources go unused, with average CPU utilisation reaching only about 10% [21]. Without this level of visibility, inefficiencies like these often remain hidden.
Shared costs, such as control plane overhead, idle capacity, and monitoring, should also be distributed proportionally across tenants. This is often done by treating these expenses as a platform tax
or spreading them based on resource usage. For example, shared services might add a 15% overhead, allocated according to each team's share of total cluster requests [30,31].
To ensure accurate cost allocation, enforce resource requests. Without them, the entire process breaks down. Tools like LimitRange or admission controllers can prevent pods without resource requests from running in production environments [29,32]. Additionally, a strict labelling policy is essential. Requiring labels such as owner, team, and cost-centre on all namespaces and workloads helps eliminate unattributed spending [23].
This granular approach builds on earlier unified cost views, offering deeper insights into Kubernetes environments while tackling inefficiencies and improving cost management.
10. Reporting and Forecasting
Good reporting takes raw cost data and turns it into useful insights. The top tools combine billing data from AWS, Azure, and GCP into one streamlined dashboard, eliminating the need to juggle multiple platforms [24][2][5]. This unified view highlights key trends, current expenses, and future projections, which are crucial for effective financial planning.
Interactive forecasting features allow teams to break down projections by account, business unit, or specific date ranges. This level of detail helps finance teams plan ahead, adjusting budgets before overspending becomes an issue [10][25]. Many organisations have achieved notable savings by using these kinds of tools.
With a single, cohesive view, advanced reporting tools go a step further by offering predictive capabilities. Many now include AI-driven insights that automatically detect trends and anomalies, saving teams from the time-consuming task of creating reports manually [25]. This is especially important as 84% of organisations cite managing cloud costs as one of their biggest challenges [25]. Industry-wide standardisation efforts, such as FinOps FOCUS, are also helping by creating consistent cost data formats across providers [5].
Customisable dashboards add another layer of flexibility, offering role-specific views. For instance, engineering teams may need detailed metrics on resources, while executives benefit from broader budget summaries. Tools that allow reports to be exported in various formats and scheduled for automatic delivery streamline the reporting process for all stakeholders. By linking reporting directly with forecasting models, organisations can run what-if
scenarios - like evaluating the financial impact of scaling a service or shifting workloads to different regions - making decision-making much more informed and efficient.
Comparison Table
::: @figure 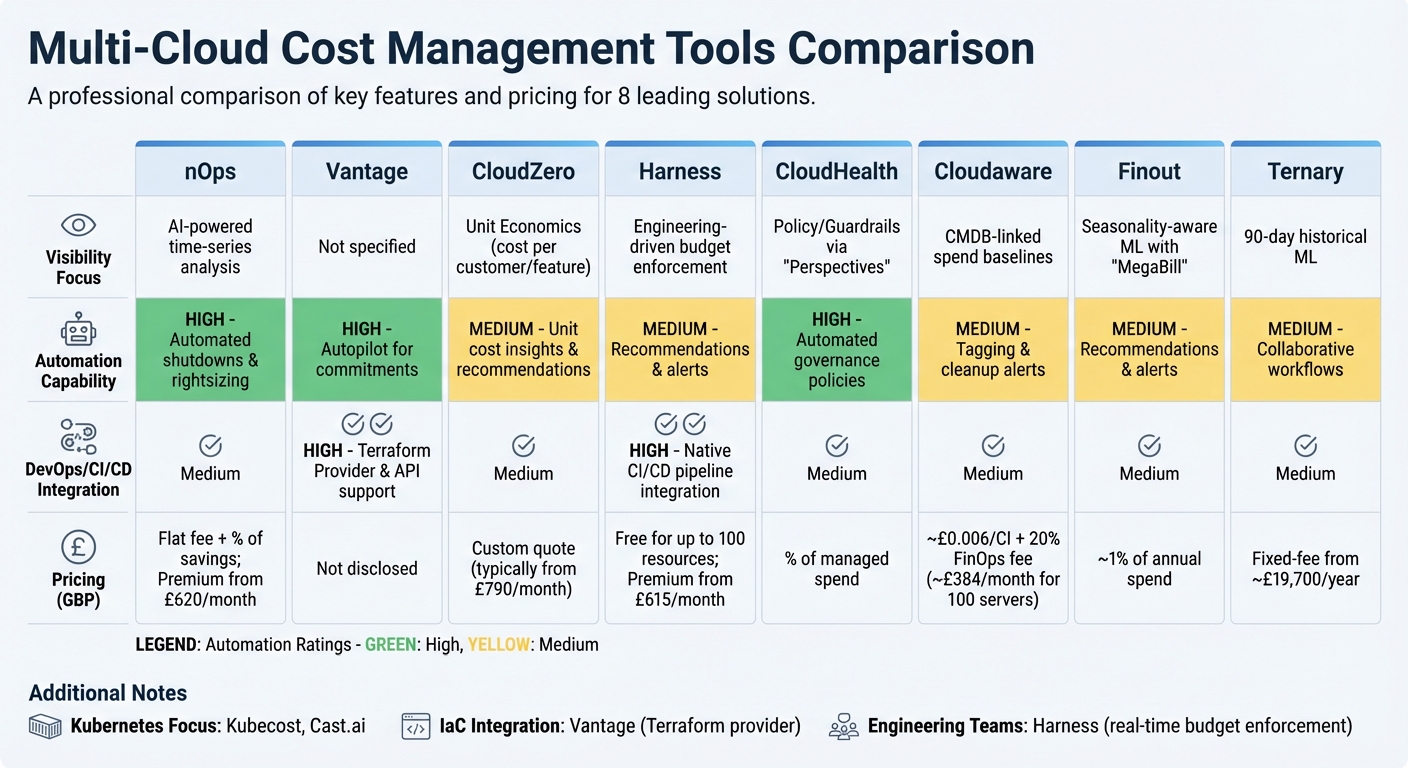 {Multi-Cloud Cost Management Tools Comparison: Features and Pricing}
:::
{Multi-Cloud Cost Management Tools Comparison: Features and Pricing}
:::
When evaluating multi-cloud cost tools, it's essential to weigh factors like visibility, automation, and DevOps integration. Here's a breakdown of key features and pricing estimates (converted to GBP where applicable) for some popular tools:
| Tool | Visibility Focus | Automation Capability | DevOps/CI/CD Integration | Pricing Model (Est. GBP) |
|---|---|---|---|---|
| nOps | AI-powered time-series analysis | High: Automated shutdowns & rightsizing | Medium | Flat fee + % of savings; Premium from £620/month [10][1] |
| Vantage | - | High: Autopilot for commitments | High: Terraform Provider & API support [3] | Not disclosed |
| CloudZero | Unit Economics (cost per customer/feature) [2] | Medium: Unit cost insights & recommendations | Medium | Custom quote (typically from £790/month) [10] |
| Harness | Engineering-driven budget enforcement | Medium: Recommendations & alerts | High: Native CI/CD pipeline integration [10] | Free for up to 100 resources; Premium from £615/month [10] |
| CloudHealth | Policy/Guardrails via Perspectives[10] |
High: Automated governance policies | Medium | % of managed spend |
| Cloudaware | CMDB-linked spend baselines | Medium: Tagging & cleanup alerts | Medium | ~£0.006/CI + 20% FinOps fee (~£384/month for 100 servers) [10] |
| Finout | Seasonality-aware ML with MegaBill[1] |
Medium: Recommendations & alerts | Medium | ~1% of annual spend |
| Ternary | 90-day historical ML | Medium: Collaborative workflows | Medium | Fixed-fee from ~£19,700/year [4] |
Some tools stand out with specific advantages:
- Kubecost and Cast.ai focus on Kubernetes environments, offering detailed pod- and namespace-level metrics [2][10].
- For teams using Infrastructure as Code (IaC), Vantage simplifies cost policy management with its Terraform provider [3].
- Harness caters to engineering teams needing real-time budget enforcement [2][10].
Real-world examples highlight the impact these tools can have. For instance, iSpot.tv used nOps' ShareSave engine to automate commitment management, achieving 95% Reserved Instance coverage for EC2 hours [1]. Another case involved tracking Azure OpenAI tokens, leading to substantial annual savings [10].
These examples show how the right tool can go beyond basic cost visibility to deliver tangible financial benefits.
Conclusion
Selecting the best multi-cloud tool hinges on how well it aligns with your organisation's existing infrastructure and workflows. A strong starting point is data consolidation, which eliminates the need for manual reconciliation across platforms like AWS, Azure, and GCP. Look for tools that integrate smoothly with the systems you already use, such as Slack, Terraform, or Jira.
It's also crucial to understand the difference between automation and alerting. Tools that simply notify your team about overspending often add to their workload. Instead, prioritise platforms that offer features like automated rightsizing, shutting down idle resources, and managing commitments. These capabilities help achieve cost savings without requiring constant manual oversight. Starting with showback reporting can help create cost awareness across teams, which can later evolve into chargeback policies for better financial accountability.
That said, tools alone won’t magically cut costs by 30–50%. Tackling inefficiencies and misconfigurations requires expertise in cloud cost engineering. This is where professional support can make a real difference.
Hokstad Consulting specialises in cloud cost engineering services designed to complement your chosen tools. Their No Savings, No Fee
model ensures you only pay if actual cost reductions are achieved. Whether you need help with strategic cloud migration, DevOps transformation, or ongoing infrastructure support, their tailored solutions address both immediate cost challenges and long-term efficiency goals.
Finally, when evaluating tools, consider your primary infrastructure. For Kubernetes-heavy setups, container-specific platforms may be ideal, while AWS-focused environments might benefit more from provider-specific automation. Aim for tools that offer real-time (hourly) data refreshes to catch cost spikes early and ensure they integrate seamlessly into your team's workflow.
FAQs
What should I check to ensure multi-cloud cost data is truly comparable?
To compare multi-cloud cost data effectively, it's essential to standardise metrics into consistent units, use uniform tagging and naming conventions, and adjust for differences in billing terms, formats, and currencies across providers. These steps help ensure precise analysis across multiple platforms.
How do real-time anomaly alerts turn into automatic cost fixes?
Real-time anomaly alerts enable organisations to spot sudden spikes or irregularities in cloud spending as they happen. These alerts work hand-in-hand with automated systems that can implement predefined cost-saving measures - like shutting down or resizing misconfigured resources - helping to avoid budget overruns and manage expenses more effectively.
How can we allocate Kubernetes costs fairly in shared clusters?
To distribute Kubernetes costs fairly in shared clusters, try namespace-based allocation. This involves setting resource quotas and tagging resources consistently, making it easier to assign costs accurately to each namespace.
You can also use advanced cost monitoring tools to gain detailed insights at the pod level. Combining this with chargeback or showback models encourages accountability among teams. These approaches not only help track actual usage but also ensure spending is optimised and costs are transparently shared across teams or projects.