
Network latency can slow down business operations, disrupt video calls, and impact productivity. To address this, monitoring tools help identify and fix latency issues. Here's a quick look at seven tools that can help you monitor and reduce network latency effectively:
- Hokstad Consulting: Specialises in customised cloud architecture optimisation, offering tailored solutions for latency reduction.
- SolarWinds NPM: Features advanced tools like NetPath™ for hop-by-hop network visualisation and AI-driven anomaly detection.
- ThousandEyes: Provides synthetic monitoring and BGP visibility to pinpoint latency sources across internal and external networks.
- PRTG Network Monitor: Offers over 250 sensors for real-time latency tracking, including VoIP-specific metrics.
- Kentik: Focuses on real-time traffic analysis with tools like Performance Mesh Testing and BGP Path Analysis.
- Obkio: Delivers high-frequency monitoring with visual traceroute tools and dynamic performance baselines.
- iPerf: A free, open-source tool for measuring bandwidth and latency through sender/receiver tests.
These tools cater to different needs, from small businesses to large enterprises, and offer features like real-time alerts, advanced path analysis, and proactive troubleshooting. Whether you're looking for a free solution like iPerf or enterprise-grade platforms like SolarWinds and ThousandEyes, there's an option to suit your network's scale and budget.
::: @figure 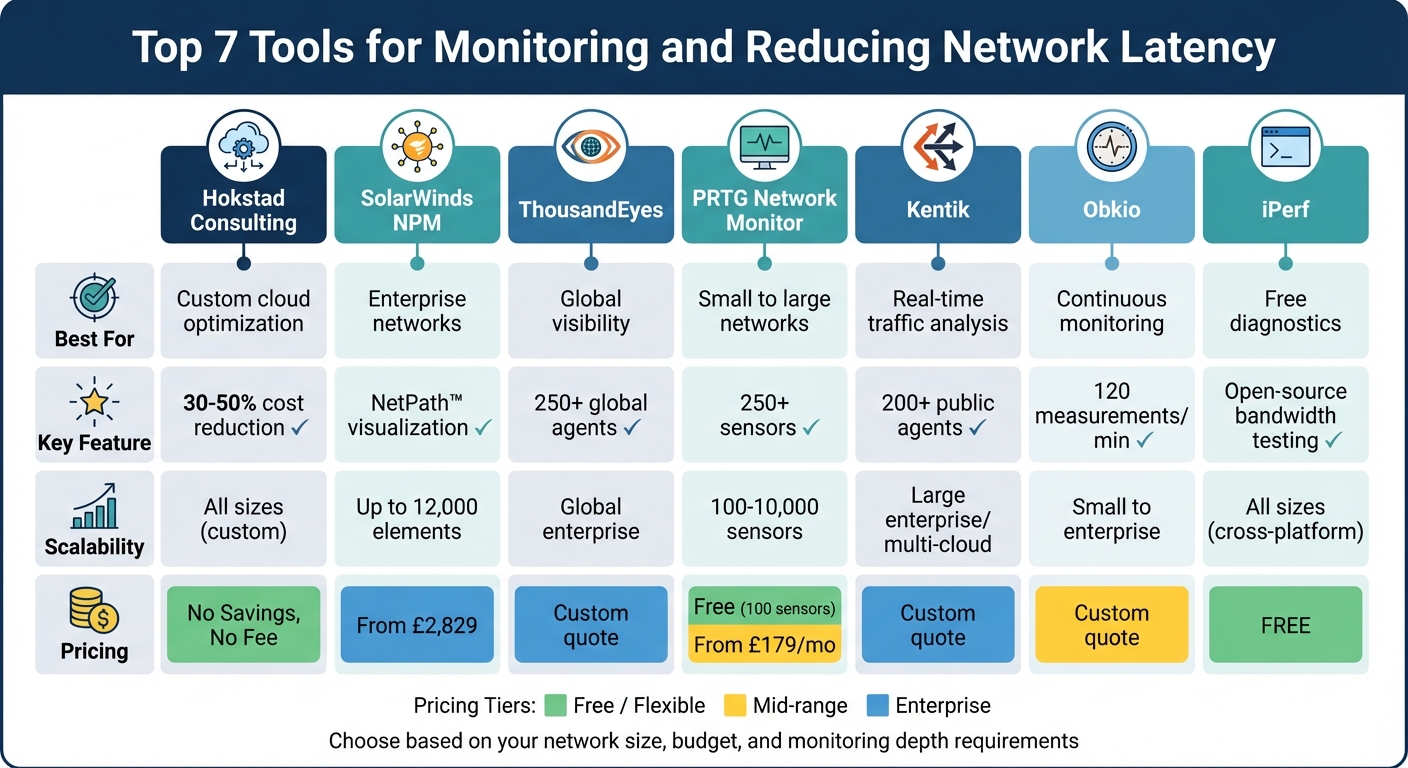 {Network Latency Monitoring Tools Comparison: Features, Scalability and Pricing}
:::
{Network Latency Monitoring Tools Comparison: Features, Scalability and Pricing}
:::
1. Hokstad Consulting
Latency Monitoring Capabilities
Hokstad Consulting focuses on fine-tuning cloud infrastructure and DevOps processes to minimise latency. Rather than offering a standalone monitoring dashboard, they take a hands-on approach by analysing and improving your current cloud architecture across various platforms. Their team of consultants identifies latency bottlenecks within your system and implements specific measures to address them. This integrated strategy ensures that latency issues are resolved at their root.
Latency Reduction Features
Hokstad Consulting’s real strength lies in their ability to customise automation and redesign infrastructure. They employ caching strategies and streamline deployment pipelines to reduce latency effectively. By automating deployments and embedding monitoring tools, they enable organisations to detect and manage latency problems early, resulting in a more responsive and efficient system.
Scalability for Different Network Sizes
Hokstad Consulting’s services are designed to adapt to networks of any size. Whether you’re a small business running a handful of cloud instances or a large enterprise managing complex, multi-region deployments, they tailor their optimisation strategies to fit your needs. Their expertise spans diverse hosting environments, ensuring performance improvements at any scale. Additionally, their cloud cost engineering services have consistently delivered impressive results, cutting cloud expenses by 30–50% while enhancing system performance.
Pricing and Cost-Effectiveness
Hokstad Consulting operates on a No Savings, No Fee
model for cloud optimisation. This means you only pay a percentage of the actual savings achieved, with fees capped to ensure transparency. For organisations requiring ongoing support, they offer flexible options, including retainer-based agreements or hourly consulting. This makes it easier to plan for continuous monitoring and optimisation without unexpected costs.
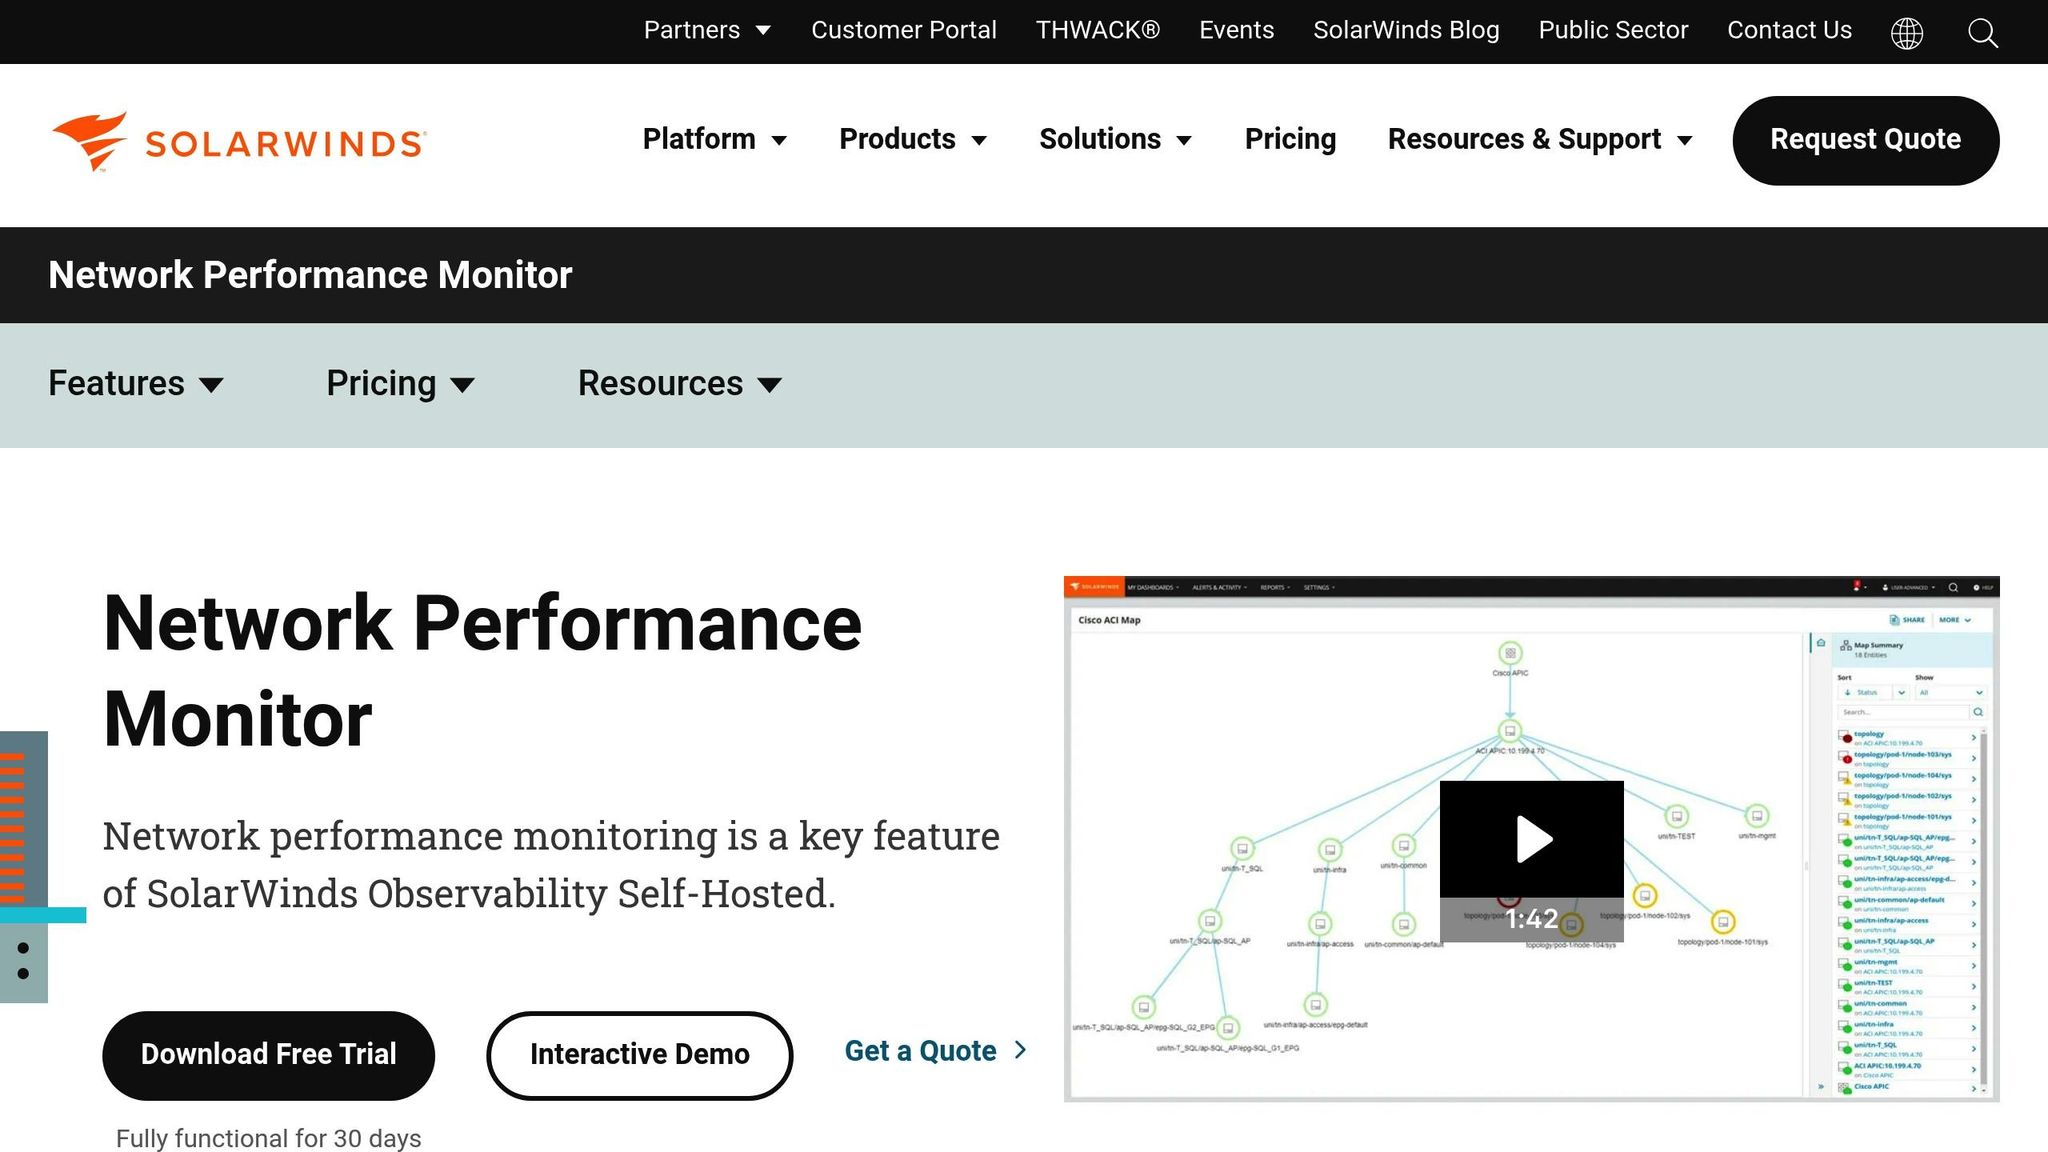
2. SolarWinds Network Performance Monitor (NPM)
Latency Monitoring Capabilities
SolarWinds NPM leverages DPI to analyse over 1,200 applications, helping to determine whether latency issues stem from the network or the application itself. Its Quality of Experience (QoE) Dashboard provides real-time insights into network response times by using the TCP three-way handshake, gathering sensor data from both physical and virtual servers. One of its standout tools is NetPath™, which offers a hop-by-hop visualisation of critical network paths across on-premises, hybrid, and cloud environments. This feature pinpoints exactly where latency or packet loss occurs, delivering a level of detail that’s crucial for effective troubleshooting.
Latency Reduction Features
The PerfStack™ Correlation tool is a powerful feature that allows administrators to align network, server, and application metrics on a single timeline. This makes it easier to identify the root cause of performance spikes. Additionally, the platform uses AI-driven anomaly detection to establish performance baselines and sends alerts only when significant deviations occur, cutting down on false alarms. Beyond software, the system keeps an eye on hardware health, monitoring factors like temperature and fan speed to catch potential hardware-related latency issues early. It also includes automated capacity forecasting, which analyses historical data to predict when resources like bandwidth or CPU might hit their limits, allowing teams to plan upgrades before problems arise.
With SolarWinds, we have seen improvements in availability and reductions in time-to-resolution. We are able to rectify problems faster, before users start complaining.- Michael Low, Systems Engineer, Marina Bay Sands [5]
Scalability for Different Network Sizes
SolarWinds NPM is designed to scale effortlessly, whether you're managing a small LAN or a sprawling enterprise network. It supports up to 12,000 elements per polling engine [6], ensuring consistent performance monitoring across networks of any size. The platform is vendor-agnostic and works seamlessly with devices from major hardware providers like Cisco, Juniper, Arista, Palo Alto, Fortinet, and Aruba. Its Discovery Wizard simplifies expansion by automatically identifying and adding devices using SNMP, WMI, or Active Directory, ensuring no device is left unmonitored as your network grows. Organisations can choose between a self-hosted deployment for behind-the-firewall control or a SaaS-based observability solution.
Pricing and Cost-Effectiveness
SolarWinds NPM starts at £2,829, and a fully functional 30-day free trial is available for those who want to explore its capabilities. For larger deployments or access to the full Observability Self-Hosted suite, custom pricing is offered. The platform’s automation features, such as automated packet latency data capture and in-depth packet inspection, significantly reduce the time spent on manual troubleshooting. At Marina Bay Sands, for example, SolarWinds enabled teams to address network issues proactively, improving availability and cutting response times.
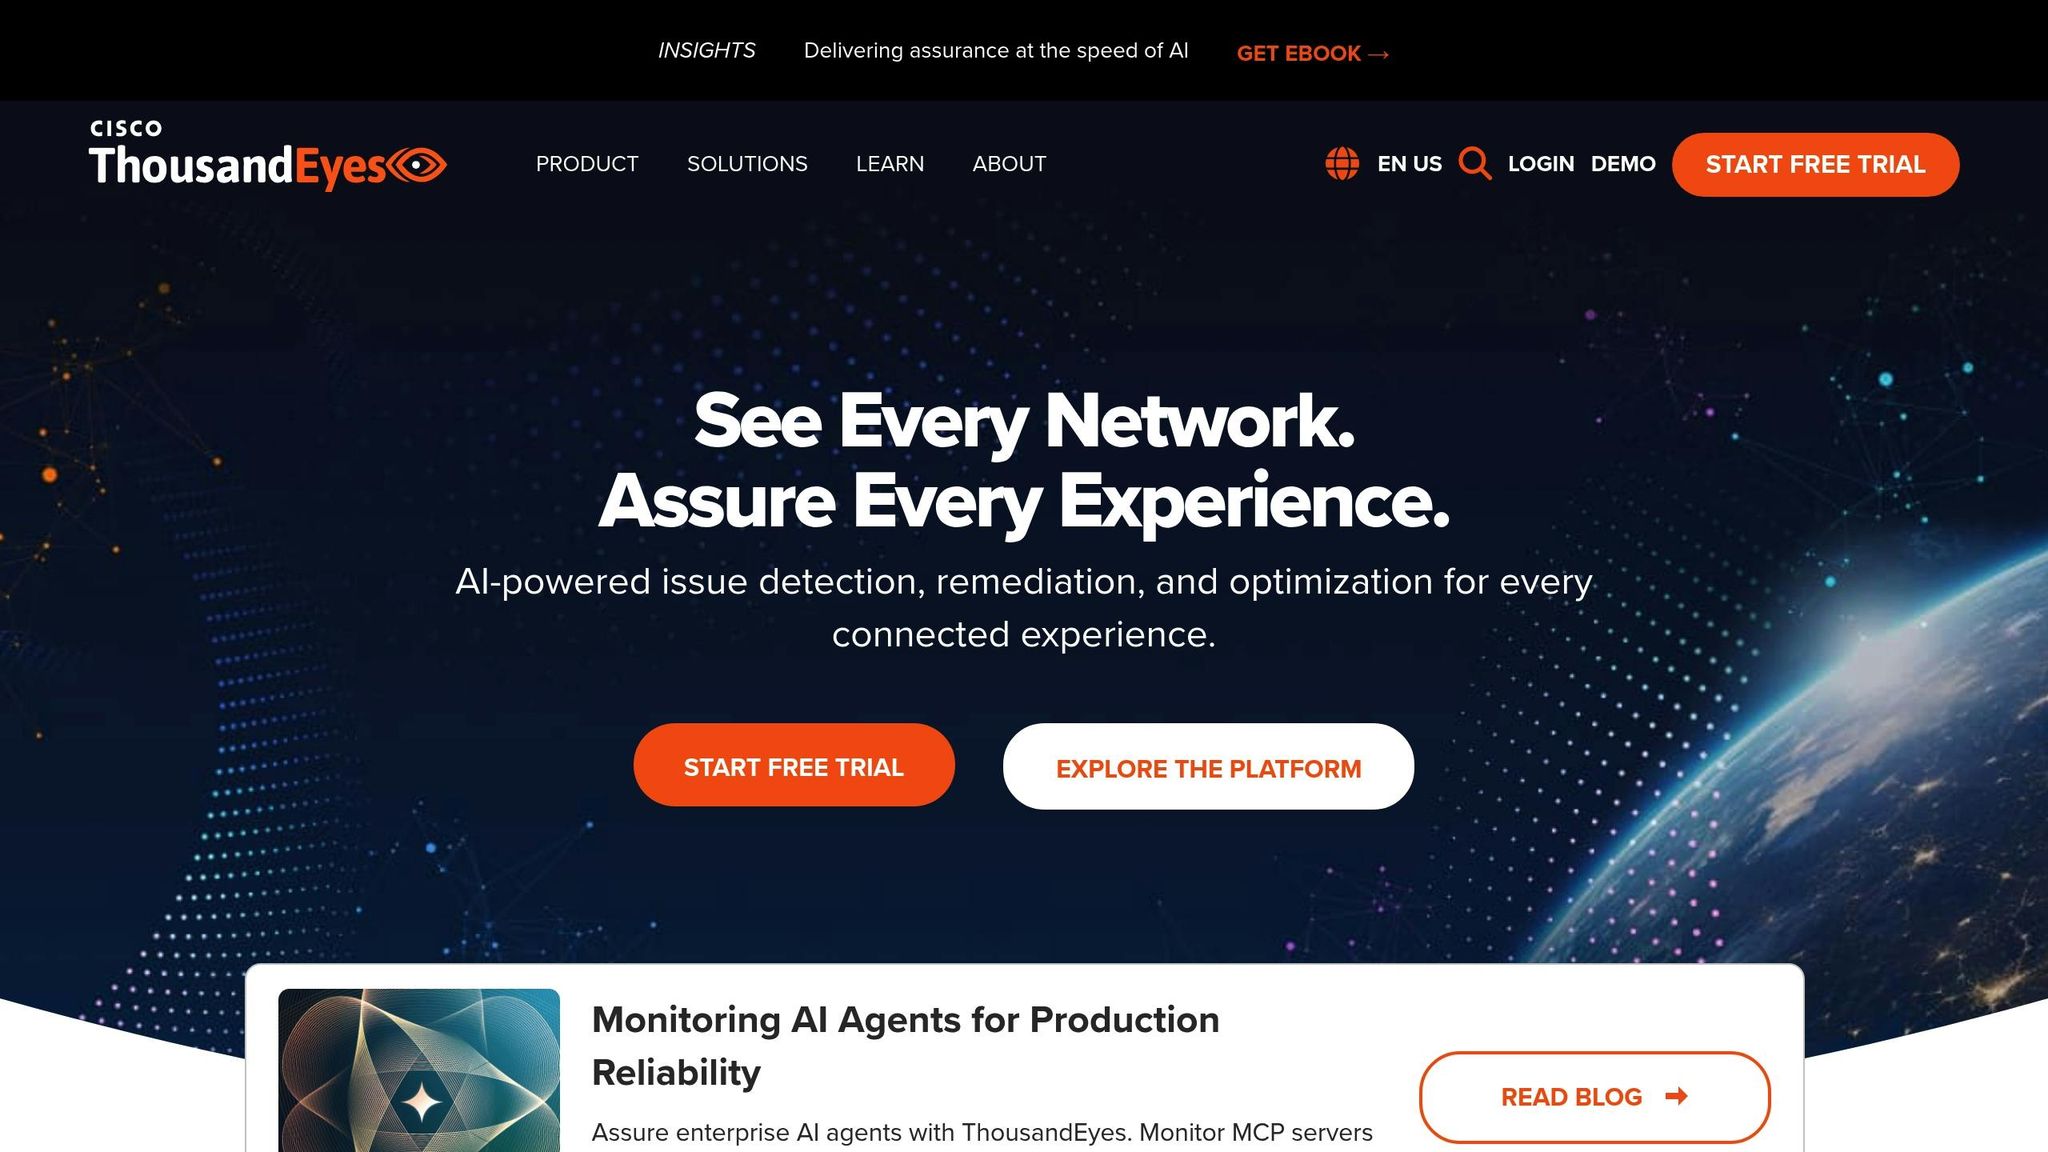
3. ThousandEyes
Latency Monitoring Capabilities
ThousandEyes offers a robust approach to latency monitoring by deploying agents across three layers: Cloud, Enterprise, and Endpoint. Using synthetic tests (TCP, ICMP, UDP), it measures packet loss, latency, and jitter across the entire delivery path, including networks outside your control, such as the public Internet. What makes it stand out is its hop-by-hop path visualisation, which maps every router along the network path, pinpointing the exact node causing delays. Additionally, its BGP routing visibility combines data from global collectors to monitor reachability and path changes. Whether the issue lies within your internal network, your ISP, or a cloud provider, ThousandEyes provides clarity.
The platform's Endpoint Experience Monitoring delivers real-time insights into Wi-Fi, gateway, and VPN performance, making it ideal for distributed workforces. With over 250 Cloud Agent locations across 64 countries [11], ThousandEyes can simulate end-user experiences globally, helping establish performance baselines and validate SLAs against actual metrics. This comprehensive setup is the foundation of its advanced latency management capabilities.
Other tools can evaluate what the latency is, but they don't give us the granularity that ThousandEyes gives us. No other tool has provided the type of visibility that ThousandEyes is providing at the moment.- Principal Engineer, Network Operations, Commercial Airline [8]
Latency Reduction Features
The platform's detailed insights empower teams to proactively address latency issues. WAN Insights uses statistical models and AI to predict network conditions, offering routing recommendations to avoid high-latency paths in SD-WAN environments. Instead of reacting to problems after they occur, teams can make routing adjustments based on predicted performance improvements. ThousandEyes' AI-powered root cause analysis further streamlines this process by correlating data across layers, filtering out irrelevant information, and providing natural language summaries of incidents to speed up resolution. For example, Cisco IT integrated ThousandEyes with Splunk, automating 99.998% of alerts across their network [9].
Another useful feature, Snapshots, allows teams to share path visualisation data with ISPs or SaaS providers, clearly identifying where latency issues occur. This facilitates faster resolutions without requiring external parties to access the platform. For SD-WAN deployments, administrators can adjust routing policies per site based on WAN Insights recommendations, preventing performance issues before they affect users.
ThousandEyes has allowed us to more effectively troubleshoot issues, share information across teams, and taken down the temperature when we get into those high-pressure troubleshooting scenarios.- Mark Rodrigue, Senior Network Engineer, Room & Board [7]
Scalability for Different Network Sizes
ThousandEyes is designed to scale effortlessly, whether for single-office setups or global networks. Smaller organisations can tap into the 271 pre-deployed Cloud Agent locations worldwide [12] to simulate user performance without managing additional infrastructure. For larger enterprises, native integration with Cisco hardware - such as Catalyst 9000, Nexus 9000, and Meraki devices - enables extensive telemetry collection without requiring extra monitoring equipment [10]. The platform's Internet Insights feature further helps businesses of all sizes distinguish between internal network issues and broader provider disruptions by monitoring global Internet outages in real time.
Pricing and Cost-Effectiveness
ThousandEyes uses a flexible, consumption-based pricing model based on test units
, making it accessible for both small businesses and large enterprises [12]. Costs vary depending on the monitoring layer:
- Network & App Synthetics: Priced by test units, calculated based on the number, type, and frequency of tests.
- Endpoint Experience: Charged per user endpoint.
- Internet Insights: Based on monitored providers and regions.
- WAN Insights: Available for Cisco SD-WAN customers with eligible Cisco DNA licensing tiers [12].
A free trial is available for organisations looking to explore the platform's capabilities. ThousandEyes holds a 4.5/5 rating on Gartner Peer Insights (110 reviews) [7] and scores 9.1/10 on TrustRadius (251 reviews) [7].
4. PRTG Network Monitor
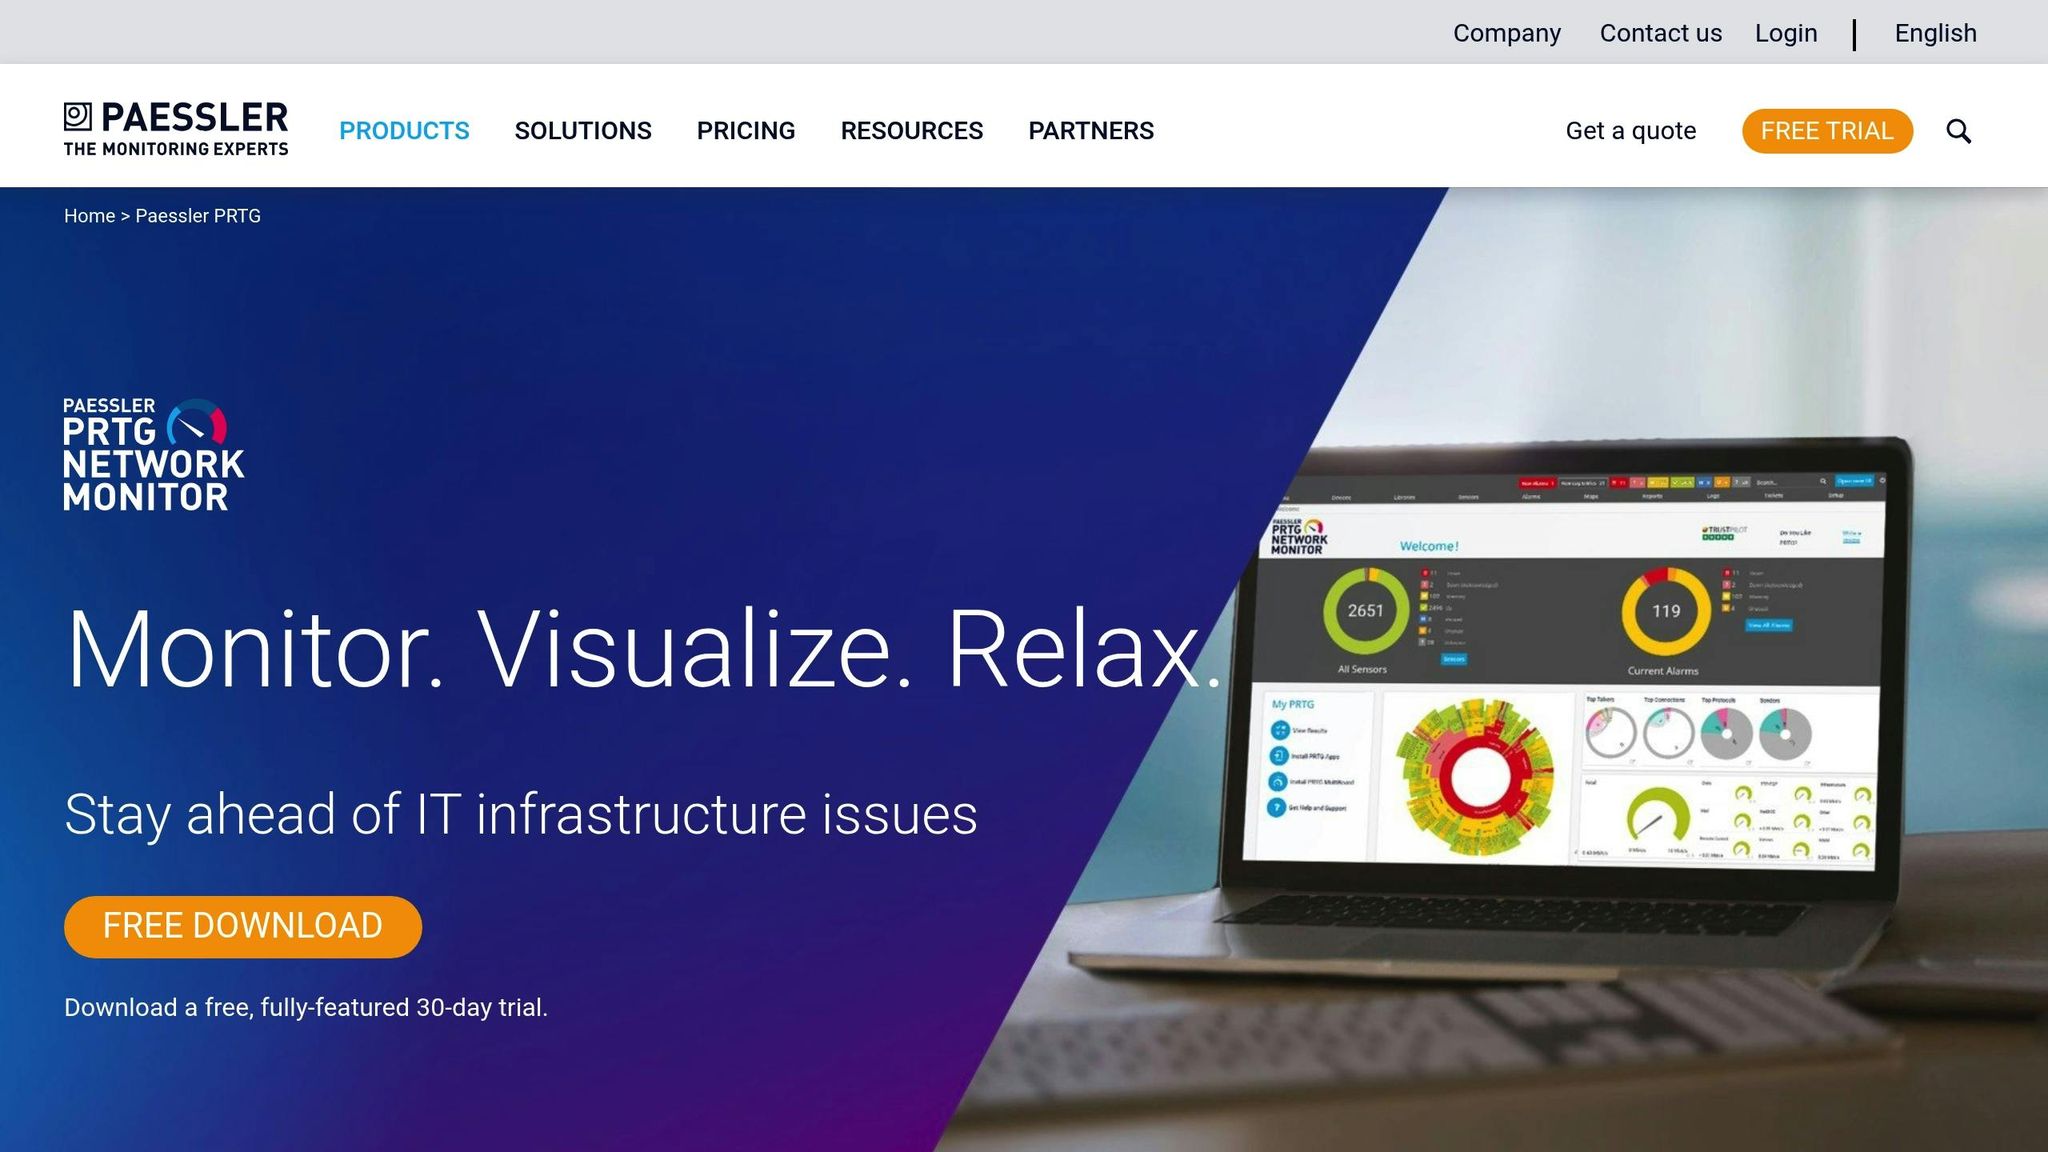
Latency Monitoring Capabilities
PRTG Network Monitor offers over 250 sensors designed to track network latency effectively. Its Ping v2 sensor provides insights into response times, minimum and maximum ping values, and packet loss. Meanwhile, the QoS Round Trip sensor keeps an eye on jitter, round-trip time (RTT), and packet delay variation - key metrics for ensuring smooth VoIP and video conferencing. For organisations relying on Cisco systems, the Cisco IP SLA sensor delivers VoIP-specific latency data, including the Mean Opinion Score (MOS).
The Cloud Ping v2 sensor adds another layer of functionality by measuring TCP ping times from various global locations, such as Singapore, Ireland, and US East/West. This feature offers a clear picture of cloud service accessibility from an end-user’s perspective. The data is displayed using live traffic graphs and dashboards, with a Map Designer tool that visualises network health. Administrators can set latency thresholds as low as 100 ms, triggering instant alerts when exceeded. A built-in traceroute tool identifies problematic routers or switches causing delays, while support for NetFlow, sFlow, and packet sniffing helps pinpoint bandwidth bottlenecks. Additionally, PRTG stores up to a year’s worth of data, enabling long-term performance analysis [1].
PRTG allows us to see the health and performance of the network. Using these measurements we can make decisions on how to repair a piece of equipment before it fails and causes a service interruption.
- James Ott Jr., IT Administrator, Federal Radio
These precise monitoring tools serve as the foundation for strategies aimed at reducing latency, which are explored in the next section.
Latency Reduction Features
PRTG's in-depth monitoring doesn't just stop at identifying latency issues - it actively supports reducing them. By tracking metrics like CPU load, RAM usage, and disk health through WMI and SNMP, IT teams can identify whether outdated or overworked hardware is slowing down the network. This enables proactive upgrades or replacements of underperforming equipment like hubs and switches. Traffic analysis tools reveal which applications are consuming the most bandwidth, allowing administrators to prioritise critical data flows. Traceroute sensors further assist by highlighting redundant routing hops that unnecessarily increase latency.
Adopting PRTG has been like going from being in the dark to being in the light. Before, we had limited visibility... now, thanks to the comprehensive dashboard and real-time notifications, our way of working has gone from passive to proactive.
- Luca Meneghesso, Senior IT Infrastructure and Security Specialist, Banca Profilo
Scalability for Different Network Sizes
PRTG adapts to networks of various sizes using a sensor-based licensing model. Each sensor monitors a specific metric, such as CPU load or port traffic, with most devices requiring 5 to 10 sensors for comprehensive monitoring. The platform offers three deployment options:
- PRTG Network Monitor: Suitable for small to medium-sized infrastructures (up to 1,000 devices).
- PRTG Enterprise Monitor: Designed for large, distributed networks with thousands of devices.
- PRTG Hosted Monitor: A cloud-based solution eliminating the need for dedicated hardware.
For organisations with multiple locations, Remote Probes enable centralised management of distributed systems, while the Auto-Discovery feature automatically detects devices within a specified IP range, simplifying network expansion. Barry Kelly, Systems Engineer at Skyscanner, highlights its reliability:
As an international company, PRTG is ideal for us. If something went down half way across the world, we wouldn't be woken up – we can rely on PRTG to identify the problem and alert us before it occurs.[1]
This flexible licensing approach ensures that PRTG can accommodate different network sizes while keeping costs manageable.
Pricing and Cost-Effectiveness
PRTG offers an all-in-one solution that includes alerting, reporting, and mapping under a single licence. The Freeware edition provides 100 sensors for life, perfect for monitoring around 10 devices. Commercial licences start at £179 per month (billed annually) for 500 sensors and scale up to £1,492 per month for 10,000 sensors.
| Licence Name | Monthly Price (Paid Annually) | Environment Size | Capacity |
|---|---|---|---|
| PRTG 500 | £179 | Small | Up to 500 sensors (~50 devices) |
| PRTG 1000 | £325 | Small & Medium | Up to 1,000 sensors (~100 devices) |
| PRTG 2500 | £675 | Medium | Up to 2,500 sensors (~250 devices) |
| PRTG 5000 | £1,183 | Large | Up to 5,000 sensors (~500 devices) |
| PRTG 10000 | £1,492 | Very Large | Up to 10,000 sensors (~1,000 devices) |
The software is lightweight enough to run on modest hardware - even a netbook can handle over 1,000 sensors - minimising infrastructure costs. With a user rating of 4.6 out of 5 based on 279 reviews and more than 95% of users recommending it, PRTG is a dependable choice for monitoring and improving network performance [1].
5. Kentik
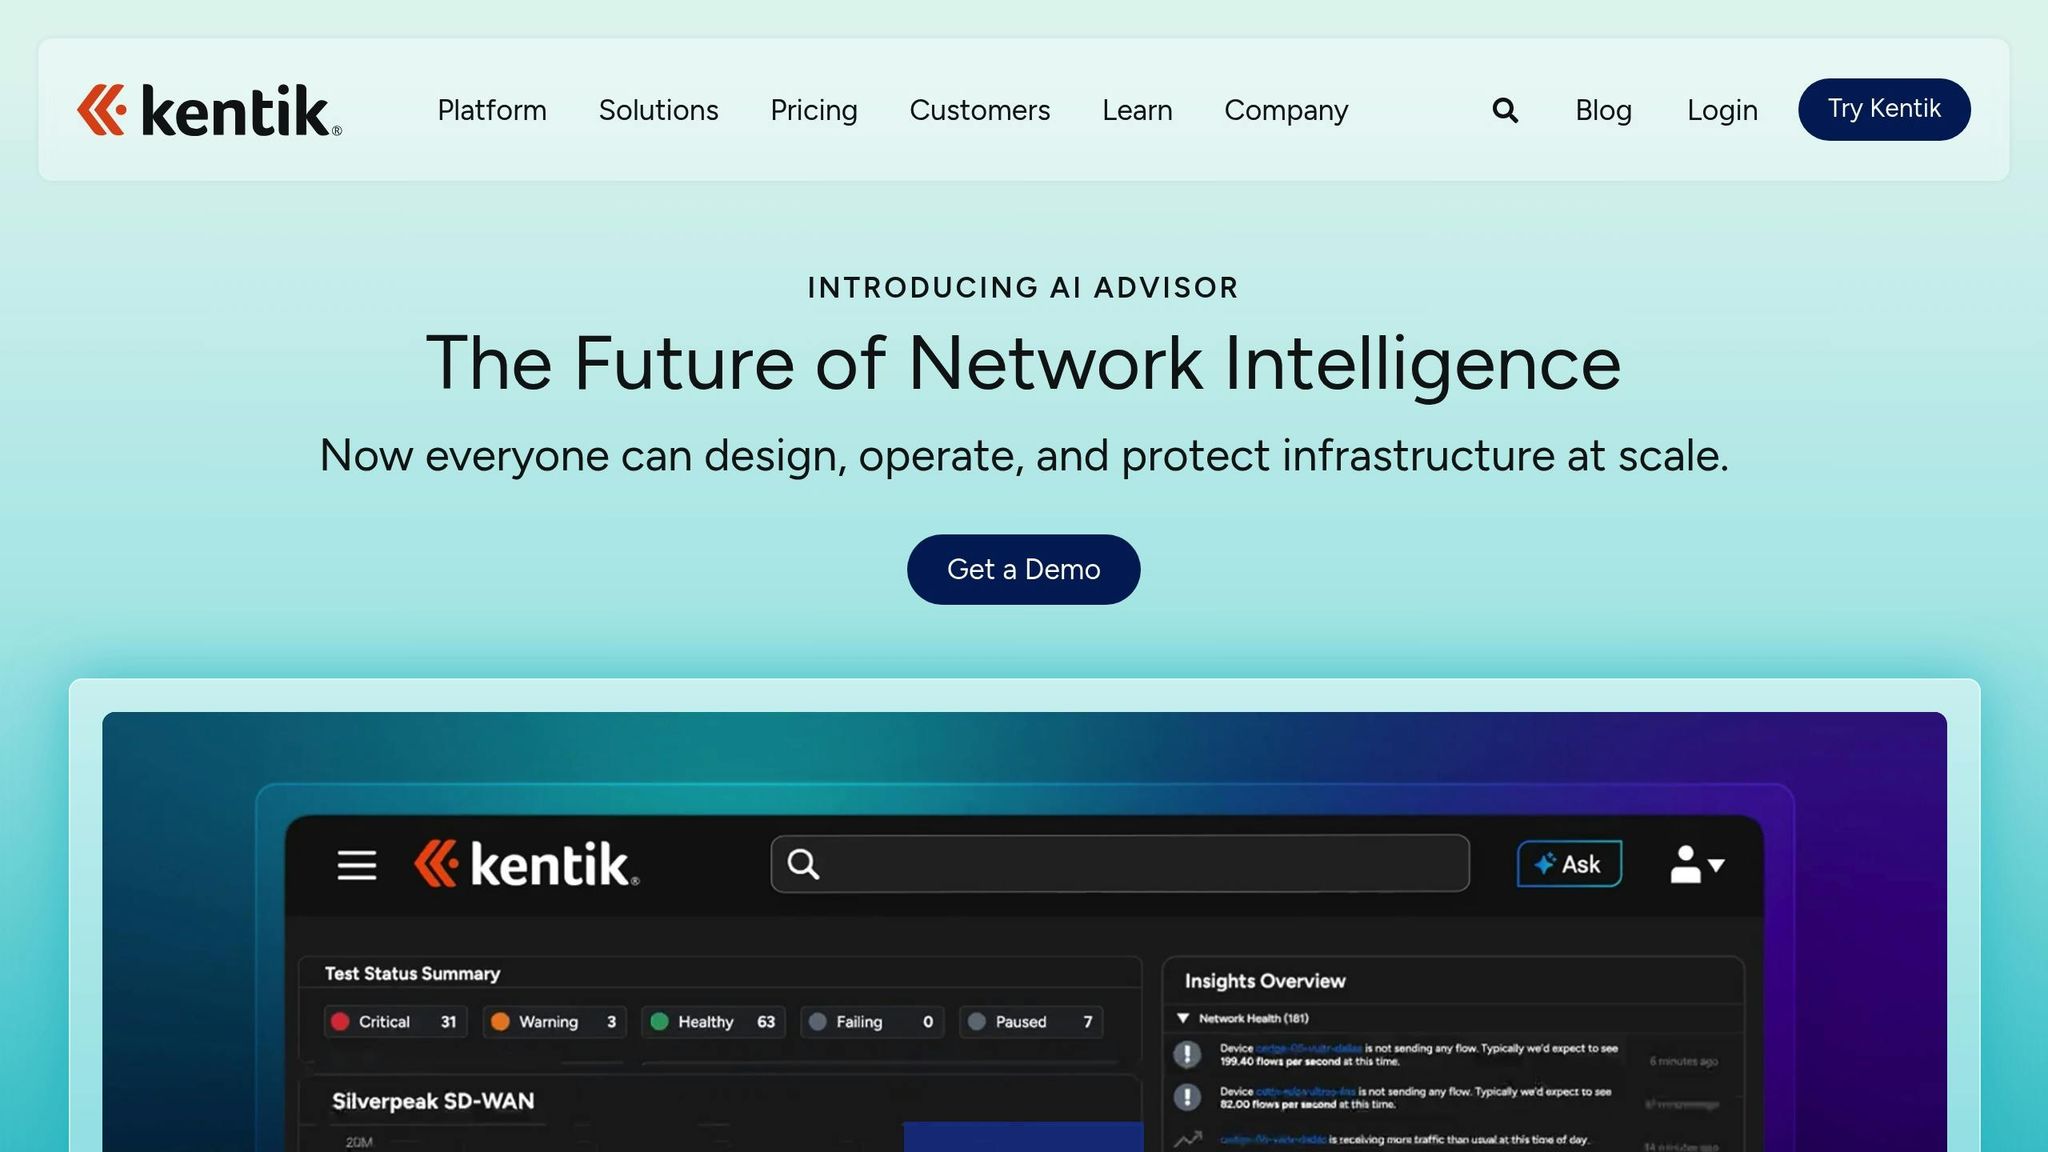
Latency Monitoring Capabilities
Kentik stands out with its global network of over 200 public agents, strategically placed in major internet hubs and key cloud regions. These agents continuously test for latency, packet loss, jitter, and network reachability across infrastructures, multi-cloud environments, and SaaS applications [38,44]. With its Performance Mesh Testing, users can run multi-site mesh tests, providing a visual representation of latency results. This feature makes it easy to spot nodes experiencing delays or packet loss at a glance [15].
Unlike traditional SNMP polling, which updates data every minute, Kentik leverages streaming telemetry to deliver updates every 1–2 seconds. This ultra-fast data collection captures microbursts and tail latency that might otherwise go unnoticed [18]. For routing insights, the platform’s BGP Path Analysis provides real-time monitoring of routing events and AS paths, helping users identify how routing changes contribute to latency increases [15]. Additionally, Kentik offers a free, interactive Cloud Latency Map powered by live data, which allows users to explore latency trends across major public cloud regions and cities in real time [17].
Kentik has given us the insight and visibility that we have not been able to achieve through other network performance monitoring products or open source tools. We can see things we simply couldn't see before.- Sam Eaton, Director of Engineering Operations, Yelp [14]
Latency Reduction Features
Kentik’s peering and traffic cost analysis helps users identify paths with fewer hops, cutting down on latency while boosting network efficiency [13]. The platform optimises routing across providers, peering networks, and CDNs to ensure smooth performance [17]. Its AI-Driven Insights, powered by the Kentik AI Advisor, deliver natural language summaries and guided troubleshooting, enabling teams to pinpoint root causes - like traffic shifts or provider issues - up to 400% faster than traditional approaches [36,39].
For example, by using Kentik’s real-time querying and automated alerting, Limelight managed to slash its mean time to resolve (MTTR) for network incidents from 1.5 hours to just 20 minutes [16]. The Path View feature pinpoints specific ASNs or nodes along traffic routes that are experiencing high latency or packet loss. On top of that, Kentik’s capacity planning tools help predict and prevent bandwidth shortages on backbone links [44,45].
Kentik has cut in half the time it takes for us to analyse and resolve an issue.- Thomas Guggenbuhl, Infrastructure Engineer, Pexip [20]
Scalability for Different Network Sizes
Kentik’s architecture is designed to handle large volumes of telemetry data, even during peak times. This makes it ideal for hybrid, multi-vendor, and distributed environments [13]. Impressively, 60% of the largest enterprise AI companies rely on Kentik for infrastructure observability, showcasing its ability to scale for complex networks [13]. The platform provides a unified view across on-premises, cloud, edge, and SaaS environments, simplifying network management [37,43].
For synthetic monitoring, Kentik offers a flexible credit-based system. Organisations can adjust testing frequency and volume to suit their needs. Kentik Pro includes 2.5 million synthetic monitoring credits per month, while Kentik Premier offers 5 million credits. If additional credits are needed, SyntheticPaks can be purchased, and the platform’s management console helps track credit usage to prevent depletion [19].
We use Kentik to continually improve our network at ServiceNow.- Davin Camara, VP, Cloud Network Services, ServiceNow [13]
Pricing and Cost-Effectiveness
Kentik’s Pro and Premier plans are designed to cater to a variety of organisational needs [19]. By consolidating legacy tools and offering unparalleled visibility, the platform helps businesses significantly reduce operational costs, including cutting cloud expenses by hundreds of thousands of pounds [36,41]. Even with massive datasets, Kentik maintains an average query response time of under one second, ensuring engineers can work efficiently [16].
The platform also features a Quick Cost Wins
report, which identifies immediate opportunities to reduce cloud transit and connectivity expenses. With automated troubleshooting and root cause analysis powered by the AI Advisor, Kentik reduces the manual effort involved in network management, making it a cost-effective solution for organisations [38,41,36].
Need help optimizing your cloud costs?
Get expert advice on how to reduce your cloud expenses without sacrificing performance.
6. Obkio
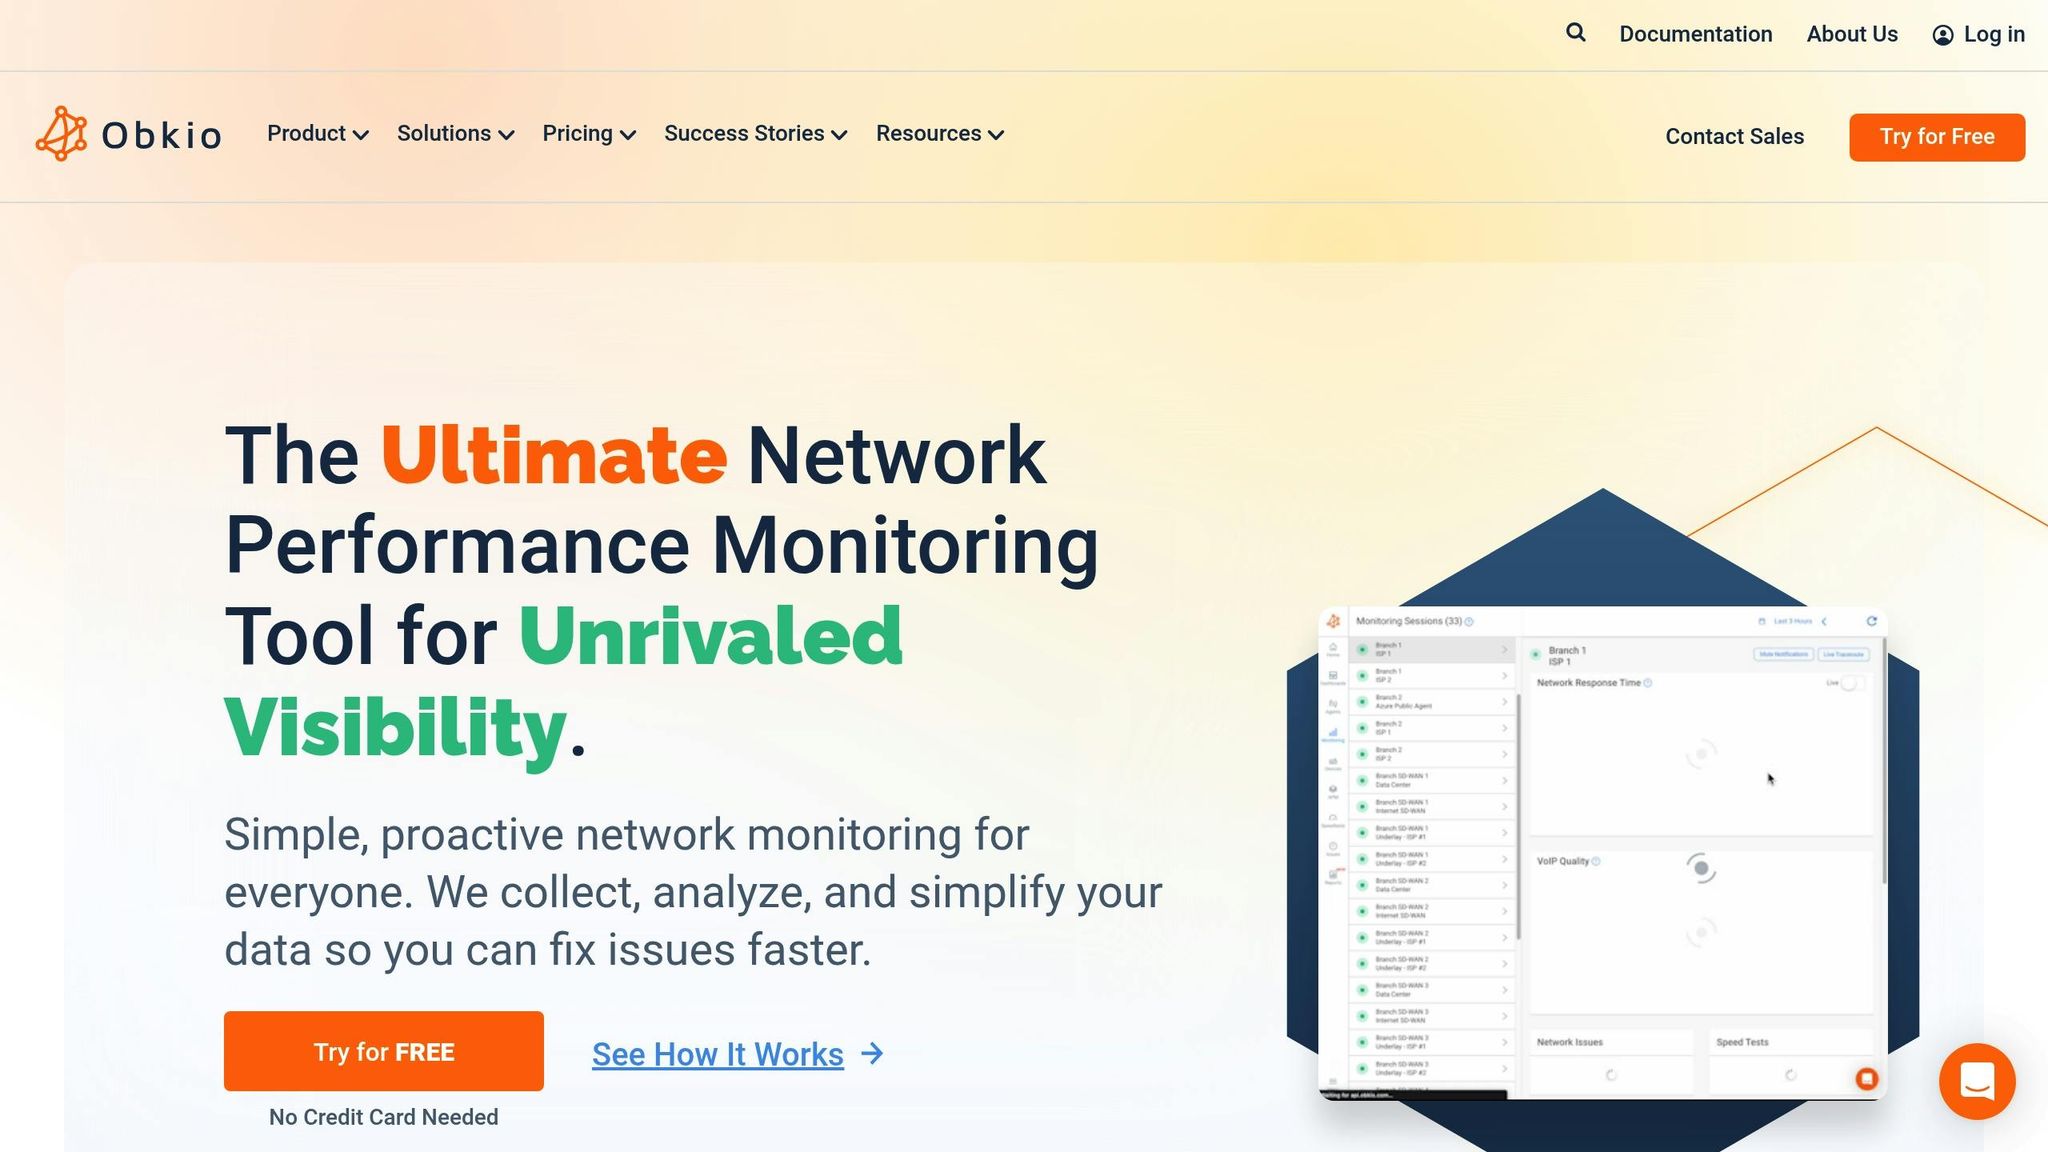
Latency Monitoring Capabilities
Obkio takes a unique approach to monitoring network performance by sending packets every 500ms, resulting in 120 measurements per minute. This is far more detailed than traditional tools that often only indicate whether a component is functioning or not. Instead, Obkio focuses on critical metrics such as round-trip latency, jitter, and packet loss, all while ensuring sensitive data remains secure [21][23].
One standout feature is Obkio Vision, a visual traceroute tool that maps out the exact network path. This helps pinpoint where latency issues arise - whether it's within the local network, through the ISP, or in a cloud environment [23][27]. To detect anomalies, Obkio calculates a dynamic performance baseline by analysing the median performance over the last 48 hours, updated hourly. It also polls SNMP data from firewalls, routers, and switches every 30 seconds - ten times faster than the more common five-minute intervals used by other tools [21][24].
The missing link in network monitoring! Standard network monitoring can only tell you if a component is ON or OFF. Obkio monitors the health of your network connections and, most importantly, packet loss.- Jesse, IT Director [21]
These in-depth measurements enable teams to tackle latency issues proactively before they escalate.
Latency Reduction Features
With distributed agents, Obkio quickly isolates latency problems across local, ISP, and cloud networks [26]. Tools like the Chord Diagram and Live Mode provide real-time updates, making it easy for teams to evaluate the effects of network changes minute by minute [21][23].
Paul Bisson, a System Administrator, shared his experience:
Obkio gives us the network visibility that no other solution gives us! We were able to identify and resolve network issues quickly using Obkio.[21]
Obkio’s proactive alert system uses intelligent notifications based on historical performance data. This approach reduces false alarms while catching subtle performance dips before they affect end-users [23][28]. For organisations relying on VoIP, the platform tracks the Mean Opinion Score (MOS), a key metric for call quality. Given that acceptable VoIP latency ranges from 20 to 50 milliseconds, delays over 200 milliseconds can lead to choppy conversations, making this feature invaluable [23][24].
Scalability for Different Network Sizes
Obkio is designed to accommodate networks of all sizes, from individual users to large enterprises. Its single-agent-per-location setup, combined with Mass Deployment Profiles, ensures quick and comprehensive performance visibility [23][21]. For branch offices without local servers, plug-and-play appliances make deployment seamless [24].
The platform also supports multi-tenant configurations, making it ideal for Managed Service Providers (MSPs) who need to monitor multiple networks. MSPs can choose between a unified database or separate dashboards for their clients [24]. With an average rating of 4.96 out of 5 from 169 reviews, users praise its ability to diagnose intermittent issues and provide visibility across SD-WAN, MPLS, LAN, WAN, and hybrid cloud environments [21][26].
Pricing and Cost-Effectiveness
Obkio’s flexible pricing plans make it a practical option for businesses looking to optimise their networks without breaking the bank. New users can take advantage of a 14-day free trial, which includes access to premium features and doesn’t require a credit card. This allows businesses to establish a network performance baseline before committing [21][23].
As a cloud-based SaaS solution, Obkio eliminates the need for extensive on-premise infrastructure, making it a scalable option for growing organisations [24]. The onboarding wizard ensures deployment is quick and straightforward - delivering actionable insights in under 10 minutes [21][23]. Depending on the subscription plan, historical data can be stored for up to 36 months, and the Obkio Vision traceroute tool is included in all plans at no additional cost [22][25].
7. iPerf
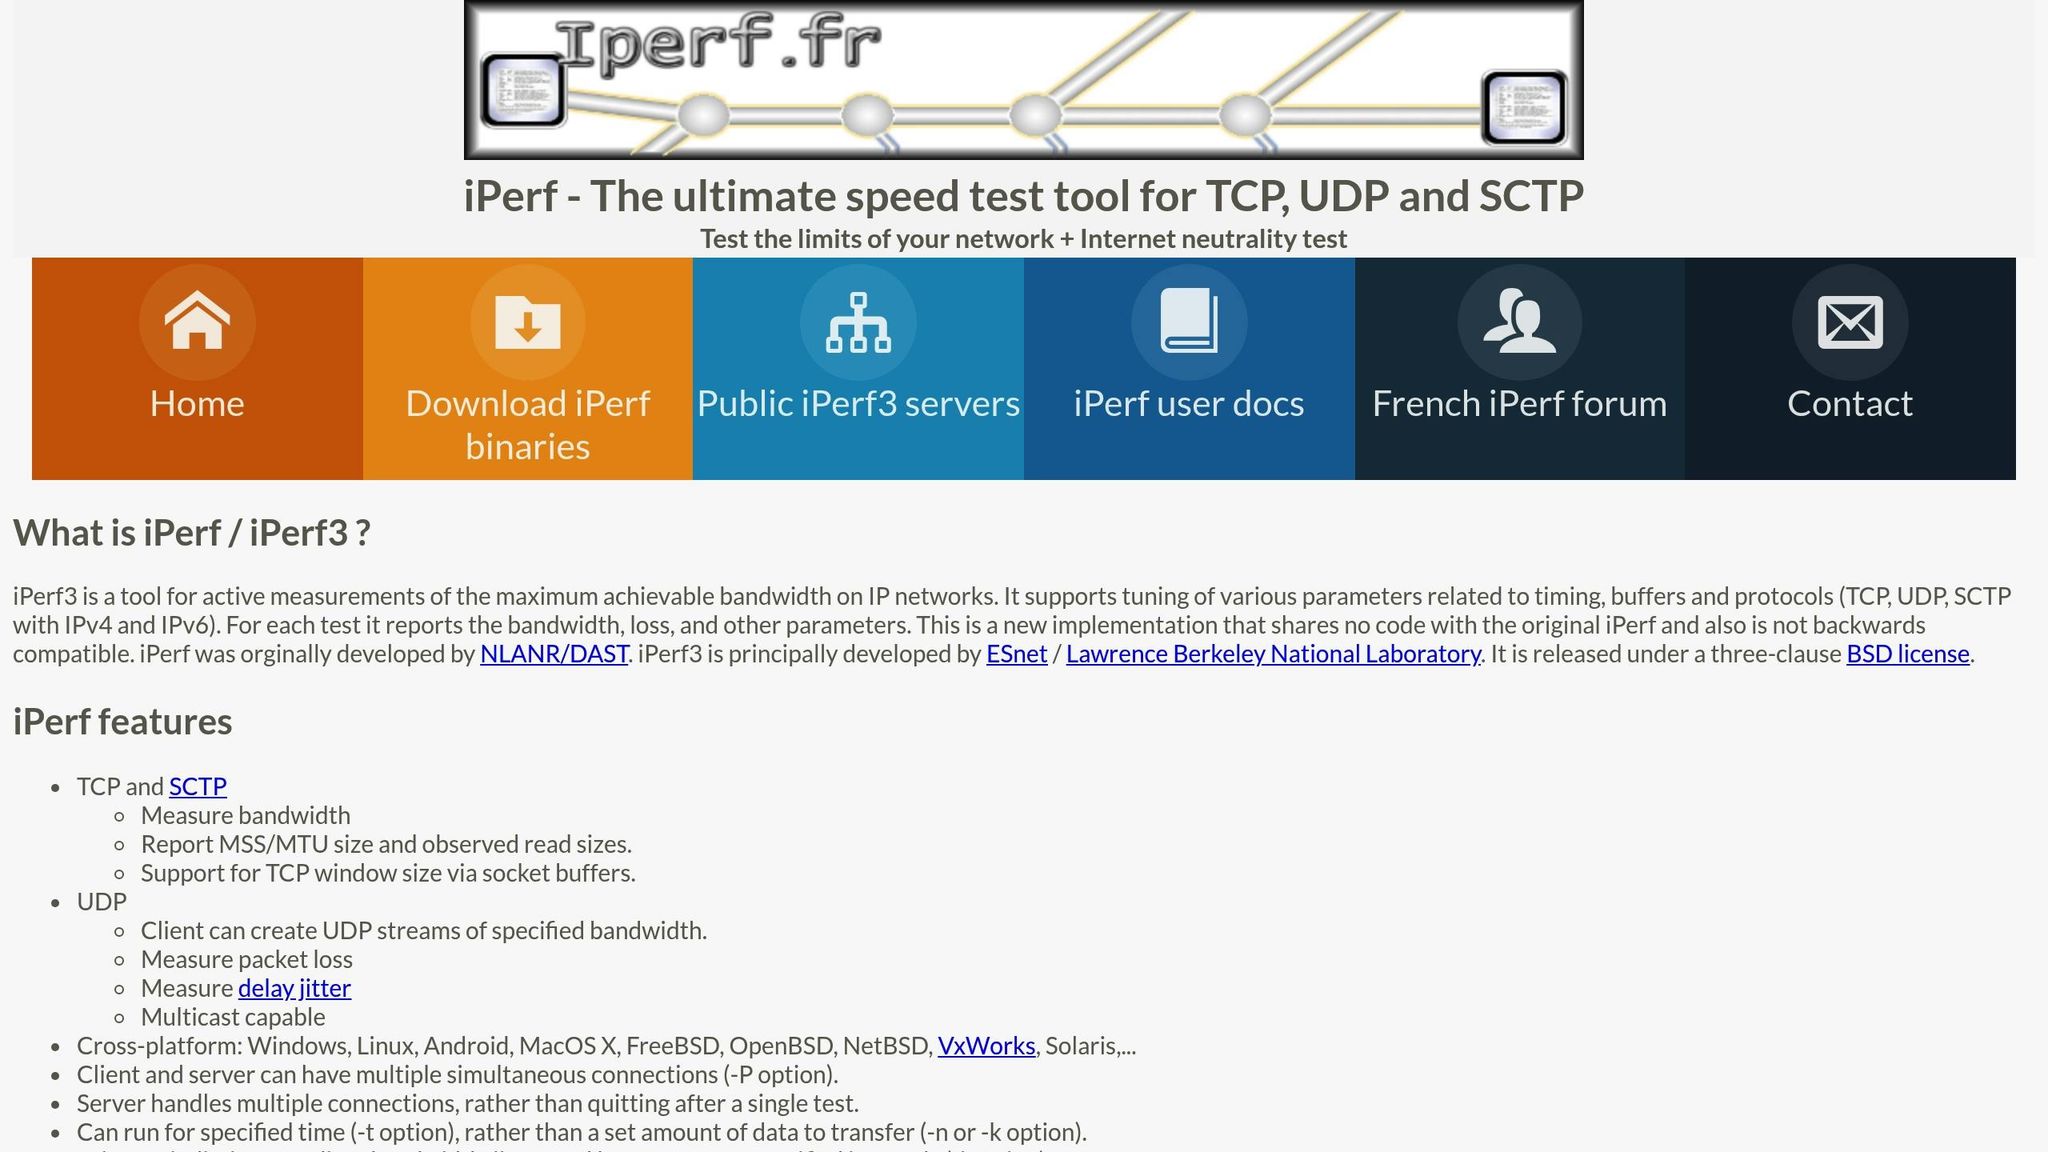
Latency Monitoring Capabilities
iPerf stands out among network monitoring tools for its ability to provide detailed performance data, particularly in guiding configuration adjustments to boost throughput, which can indirectly improve latency. This free, open-source tool measures maximum bandwidth across IP networks (TCP, UDP, SCTP) by conducting paired sender/receiver tests to evaluate performance from both ends. For UDP tests, it also tracks delay, jitter, and packet loss, offering a comprehensive view of network performance [29][30].
For those using iPerf2 (v2.0.7 and later), it includes end-to-end latency measurements with microsecond-level precision, provided both the client and server clocks are synchronised [30]. Thierry Notermans from Netskope highlights:
iPerf, now in its third version (iPerf3), is complementary to OWAMP and TWAMP. However, iPerf doesn't test latency, as it is primarily designed to test throughput and packet transmission[3].
These detailed metrics serve as a foundation for optimising network configurations.
Latency Reduction Features
While iPerf doesn’t directly reduce latency, it excels at identifying optimal network configurations through its various tuning options. For example, the -C flag allows users to test different congestion control algorithms, while adjusting TCP window sizes helps determine the ideal bandwidth-delay product. The -A flag assigns processes to specific CPU cores during high-bandwidth tests, enhancing performance efficiency. Additionally, the -O flag skips the TCP slow-start phase to provide steady-state performance insights, and the -J option outputs results in JSON format, making it easy to integrate with monitoring scripts [29][30][31][32].
Scalability for Different Network Sizes
iPerf’s versatility makes it suitable for networks of all sizes, thanks to its compatibility with multiple platforms, including Windows, Linux, Android, MacOS, FreeBSD, OpenBSD, NetBSD, VxWorks, and Solaris. The -D option lets users deploy it as a daemon, while the -P option enables parallel streams to simulate multiple simultaneous connections. With iPerf3 (v3.16 and later), the introduction of multi-threading addresses earlier CPU-bound limitations during multi-stream tests, further enhancing its scalability [29][31][32].
Pricing and Cost-Effectiveness
iPerf is entirely free, distributed under a three-clause BSD licence. Its default test duration is 10 seconds, with report intervals as short as 5 milliseconds, delivering highly detailed performance data without any cost [29][30][32].
5 Best Network Monitoring Tools 2025 (Full Software Review) 🗄️🖧
Comparison Table
Here's a breakdown of the tools to help you decide which one suits your network performance needs best.
| Tool | Latency Monitoring | Reduction Features | Scalability | Pricing (GBP) |
|---|---|---|---|---|
| Hokstad Consulting | Custom DevOps monitoring with automated CI/CD pipelines and infrastructure oversight | Cloud cost optimisation (30–50% reduction), advanced caching, zero-downtime migration | Tailored for small to enterprise networks with hybrid and multi-cloud support | Custom pricing; No Savings, No Feemodel available |
| SolarWinds NPM | Real-time anomaly-based alerting with NetPath visualisation and continuous monitoring | Automated network mapping, intelligent alerting, performance baselining | Large-scale, complex multi-site environments | Subscription-based; custom quote required |
| ThousandEyes | Synthetic monitoring with BGP visibility across internal and external dependencies | End-to-end path analysis, cloud and ISP performance insights | Enterprise-grade with global vantage points | Subscription-based; custom quote required |
| PRTG Network Monitor | 24/7 monitoring with 250+ preconfigured sensors (Ping, QoS, Cisco IP SLA) | Bandwidth Manager for allocation control, Network Traffic Controller for prioritisation | Small to large networks; free tier up to 100 sensors | Free (up to 100 sensors); paid from £1,335 for 500 sensors [33] |
| Kentik | Real-time network traffic analysis with flow data and BGP monitoring | - | Medium to large enterprises with distributed networks | Subscription-based; custom quote required |
| Obkio | Continuous synthetic monitoring with live traffic graphs and VoIP performance tracking | Proactive alerts, historical trend analysis, multi-location testing | Medium to large networks focusing on LAN, Internet, and VoIP | SaaS subscription; custom quote required [33] |
| iPerf | Latency measurements with UDP jitter and packet loss tracking | - | All network sizes; cross-platform support | Free (BSD licence) [29] |
This table highlights the key features and pricing models of each tool, making it easier to find the right fit for your network's monitoring and optimisation needs. Whether you're looking for Hokstad Consulting's tailored DevOps solutions, the enterprise-level tools from SolarWinds NPM and ThousandEyes, or budget-friendly options like PRTG and iPerf, there's something here for every requirement.
PRTG has helped us significantly improve service uptime by highlighting important alerts that would otherwise result in a system failure... we can ensure that The Ritz London's network and IT systems are five-star– Richard Isted, IT Manager, The Ritz London [1]
Conclusion
Latency monitoring isn't just about identifying issues; it's about preventing disruptions before they happen. The tools discussed in this guide offer a range of capabilities to suit different needs, from Hokstad Consulting's tailored DevOps solutions and cost-saving strategies to robust enterprise platforms like SolarWinds NPM and ThousandEyes, as well as budget-friendly options like PRTG and iPerf. The right choice depends on your network's size, budget, and whether you need simple diagnostics or comprehensive multi-cloud visibility.
Choosing monitoring is about outcomes: fewer surprises, faster fixes, and happier users.– Simon Abrahams, Product Marketing Director, SolarWinds [4]
To adopt a proactive approach to latency management, consider running proofs of concept during real incidents. Measure factors like mean time to repair and team workload to ensure the tool you choose genuinely reduces effort and improves efficiency. For quick wins, tweak MTU settings to avoid packet fragmentation and enable Quality of Service (QoS) to prioritise critical tasks like VoIP and video conferencing over less urgent data [2].
Whether you're managing a small office network or a sprawling enterprise, consistent monitoring transforms IT operations from reactive problem-solving to proactive management. This shift not only improves user experience but also helps protect your organisation's bottom line.
FAQs
What should I look for in a network latency monitoring tool?
When selecting a network latency monitoring tool, it's important to find one that fits your organisation's specific needs and infrastructure. The ideal tool should offer clear insights into latency across your network, whether it’s on-premises or cloud-based, and present the data in a way that your team can easily understand and act upon.
Here are some key factors to keep in mind:
- Ease of use and deployment: Choose a tool that is simple to set up and manage, especially if your team has limited time or technical expertise.
- Real-time alerts and automation: Instant notifications and automated issue resolution can significantly reduce downtime and improve overall efficiency.
- Scalability and flexibility: Ensure the tool can handle your current environment - whether it’s hybrid cloud or Kubernetes - and grow alongside your network’s needs.
- Transparent pricing: Opt for a pricing model that aligns with your budget, such as usage-based options in pounds sterling, to prevent any surprise costs.
By focusing on these aspects, you can find a solution that not only reduces latency but also boosts your network's performance and supports your UK-based operations seamlessly.
How do these tools help reduce latency for VoIP and video conferencing?
These tools play a crucial role in keeping VoIP calls and video conferencing smooth and disruption-free by tackling key network performance challenges. Regularly measuring metrics like ping, jitter, and packet loss helps identify issues such as echo, choppy audio, or frozen video before they disrupt the user experience. For instance, keeping latency below 150 ms - a standard benchmark for real-time communication - is essential.
Sophisticated monitoring solutions go a step further by continuously tracking round-trip times, bandwidth usage, and Quality of Service (QoS). They can instantly detect and alert you to spikes or bottlenecks, ensuring you’re aware of problems as they arise. Features like synthetic testing and visual trace routes enable you to pinpoint areas of congestion or packet loss with precision. By incorporating these tools into your workflow, you can fine-tune routing, enforce QoS policies, and stabilise jitter, all of which contribute to a more consistent and reliable network performance.
Hokstad Consulting offers expert support in deploying and customising these tools for UK-based infrastructures, aligning them with your organisation’s unique network needs and performance objectives.
What are the cost differences between free and enterprise-grade network monitoring tools?
Enterprise-grade network monitoring tools typically come with a licence or subscription fee that often scales based on the number of devices, sensors, or servers being monitored. For instance, pricing might start at around £1,335 for up to 500 sensors and one server, with extra costs for additional nodes, premium support, or specific deployment options. These tools usually offer a straightforward pricing structure, though the initial investment can be considerable.
On the other hand, free tools don’t have licence fees but often come with limitations. For example, they might only support fewer than 100 sensors. While they can cut down on upfront costs, they often demand more time and effort for installation, configuration, and maintenance. Plus, in-house expertise is generally required to manage them effectively. Free tools may also lack advanced features or guaranteed support, which could lead to hidden costs, such as downtime or operational inefficiencies. In summary, enterprise tools are better suited for organisations needing scalability and reliability, while free options work well for smaller setups with straightforward requirements.