
I’d start with one agent and add workers only when tests show that better answers justify the extra cost and wait. Measure £ per successful answer and P50/P95 time to a checked, usable answer - not just token spend or the first streamed word.
I compare six setups:
- Single agent: the baseline for quality, cost and response time.
- Supervisor + one worker: tests whether one hand-off earns its cost.
- Sequential workers: suits steps that depend on earlier results.
- Parallel workers: overlaps independent work, but can hit shared service limits.
- Parallel workers + synthesis: adds a final call to reconcile findings.
- Task-based delegation + retries: selects workers as needed and retries failed branches within set limits.
Quick comparison
| Setup | Main cost to check | Main delay to check |
|---|---|---|
| Single agent | All calls, tools and review | Full task duration |
| Supervisor + one worker | Planning and hand-off | Serial calls |
| Sequential workers | Repeated context across stages | Every dependent stage |
| Parallel workers | All branches, including duplicate work | Slowest required branch |
| Parallel + synthesis | Branches plus synthesis | Slowest branch, then synthesis |
| Task-based delegation + retries | Routing, retries and replanning | Failed attempts and recovery |
My rule: keep the workload and quality checks fixed, count failed attempts, and include tools, hosting and human review. If 10% of attempts fail, cost per success is about cost per attempt divided by 0.90. That is why I judge accepted answers, not agent activity.
Ep 24 | Multi-Agent Systems: Supervisor/Worker, Handoffs, and When They're Not Worth It
1. Single-agent baseline
Run a fixed task set with one agent. Use the same model, prompt, tools, data, safeguards and workload planned for the supervisor tests. Record results for each task and across the full set to establish a baseline for quality, cost and latency. Measure these, along with failure modes, in the same task trace.
Quality
Score the outcome, not the wording. Assess task success, factual accuracy, completeness and step completion separately. Check actions against recorded tool results and facts against verified answers.
Use a fixed, reviewed test set that covers routine, ambiguous and tool-dependent requests. Keep a separate development set for tuning. Repeat trials when results vary, and use blinded human review when automated checks aren't enough.
Cost
One agent can still make several model calls. Record every call, token count, cached-token use and tool charge in a single task trace. Include infrastructure, retries and human review costs.
Cost per attempt = total spend / total attempts.
Cost per successful task = total spend / successful outcomes.
State whether costs include VAT and fixed platform charges. Keep the price card and the date of the exchange rate used. Cost shows what you spend; latency shows how long users wait.
Latency
Measure time to first token (TTFT) from submission to the first streamed token. Also measure end-to-end completion time and usable-answer time, including required validation. Report P50 and P95 for each measure.
Separate time spent queueing, generating model responses, retrieving data, using tools, validating results and waiting for retries. That way, a slow database won't be mistaken for slow reasoning. Fast responses still fall short if the results are unusable or unstable.
Risk
Record first-pass success and eventual success separately. Group failures by type: unsupported facts, wrong tool arguments, timeouts, rate limits and validation rejections. Keep abandoned tasks in the records.
For every retry, log the trigger, delay, outcome and extra cost under the original task trace. Use retry and abandonment records to compare supervisor-led designs. Set limits for calls, tokens and elapsed time, and apply the same recording scheme to every supervisor-led configuration.
2. One supervisor and one worker
Compare one baseline call with two delegated calls, or three if the supervisor adds synthesis. If the baseline already takes several calls, use its measured count instead. For the delegated setup, identify the supervisor’s planning or routing call, the worker’s task call and any separate supervisor call for the final response. This tests whether one hand-off improves the output enough to justify the extra cost and delay.
Log input and output tokens, tool calls, retries, queue time and wall-clock time for each call. Multi-agent systems can use far more tokens because each agent receives its own context and coordination messages. One engineering account reports typical usage of 3–10 times that of a single-agent approach for equivalent tasks.[3] As the smallest delegated pattern, this setup isolates the cost of one hand-off and one extra context boundary.
Quality
Delegate a distinct role, such as source retrieval, code execution or independent verification - not another pass at the same reasoning. Compare task success, factual accuracy, completeness, instruction following and correct tool use across the same task set. A worker adds value only if it changes the work, not just the number of calls.
For example, a research worker gathers evidence while the supervisor handles interpretation and presentation.
Test against a single agent given the same token budget or an extra pass. Otherwise, extra computation can look like specialisation. Log token usage, tool-call count and model choice: these can explain much of the variation in task performance.[6]
Cost
Itemise every billable component, rather than just counting agents. Include supervisor input and output tokens; worker input and output tokens; tool, search, database and code-execution charges; retry and timeout charges; and any orchestration, storage or monitoring overhead.
For a two-call design, C_delegated = C_supervisor + C_worker + C_tools + C_retries. Count synthesis as a separate supervisor call. Worker content often becomes supervisor input, so repeated context can increase input-token costs even when the worker’s output is short.[4][7]
Keep the worker only when the expected value of its measured quality gain exceeds the extra spend. Include delay-related costs where they matter to users.
Latency
The stages usually run in sequence: supervisor, hand-off, worker and optional synthesis. Estimate T_delegated = T_supervisor + T_handoff + T_worker + T_synthesis. Omit synthesis only when the worker’s answer can safely reach the user without another supervisor call.
Compare this with the baseline’s measured end-to-end time, not just model generation time. Record time to first token, completed-answer time, supervisor time, worker time, tool time, queue wait, hand-off time and synthesis time. Separate tool and queue delays within each stage so you don’t count them twice. Only the usable answer counts as the user-facing result.[5][7]
Risk
The extra boundary can lose context, route work incorrectly or cause the supervisor to misread a correct result. Check for incorrect task decomposition, context lost during hand-off, supervisor misinterpretation of worker output and other hand-off errors. Delegation can also duplicate tool use or pass unsupported claims and untrusted document instructions into the supervisor’s context.
Use a structured hand-off that states the task, permitted tools, required evidence, output schema and failure status. Reject malformed or unsupported results; don’t polish them into a confident answer. Compare hand-off failures, success rate and retry rate with the baseline. A review call earns its place only if it catches enough errors to justify its cost and delay.
3. Supervisor with sequential workers
Building on the two-call pattern, this setup uses four calls: supervisor planning, Worker 1 evidence retrieval, Worker 2 analysis and Worker 3 review. Each worker waits for the previous output.[9][10] Track tool calls, retrieval charges and retries separately: each stage adds to these costs.
Quality
Sequential specialists help when later stages can question and correct earlier work. Give each stage clear acceptance criteria: complete evidence, supported conclusions and a final consistency check. Compare scores against the single-agent baseline, adding one worker at a time.
Cost
Task cost is the sum of all supervisor and worker calls, tool and retrieval charges, and retries.[2][8] Track tokens used for original instructions, repeated context, worker outputs and supervisor summaries. Each hand-off reuses earlier context, making later calls more expensive. Report cost per successful answer, not just per attempt.
If 10% of attempts fail, the effective cost per successful task is about the attempt cost divided by 0.90.
Latency
Every dependent stage sits on the critical path. Total response time therefore includes planning, worker execution, hand-offs, queueing, tool calls and retry delays.[9] Record stage-level and end-to-end P50 and P95 usable-answer time: the point when a validated answer is ready. Put independent work in the parallel design below.[11]
Risk
Treat every hand-off as a possible failure point. Longer chains give errors more chances to spread. Log root-cause failures and downstream failures separately, and test for missing fields, contradictory findings and truncated context.[12]
Validate bounded, structured outputs before passing them to the next worker. Save accepted intermediate results so the final worker can resume without rerunning the chain. Set a workflow retry budget and use idempotency keys to prevent duplicate writes when retries overlap.[13][14]
4. Supervisor with parallel workers
The supervisor divides a task into independent subtasks, runs workers in parallel and collects their outputs without model-based synthesis. Store each result as it arrives in a structured record: {worker_id, status, answer, sources, confidence, duration, token_usage, error}.[17][18] Unlike sequential workers, parallel branches do not sit on each other’s critical path.
Quality
Give each worker a narrow scope, relevant context, an explicit output schema, a deadline and clear instructions on uncertainty and evidence. Check required fields, remove malformed outputs, deduplicate identical findings and rank evidence by source quality. Mark unresolved disagreements rather than silently merging them. Conflicting outputs take time and effort to reconcile, so test each added worker against the baseline.[17][19]
Cost
Concurrency cuts latency, not token spend. Count supervisor planning, every worker call, tool usage, result collection, timeouts and repeated calls. Flag duplicated URLs, document IDs and claims. Deliberate overlap can help with verification, but treat it as a reliability cost - not extra coverage. Report both cost per attempt and cost per successful task.[15][16][19]
Latency
For independent branches, response time is planning + the slowest required worker + collection. Include queue, tool and retry delays in each branch’s time. Set deadlines and decide beforehand whether completion requires all workers, a minimum completion threshold or an evidence threshold.
Report P50 and P95 completion time, time to first usable output, slowest-branch time and collection time under realistic load. Contention at a shared endpoint can wipe out the speed gain.[17][20][22]
Risk
Simultaneous workers increase peak request rate, memory use and connection demand. Cap concurrency, and monitor throttling and queue time for each worker. Use bounded retries with back-off where needed. Store late results separately, record workers as completed, timed out, cancelled or retried, and label partial answers clearly.[17][20] If outputs need reconciliation, add a synthesis stage; the next section measures its extra cost and delay.
5. Supervisor with parallel workers and synthesis
When parallel workers disagree, add one model-based synthesis call to reconcile conflicts, remove duplication and rank evidence. Keep later validation as a separate stage.[23][26] Use synthesis only if the gain in usable answers justifies the extra cost and delay.
Quality
Compare three versions: the baseline, parallel output without synthesis and parallel output with synthesis. Score factual accuracy, completeness, source quality, instruction adherence, consistency and usability separately. Record the errors synthesis fixes - and those it introduces. Clarity is not quality. Check whether synthesis resolves conflicts or simply repackages them.[24][28]
Cost
Include one synthesis call in the cost calculation: C_total = C_supervisor + ΣC_worker,i + C_synthesis + C_retries + C_tools. Count input and output tokens, repeated prompts, worker context, inter-agent messages, failed branches and retries. Account for any verification call separately.
Cap output lengths and pass relevant evidence rather than full transcripts. Compare cost per successful task with and without synthesis to measure what that extra call adds.[21][26]
Latency
Synthesis adds a serial step: completion time ≈ planning + slowest branch + hand-off + synthesis + optional validation. Measure synthesis time separately, then compare P50/P95 usable-answer time with the no-synthesis version. Long worker outputs can turn this final call into the bottleneck.[23][25][27]
Risk
An extra call can make disagreement look resolved when it has merely been hidden. Synthesis may omit evidence or turn shared mistakes into apparent consensus.
Track contradictory recommendations, duplicated evidence, false consensus, omitted results, prompt injection, context overflow, partial failures and correlated errors. Give the synthesis call evidence-linked worker findings with explicit uncertainties, and tell it to preserve unresolved disagreements. Add a separate verifier only when testing shows that fewer failures justify another call and more delay.[24][26]
6. Supervisor with task-based delegation and retries
This pattern lets the supervisor choose workers at run time and retry only the branches that fail.
Quality
Choose workers by task class, required capability and data access - not from a fixed roster. Send routine requests directly to a worker; use orchestration when a task needs several specialists.
Give each worker a short contract covering inputs, outputs, evidence and failure status. Check hand-offs against it. Retry temporary failures, switch specialists when the first choice is a poor fit, and escalate missing permissions or source data.[22][32] These routing decisions affect both expected call counts and retry costs.
Cost
Variable delegation still needs explicit call counts. For one initial supervisor call, n workers, one synthesis call and a retry probability p_i for each worker, use:
Expected calls = 1 supervisor + n worker calls + 1 synthesis call + Σ p_i retry calls.
This assumes no more than one retry per worker. If failures trigger a new plan, add expected replanning calls separately.
Calculate spend from each component’s tokens and charges. Count unusable outputs, retries and supervisor recovery calls in total spend per successful task. Report P95 task cost too.[31]
Latency
For independent branches running in parallel, estimate:
T ≈ T_supervisor + max_i(T_worker,i + T_queue,i + T_retry,i) + T_synthesis + T_replan
Include queueing, failed attempts and back-off within each branch. Treat replanning as a separate serial term.
Trace supervisor queue time separately from time spent waiting for workers, and compare P50 and P95 usable-answer time.[32][33] Idle workers alongside a growing supervisor queue suggest a dispatch bottleneck. Test batched dispatch or asynchronous result collection before adding workers.
Risk
Put timeouts, retry budgets and hand-off recovery in workflow controls - not just prompts. Set maximum retry counts, per-task and per-worker retry budgets, bounded exponential back-off with jitter, concurrency limits and circuit breakers.
Protect actions that have side effects with operation IDs and deduplication checks. Stop retrying when an error is permanent or the downstream service signals overload. Track recovery rate, duplicate actions and escalations.[13][29][30][33]
How Supervisor Calls and Worker Counts Affect Cost
Set two variables: supervisor-call frequency and worker count. Use the same task set as the architectures above, and change one variable at a time. Keep the model, prompts and workload fixed.
The table below separates the cost effects of these two variables.
Compare Planning, Routing, Replanning and Synthesis
| Supervisor activity | Added calls | Context passed | Potential gain | Main cost risk |
|---|---|---|---|---|
| Planning once | Usually one | Task description and constraints | Consistent decomposition | Up-front token spend |
| Routing at each step | One or more per step | Current state and available workers | Specialist selection | Repeated prompts and histories |
| Replanning after failures | Conditional | Failure details, prior attempts and remaining work | Error recovery | Retry tokens and tool charges |
| Final synthesis | Usually one | Worker outputs and required format | Consolidated findings | Large context and duplication |
Pass each worker only the context it needs. Full histories, lengthy worker outputs and duplicated instructions all add input tokens. Prompt caching can cut repeated-context costs, but providers price cache reads and writes differently. Apply their actual cached-input and cache-write rules - don't assume every repeated token gets a discount.[34][36]
With the call structure mapped out, you can calculate its cost.
Calculate Total Cost per Task
Use C_total = C_supervisor + ΣC_workers + C_tools + C_infrastructure, counting synthesis once within supervisor spend.
For each call, calculate:
(uncached input tokens × input rate + cached input tokens × cached rate + output tokens × output rate) ÷ 1,000,000
Add cache-write charges where needed. If the provider charges for cache writes through an alternative input rate, don't count them twice.[36]
For deployment figures, state the provider, model/version, region, price date, workload and token mix. Also specify retry and cache assumptions, tool prices, the exchange-rate assumption and how infrastructure costs are allocated. Report direct model spend separately from all-in cost.
Illustrative only: the table uses a fixed input/output price assumption and excludes tools, retries, caching and infrastructure.
Rates are US$0.10 per million input tokens and US$0.50 per million output tokens, converted at US$1 = £0.79. Each call uses 1,000 uncached input and 200 output tokens, costing £0.000158. Low means planning and synthesis; medium adds routing per worker; high adds one replanning call per worker. These are fixed call-count scenarios, not failure-rate estimates.[34][35]
The rows below show how adding workers and supervisor calls increases total cost.
| Supervisor-call frequency | Workers | Supervisor calls per task | Total tokens per task | Model cost per attempt (£) |
|---|---|---|---|---|
| Low | 1 | 2 | 3,600 | £0.000474 |
| Low | 2 | 2 | 4,800 | £0.000632 |
| Low | 4 | 2 | 7,200 | £0.000948 |
| Medium | 1 | 3 | 4,800 | £0.000632 |
| Medium | 2 | 4 | 7,200 | £0.000948 |
| Medium | 4 | 6 | 12,000 | £0.001580 |
| High | 1 | 4 | 6,000 | £0.000790 |
| High | 2 | 6 | 9,600 | £0.001264 |
| High | 4 | 10 | 16,800 | £0.002212 |
Hypothetical calculation, not measured results or a deployment quote.
Cost alone doesn't decide the design. The gain must justify the extra spend.
Find When Another Worker Pays Off
Compare rows with the same call frequency to isolate worker cost. Compare rows with the same worker count to isolate orchestration cost. Before judging value, build a separate measured-results table using task traces.
An added worker pays only when the business value of its measured improvement in success rate or quality exceeds its added all-in cost. Test it against the single-agent baseline on the same workload.
Only claim that quality gains flatten when repeated trials show smaller marginal improvements beyond normal run-to-run variation. This calculation-only table shows no quality gain.
The next section tests whether the same call pattern also increases usable-answer time.
How Sequential and Parallel Execution Affect Latency
::: @figure 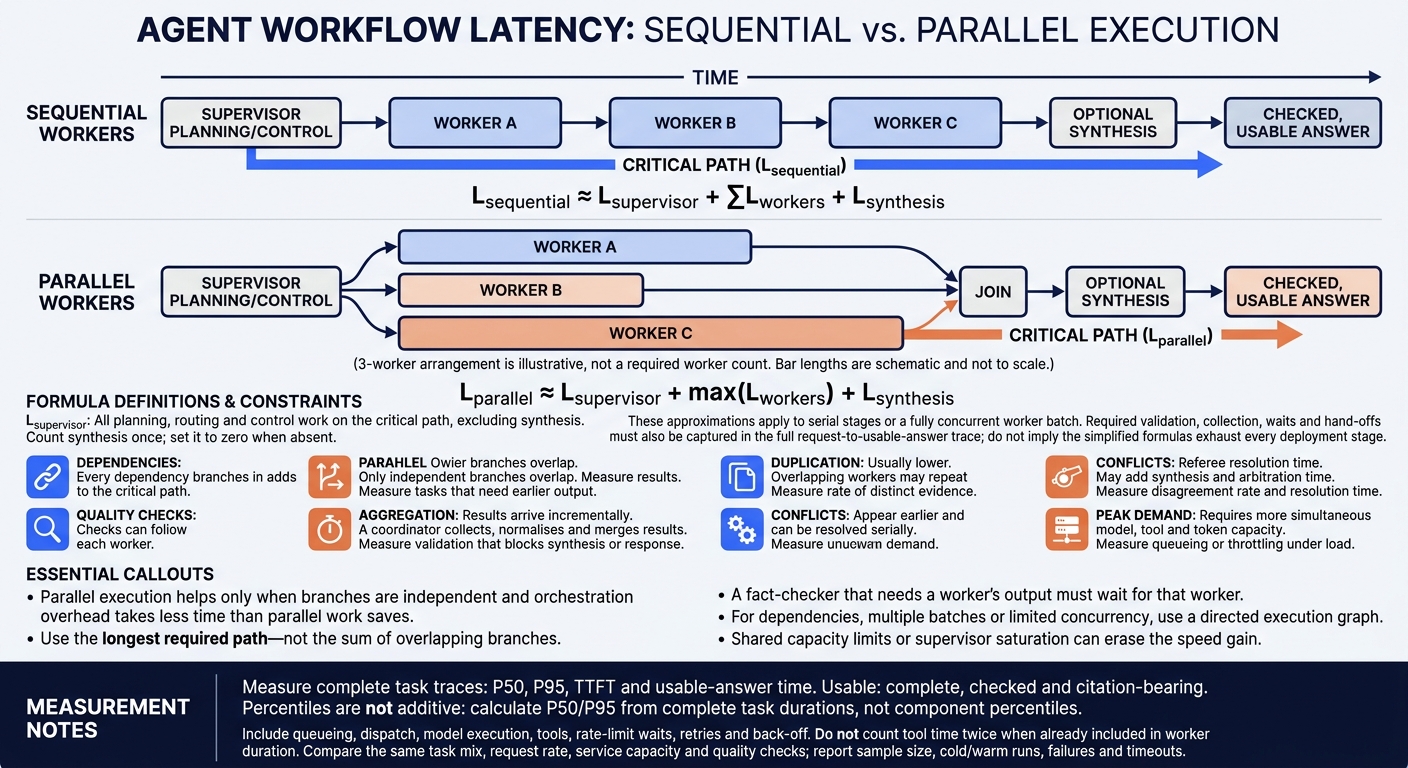 {Sequential vs Parallel Agents: Latency Explained}
:::
Compare wall-clock paths in supervisor-led teams, not just worker counts. Parallel execution helps only when branches are independent and orchestration overhead takes less time than parallel work saves.[38]
Call counts explain spend. Execution paths explain delay.
| Factor | Sequential | Parallel | Measure |
|---|---|---|---|
| Dependencies | Every dependency adds to the critical path | Only independent branches overlap | Tasks that need earlier output |
| Quality checks | Checks can follow each worker | Checks may wait for the slowest branch or run concurrently | Validation that blocks synthesis or response |
| Aggregation | Results arrive incrementally | A coordinator collects, normalises and merges results | Join time for n outputs |
| Duplication | Usually lower | Overlapping workers may repeat retrieval or reasoning | Rate of distinct evidence |
| Conflicts | Appear earlier and can be resolved serially | May add synthesis and arbitration time | Disagreement rate and resolution time |
| Peak demand | Lower concurrent demand | Requires more simultaneous model, tool and token capacity | Queueing or throttling under load |
Use these differences to calculate the longest required path - not the sum of all work.
Calculate the Critical Path
These approximations apply to serial stages or a fully concurrent worker batch. The orchestration pattern determines whether extra workers shorten the path or just add waiting.
L_supervisor includes all planning, routing and control work on the critical path. It excludes synthesis counted separately. Count synthesis once, and set it to zero when absent.[38]
L_sequential ≈ L_supervisor + ΣL_workers + L_synthesis
L_parallel   ≈ L_supervisor + max(L_workers) + L_synthesis
For dependencies, multiple batches or limited concurrency, use a directed execution graph instead. Record start and end timestamps for supervisor calls, workers, tools, validation and synthesis, including waits and hand-offs. Find the longest required path from request receipt to a usable answer. Don't add overlapping branches together.[43]
A fact-checker that needs a worker’s output must wait for that worker.[38] Check the calculated path against complete traces.[43]
Measure Queues, Tools and Retry Delays
Supervisor saturation or shared capacity limits can make parallel execution slower.[38] Use nested spans to separate queueing, dispatch, model execution, tools, rate-limit waits, retries and back-off.[43]
Don't count tool time twice if it already sits within the worker duration. Record each branch’s timeout, retry status and completion time: synthesis usually waits for the slowest required worker.
As worker counts and request load grow, track supervisor queue depth, dispatch time and active calls too. Limit retries and use exponential back-off with jitter to reduce retry storms.[37][38][40]
Report P50, P95 and Usable-Answer Time
Measure latency from full traces, not component estimates. Report end-to-end P50 and P95, TTFT and usable-answer time. Define “usable” as complete, checked and citation-bearing.[39][41]
Percentiles aren't additive. Calculate them from complete task durations, not component percentiles.[39][41]
Compare configurations using the same task mix, request rate, service capacity and quality checks. State the sample size, separate cold-start from warm runs, and report failures and timeouts alongside latency.[42]
Measure Quality, Reliability and Added Value
Judge extra agents by accepted outcomes, not extra activity. Test all six configurations on the same tasks, using identical data, tools, model settings and limits. Label measured results M, calculations C, assumptions A and thresholds B.
Use the table to check whether extra supervisor calls or workers justify their cost and delay.
| Configuration | Task success M | Factual accuracy M | Step success M | Change vs baseline C | Reliability M | £/attempt C | £/success C | End-to-end P50/P95 M | Throughput (completed tasks/min) C |
|---|---|---|---|---|---|---|---|---|---|
| Single-agent baseline | - | - | - | Reference | - | - | - | - | - |
| Supervisor + one worker | - | - | - | - | - | - | - | - | - |
| Sequential workers | - | - | - | - | - | - | - | - | - |
| Parallel workers | - | - | - | - | - | - | - | - | - |
| Parallel workers + synthesis | - | - | - | - | - | - | - | - | - |
| Task-based delegation + retries | - | - | - | - | - | - | - | - | - |
Record each run, then group successes and failures by cause.
Score Task Results and Failures
Define task success as runs that meet every acceptance criterion divided by all attempted runs, including timeouts and incomplete runs. For factual accuracy, report correct verified claims divided by assessed claims, alongside the share of complete answers with no material factual errors.
Measure step success as successful required steps divided by all required steps. Count skipped and failed steps as failures, and report partial completion separately.
Record first-pass and post-retry success, failure-free completion, escalations and the share of tasks that pass all k repetitions.[44] Group failures into planning, routing, hand-off, tool, worker, synthesis, validation, infrastructure and budget categories.
Log supervisor queue saturation and conflicting outputs. Check whether conflicts were resolved correctly - and whether workers that agreed relied on the same faulty source.
After scoring the baseline and variants, isolate one architecture change at a time.
Test One Added Worker or Stage at a Time
Test one added worker, planning stage, verification stage or synthesis stage at a time. Keep test data, model policy, tools, token limits and unchanged prompts fixed. Document any prompt changes you cannot avoid, and use a prompt-matched control where needed.
Randomise task order and repeat runs. Report task count, repetitions, exclusions and paired confidence intervals. Bootstrap by task to preserve dependence between repeated runs.
Show absolute scores and percentage-point changes, plus relative changes in cost and latency. Separate corrected errors from newly introduced errors: a small average gain can hide worse results on high-risk tasks.
Once the measured differences are stable, turn them into a per-task decision rule.
Check Whether the Gain Justifies the Cost
Calculate net value = quality/reliability gain − added task cost − latency penalty, with every term expressed in pounds per task. Do not double-count higher success and fewer factual failures.
Calculate £/attempt as total spend divided by attempts. Calculate £/success as total spend divided by accepted completions, including spending on failed runs and retries. For throughput under the shared budget, divide successful completions by elapsed test minutes.
Mark worker independence and expected call counts as A. Mark minimum success, maximum £/success, maximum P95 and minimum throughput as B. Keep an addition only when the evidence supports a gain large enough to matter in practice, it meets those thresholds and its value exceeds the added cost.
Use the same traces to distinguish measured performance from claimed performance.
Check Sources and Profiling Methods
Use verified papers and observability documentation to support technical claims - not as substitutes for deployment evidence. Link outcomes to tool arguments, intermediate decisions and final system state, so persuasive answers cannot hide incorrect actions.[45][46]
Before citing a published finding, record the source version, workload, judging method and declared budgets. Keep forecasts separate from measured results. Claim combined profiling only for resources actually recorded: compute, memory or network. Where no verified benchmark matches the workflow, use sealed internal tests and auditable traces.
Conclusion: Keep, Simplify, Parallelise or Add Controls
Choose the simplest configuration that meets your quality, reliability, cost and response-time targets, based on the measured results above.
Use this matrix as the final selection rule.
| Configuration | Use when |
|---|---|
| Single agent / one-call planning | It meets every target and orchestration adds no meaningful improvement |
| Supervisor + one worker | Routing or specialist execution fixes a measured weakness enough to justify the extra call |
| Sequential workers | Later steps need earlier outputs, and the measured gain justifies serial execution |
| Parallel workers | Independent branches improve coverage or response time without queueing or contention cancelling out the gain |
| Parallel workers + synthesis | Verified reconciliation adds enough value to justify the synthesis stage |
| Task-based delegation + retries | Selective recovery improves accepted outcomes within agreed limits |
Once you've chosen a configuration, set firm limits on cost and latency. Cap workers, supervisor calls, tool calls, input and output tokens, retries, elapsed time and £ per task. Track £ per successful task and usable-answer time against agreed thresholds, using the same trace schema for deployment monitoring. Define what happens when a limit is reached: return the best verified partial result, for example, or route the task to a simpler path.
Re-test whenever prompts, models, tools, worker counts or recovery policies change. Use the same regression tasks and comparable traffic conditions. Keep the selected design as the current operating point until the next regression run.
Hokstad Consulting can help instrument workflows, set budget controls and assess business value.
FAQs
How can I put a £ value on better agent answers?
Calculate cost per successful task by dividing the total delivery cost by the number of accepted tasks. Compare the result with an established baseline.
Include model inference, tool usage, infrastructure, retries, recovery work and human review time in the cost. Count each accepted task once, no matter how many attempts it takes.
Better answers justify their cost only when they reduce total effort - including rework and validation - without lowering quality or increasing risk.
How many test runs do I need to compare agent setups?
Start with 20 to 50 representative tasks, including successful runs, failed runs and complex edge cases. Use these to set routing thresholds and define quality and cost requirements [1]. Next, test your routing policy on a larger evaluation dataset, then use a separate holdout set to check reliability [1].
Track cost per completed task (£) and p95 latency to fine-tune your setup without letting quality fall below your minimum requirements [1].
How do I find the best worker count for peak demand?
Set a baseline using 60 to 90 days of production metrics, tracking requests per minute and tokens per request. Watch queue depth and connection pool saturation for signs of capacity limits. As a rule of thumb, set your parallelism limit to match the number of available CPU cores.
Track cost per verified completion in £ alongside end-to-end latency. These measures help you check whether extra agents improve efficiency or add costs through rework or competition for resources.