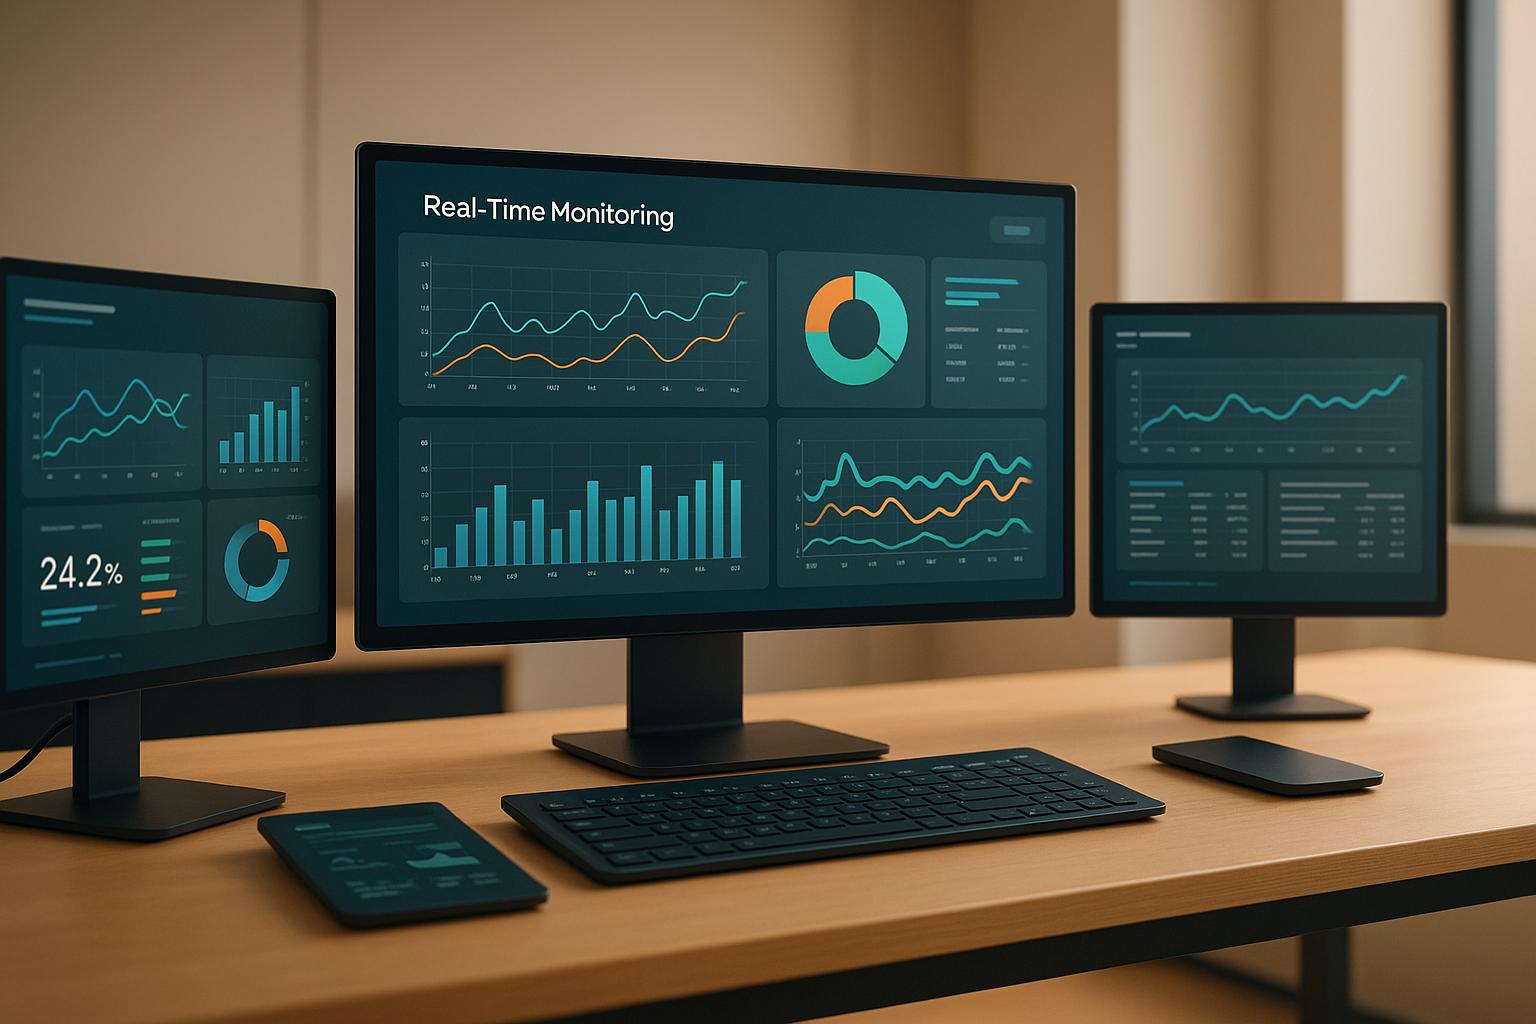
Real-time monitoring is essential for managing multi-cluster CI/CD pipelines. It ensures immediate visibility into builds, deployments, and system performance, helping teams detect and resolve issues quickly. Traditional monitoring often fails to keep up with the dynamic nature of Kubernetes and containerised environments, making advanced tools a necessity.
Here’s what you should prioritise when choosing a monitoring tool:
- Unified Dashboard: Combine logs, metrics, and traces from all clusters into one interface for easy troubleshooting.
- Real-Time Alerts: Get instant notifications for critical issues via Slack, email, or webhooks.
- Kubernetes Support: Ensure the tool can track pods, container workloads, and cluster health dynamically.
- Scalability: Handle thousands of nodes and clusters efficiently, even across regions.
- Automation: Use AI for anomaly detection, root cause analysis, and automated responses like rollbacks or scaling.
Effective monitoring can reduce errors by 90%, cut deployment times by 75%, and lower cloud expenses by 30–50%. By integrating tools like Datadog or Grafana and using frameworks like OpenTelemetry, you can build a seamless, cost-efficient system tailored to your needs.
Key takeaway: Real-time monitoring isn’t just about spotting problems - it’s about preventing them, improving pipeline performance, and saving costs.
For UK businesses, aligning tools with local standards (e.g., £ for costs, DD/MM/YYYY dates) and compliance requirements further ensures smooth operations.
Monitoring, Logging, And Alerting In Kubernetes

Key Features to Look For in Real-Time Monitoring Tools
When choosing monitoring tools for multi-cluster CI/CD pipelines, it's essential to prioritise features that help you move from simply reacting to problems to actively preventing them. The right tools ensure visibility, quick responses, and smooth scaling, enabling continuous and coordinated monitoring across all clusters.
Unified Dashboard
A unified dashboard is a must-have for maintaining a clear, consolidated view of your system. It brings together logs, metrics, and traces from multiple clusters into a single interface, so you don’t need to juggle multiple tools during troubleshooting. This dashboard should highlight key metrics across different pipeline stages, such as build times, test results, deployment statuses, and resource usage, giving teams a comprehensive overview of system health.
Real-Time Alerts and Notifications
Real-time alerts are crucial for identifying and addressing anomalies or bottlenecks as they happen. Look for tools that offer customisable alerts and integrate seamlessly with platforms like Slack, Microsoft Teams, email, or webhooks. This helps ensure your team focuses on the most critical events without being overwhelmed by unnecessary notifications.
Kubernetes and Container Support
Given the widespread use of containerised infrastructure in modern CI/CD pipelines, native Kubernetes and container support is non-negotiable. Monitoring tools should automatically detect container workloads and provide insights into performance, cluster health, and resource usage. Since Kubernetes environments are highly dynamic - where pods are constantly being created, removed, or shifted - these tools should help identify issues like pod failures, resource contention, and networking problems early on.
Scalability and Multi-Cluster Support
Scalability is key for handling the complexity of large-scale environments. Effective tools must manage thousands of nodes and clusters without compromising performance. Features like distributed data collection, efficient time-series storage, and robust querying ensure smooth operation. Additionally, the ability to aggregate data from geographically dispersed clusters ensures consistent visibility across your entire system.
Automation and Proactive Detection
Automation is critical for managing the ever-changing nature of CI/CD pipelines. Advanced monitoring tools leverage AI to correlate metrics and logs, speeding up the detection of issues. Features like anomaly detection (which learns what normal
looks like), automated root cause analysis, and alert correlation (grouping related events) minimise manual intervention. These capabilities not only help prevent problems but can also trigger predefined actions - such as rolling back a deployment - so your team can focus on strategic initiatives rather than firefighting.
Implementing Real-Time Monitoring: Best Practices
To set up real-time monitoring effectively, ensure thorough coverage, automate responses, and adapt continuously to meet changing demands while keeping costs under control.
Ensuring Complete Coverage
Start by ensuring every component is monitored. Configure tools like Jenkins, GitHub Actions, ArgoCD, and Kubernetes to consistently produce logs, metrics, and traces. This consistency is crucial for maintaining visibility across your entire system.
Don’t overlook external dependencies like APIs, cloud services, and databases. These third-party services can quickly become weak links if left unchecked. Using frameworks like OpenTelemetry allows you to collect uniform data across various environments, helping you detect issues in external services before they impact users.
Make sure telemetry data is gathered at every stage of your pipeline - whether it’s during build, test, or deployment - and consolidate this data into a single platform. Regularly audit your monitoring setup to spot gaps as your system evolves.
For modern CI/CD environments, observability as code (OaC) is gaining traction. By managing monitoring configurations as version-controlled code, your observability setup evolves in sync with your infrastructure, ensuring consistency across environments.
Once you’ve established complete visibility, the next step is implementing automated responses to detected issues.
Automated Remediation and Alert Management
Real-time monitoring becomes truly effective when it’s paired with automation. Set up your monitoring tools to trigger workflows that handle rollbacks, scaling, or incident response without manual intervention. This shifts your approach from reactive problem-solving to proactive system management.
Fine-tune alert thresholds using historical data and the potential business impact of various issues. Avoid overwhelming your team with unnecessary alerts. For example, a failed deployment could automatically trigger a rollback, while resource contention might prompt auto-scaling.
Define clear alert thresholds and use notification channels like Slack, email, or webhooks to trigger automated actions. Integrating with orchestration platforms such as Kubernetes can further streamline responses, enabling tasks like workload redistribution or resource scaling to happen automatically.
This automation lays the groundwork for continuous improvement and smarter cost management.
Continuous Optimisation and Cost Management
To keep your monitoring system effective and cost-efficient, it needs regular updates. Review your monitoring configurations periodically to ensure they align with your current workloads, services, and business goals. What worked for a small setup might not scale effectively as your infrastructure grows.
Track metrics like build times, resource usage, and performance to manage cloud costs (£) and optimise resource allocation. This helps identify inefficiencies, such as over-provisioned clusters or overly frequent builds, allowing you to adjust accordingly.
Cost management isn’t just about cutting back. Focus on identifying which data provides real value and which creates unnecessary noise. Logs and metrics can quickly become expensive to store, especially in high-volume environments. Regularly analyse your data to determine the right retention periods and sampling rates.
An optimised monitoring setup not only reduces costs but also speeds up deployments, minimises errors, and cuts downtime. Treat monitoring as a dynamic capability that evolves alongside your infrastructure. By adapting your strategy as your CI/CD pipelines and business needs grow, you’ll maintain visibility without adding unnecessary complexity or expense.
Need help optimizing your cloud costs?
Get expert advice on how to reduce your cloud expenses without sacrificing performance.
How Hokstad Consulting Can Help

Setting up real-time monitoring for multi-cluster CI/CD pipelines isn't just about installing tools - it's about having the expertise to integrate those tools into a seamless, effective system. Hokstad Consulting brings a wealth of DevOps and cloud infrastructure knowledge to help UK businesses improve their development operations while keeping costs in check. They prioritise solutions that fit into existing workflows and deliver clear, measurable benefits.
DevOps Transformation Services
Hokstad Consulting takes a proactive approach to DevOps transformation by building CI/CD pipelines with monitoring capabilities baked in from the start. Instead of adding monitoring as an afterthought, they design systems that naturally generate the telemetry data needed for real-time insights.
Their process starts with an in-depth evaluation to create a monitoring framework tailored to the client’s needs. Hokstad Consulting then integrates platforms like Datadog, Splunk, or Grafana, ensuring the tools align perfectly with the client’s existing technology stack. This avoids unnecessary complexity and ensures smooth operations.
By leveraging frameworks like OpenTelemetry, they provide consistent tracking of logs, metrics, and traces throughout the entire pipeline - from code commit to deployment. For businesses using Kubernetes or containerised environments, their solutions focus on eliminating manual bottlenecks and reducing human error, making multi-cluster CI/CD environments more efficient and reliable.
Cloud Cost Optimisation
Improving efficiency is only part of the equation; managing costs is equally important. Real-time monitoring can generate massive amounts of data, which, if not managed carefully, can lead to escalating storage and processing expenses. Hokstad Consulting helps businesses cut cloud costs by 30-50% while maintaining effective monitoring practices [1].
They analyse monitoring data to pinpoint inefficiencies, such as resource bottlenecks or underused infrastructure. From there, they recommend practical solutions like resizing cloud resources, implementing automated scaling, and eliminating waste. For UK companies, this means reduced monthly cloud bills, better resource use, and more predictable budgets.
A SaaS company saved £120,000 annually after implementing Hokstad’s cloud optimisation strategies. Meanwhile, an e-commerce business saw a 50% performance boost while cutting costs by 30% [1].
Their No Savings, No Fee
model is a testament to their confidence. Clients only pay a percentage of the savings achieved, ensuring they get real value from their investment.
Custom Monitoring Solutions
No two organisations are the same, and Hokstad Consulting understands that monitoring solutions need to reflect this. They create tailored systems to meet specific business needs, whether it’s streamlining alert priorities or integrating automated remediation processes.
For example, they’ve developed custom Grafana dashboards for financial services clients. These dashboards display real-time metrics like build times, deployment success rates, and error frequencies, all formatted to UK standards, including date and time conventions and costs in pounds sterling. Whether metric or imperial units are needed, their solutions cater to local operational requirements.
Their alert systems are designed to avoid overload by prioritising the most critical issues, ensuring faster response times. Automated scripts linked to alerts handle tasks like scaling resources or redistributing workloads, reducing the need for manual intervention.
For businesses operating under UK data protection regulations, Hokstad Consulting ensures that monitoring solutions are compliant while still providing the visibility needed to manage multi-cluster CI/CD pipelines effectively. Their approach includes continuous analysis and regular reviews, keeping systems running at peak performance.
Conclusion: Selecting the Right Monitoring Tool
Choosing the right monitoring tool is a critical step for ensuring the success of your multi-cluster CI/CD pipelines. Let’s break down the essential considerations to help you make the best choice.
Why Real-Time Monitoring Matters
Real-time monitoring is the foundation of dependable CI/CD pipelines, especially in multi-cluster environments. It directly influences system reliability, cost management, and scalability. For instance, robust monitoring can lead to 75% faster deployments, 90% fewer errors, and 95% less downtime [1].
On top of that, effective monitoring can slash cloud expenses by 30–50%, potentially saving businesses over £50,000 annually [1]. These savings not only enhance operational efficiency but also pave the way for sustainable growth.
When evaluating tools, look for features like unified dashboards, real-time alerts, native Kubernetes support, and automation capabilities [2][3][4][5][7]. These functions are crucial for navigating the complexities of multi-cluster environments while providing actionable insights. Additionally, ensure the tool integrates smoothly with your existing CI/CD systems and offers customisable alerts and dashboards that fit your team’s specific needs [2][3][4].
Practical Steps for Businesses
Start by reviewing your current monitoring setup. Identify any gaps and evaluate your key metrics and alert thresholds [5][6]. Focus on tracking critical metrics such as:
- Build and deployment times
- Success and failure rates
- Resource usage
- Alert frequency
Monitoring in multi-cluster environments is both a technical and strategic task. Your chosen solution should not only meet immediate technical needs but also align with your long-term business goals, support compliance requirements, and adapt to changes in your infrastructure.
For UK-based organisations, it’s essential to select tools that cater to local standards, such as pound sterling for currency, DD/MM/YYYY for dates, and metric units. Compliance with UK data protection laws is equally important for managing costs, reporting to stakeholders, and maintaining operational efficiency.
Finally, consider consulting with experts who specialise in monitoring tools and strategies. Their guidance can help you navigate the complexities of selecting and configuring the right solution while ensuring that you get the most value from your investment. By taking these steps, your monitoring setup will not only be robust but also aligned with your broader business objectives.
FAQs
What advantages do real-time monitoring tools offer for multi-cluster CI/CD pipelines compared to traditional monitoring methods?
Real-time monitoring tools offer a clear window into the health and performance of multi-cluster CI/CD pipelines, allowing teams to quickly spot and address issues as they arise. Unlike older methods that depend on periodic data snapshots, these tools operate continuously, tracking metrics, logs, and events to ensure no critical detail slips through the cracks.
The advantages are hard to ignore. They boost pipeline stability with instant alerts, help fine-tune resource usage by flagging inefficiencies as they happen, and promote better team collaboration by providing a shared, real-time view of pipeline activity. For organisations aiming to keep deployments running smoothly and minimise downtime, these tools are a must-have in modern DevOps practices.
How do automation and AI features in monitoring tools minimise manual effort in CI/CD processes?
Automation and AI have transformed monitoring tools, making CI/CD processes much more efficient by eliminating repetitive manual tasks and cutting down on human errors. These tools can automatically spot issues, send out alerts, and even handle routine problems without needing someone to step in.
By weaving intelligent automation into their workflows, organisations can achieve more precise deployments, accelerate delivery timelines, and free up their teams to concentrate on strategic, high-value work instead of routine monitoring. This shift ensures operations run more smoothly and delivers dependable results, even in intricate, multi-cluster setups.
What should UK businesses consider to ensure their real-time monitoring tools meet local standards and data protection regulations?
To make sure your real-time monitoring tools meet UK standards and follow data protection laws, it's crucial to focus on tools that adhere to GDPR (General Data Protection Regulation). This means ensuring data is stored securely, properly encrypted, and accessible only to authorised individuals.
You should also confirm that the tools comply with local data residency rules, ensuring sensitive information is processed and stored within the UK or approved regions. Features like detailed audit trails, role-based access controls, and strong logging capabilities are essential for maintaining transparency and accountability.
Regular compliance reviews are a must, and partnering with providers who offer clear documentation about how their tools align with UK regulations can save you time and effort. For added peace of mind, consider consulting experts such as Hokstad Consulting, who can help fine-tune your monitoring setup while keeping it compliant.
