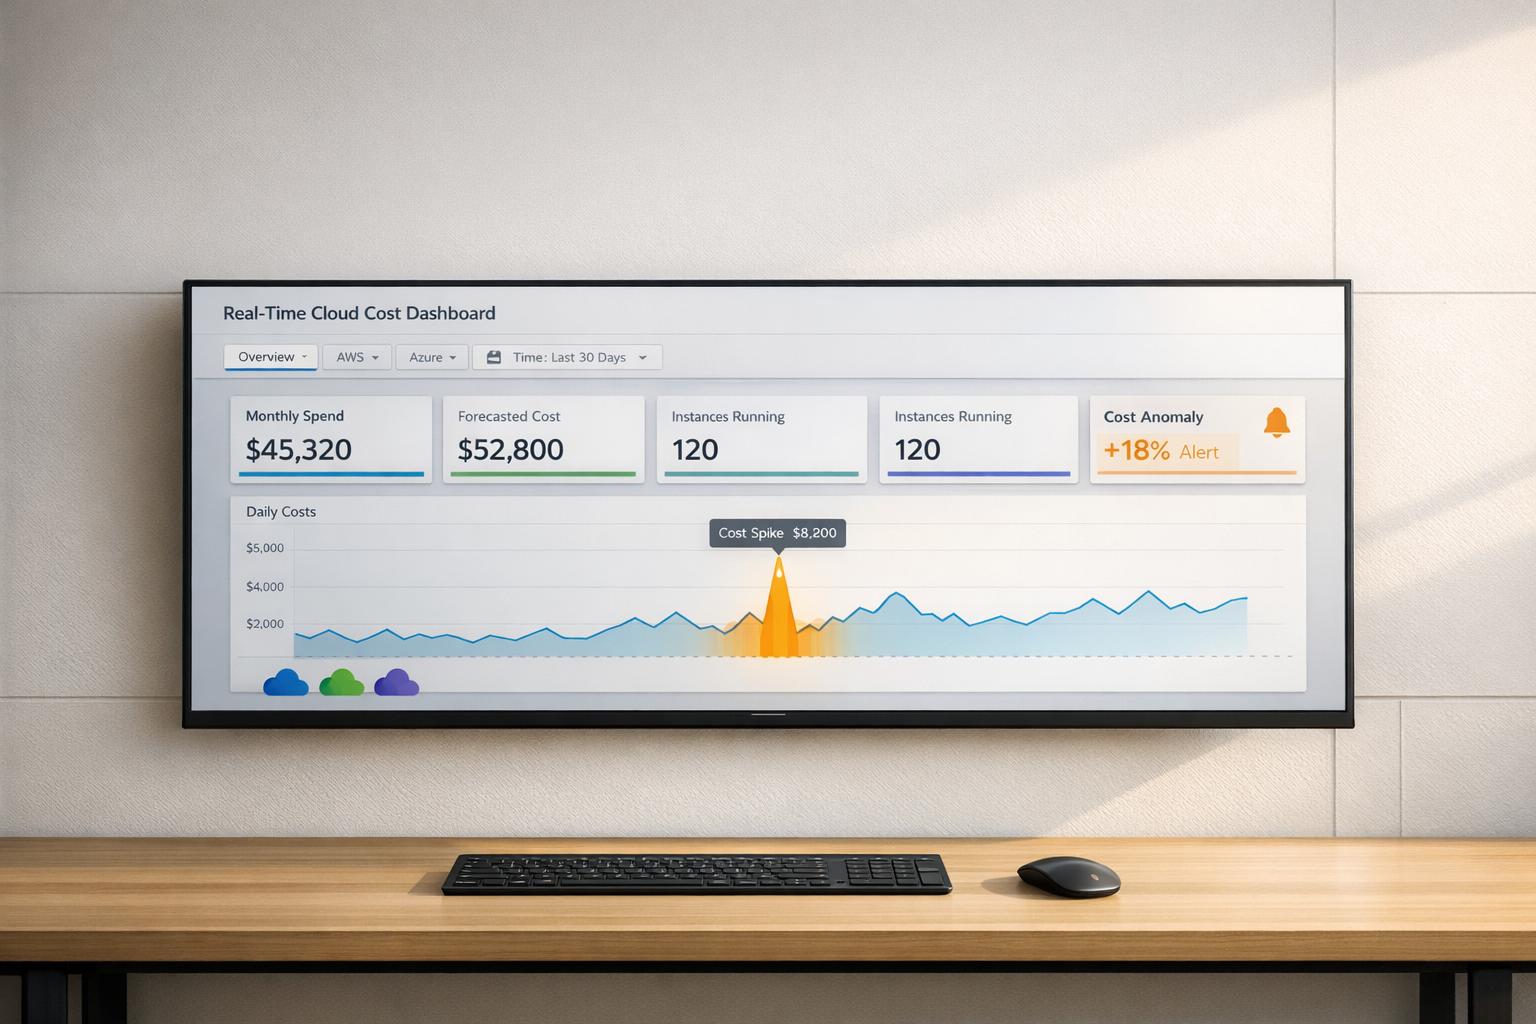
A real-time cloud cost dashboard helps you monitor cloud spending as it happens, avoiding billing surprises and waste. Unlike static reports, these tools provide live data, alerts for anomalies, and actionable insights to manage costs better. With UK businesses wasting 35% of their cloud spend, and 73% of engineering teams struggling to identify cost spikes within 24 hours, these dashboards are crucial for effective cost control.
Key features to look for:
- Automated data ingestion: Real-time updates from AWS, Azure, GCP, and more.
- Anomaly detection: Quick identification of unusual spending patterns.
- Customisable dashboards: Tailored views for finance, engineering, or other teams.
Quick Comparison
| Feature | Cloudability | CloudZero | Kubecost |
|---|---|---|---|
| Real-Time Monitoring | Near-real-time, multi-cloud | Hourly updates, broad sources | Kubernetes-focused, near real-time |
| Customisation Options | Unlimited dashboards, tailored views | Business-specific cost mapping | Namespace, pod, and container-level insights |
| Alerting Precision | Machine learning-driven alerts | AI-based dynamic thresholds | Efficiency, spend, and budget alerts |
| Multi-Cloud Support | AWS, Azure, GCP, IBM, Oracle | AWS, Azure, GCP, Snowflake | AWS, Azure, GCP, Alibaba (limited) |
Choose Cloudability for financial governance, CloudZero for connecting costs to business metrics, or Kubecost for Kubernetes environments. The right dashboard can help you save up to 30% on cloud costs by identifying waste and improving visibility.
::: @figure 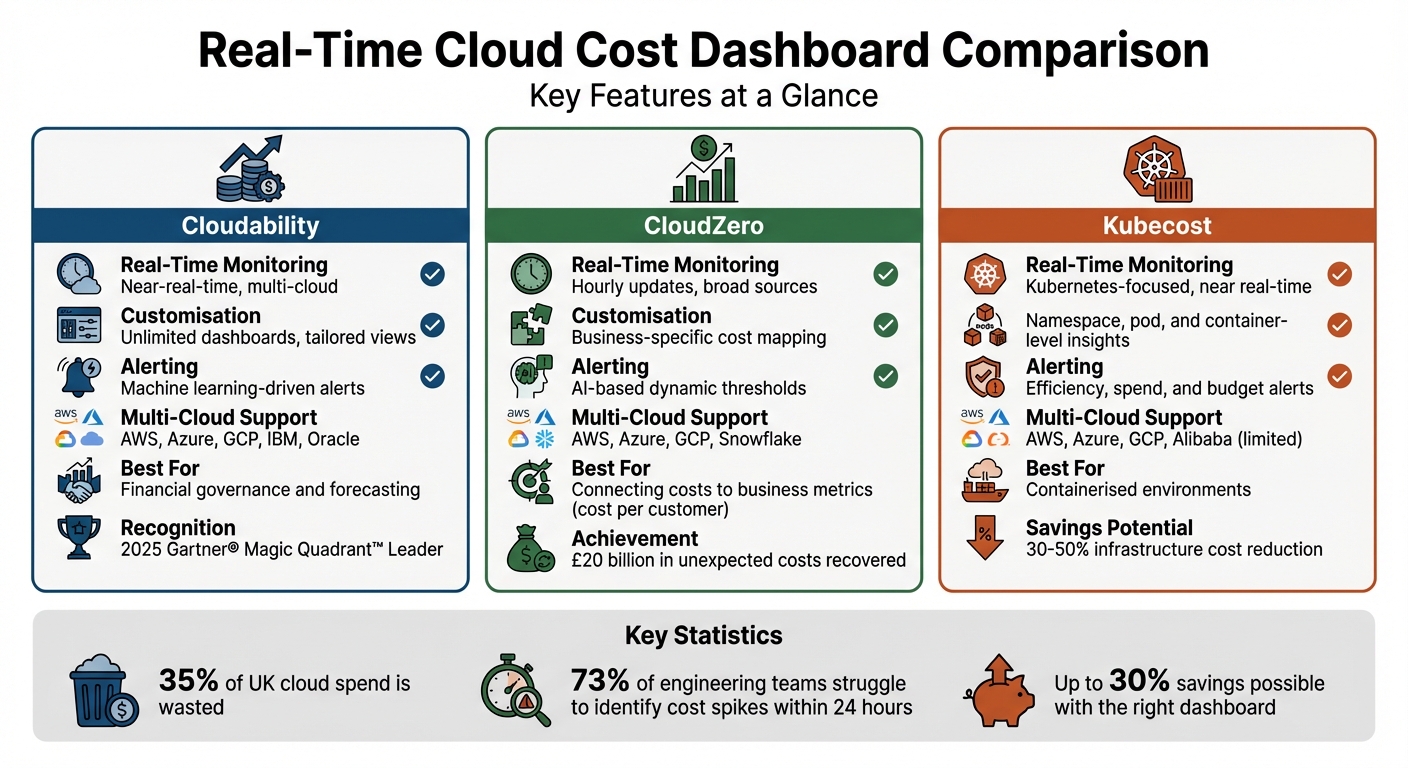 {Real-Time Cloud Cost Dashboard Comparison: Cloudability vs CloudZero vs Kubecost}
:::
{Real-Time Cloud Cost Dashboard Comparison: Cloudability vs CloudZero vs Kubecost}
:::
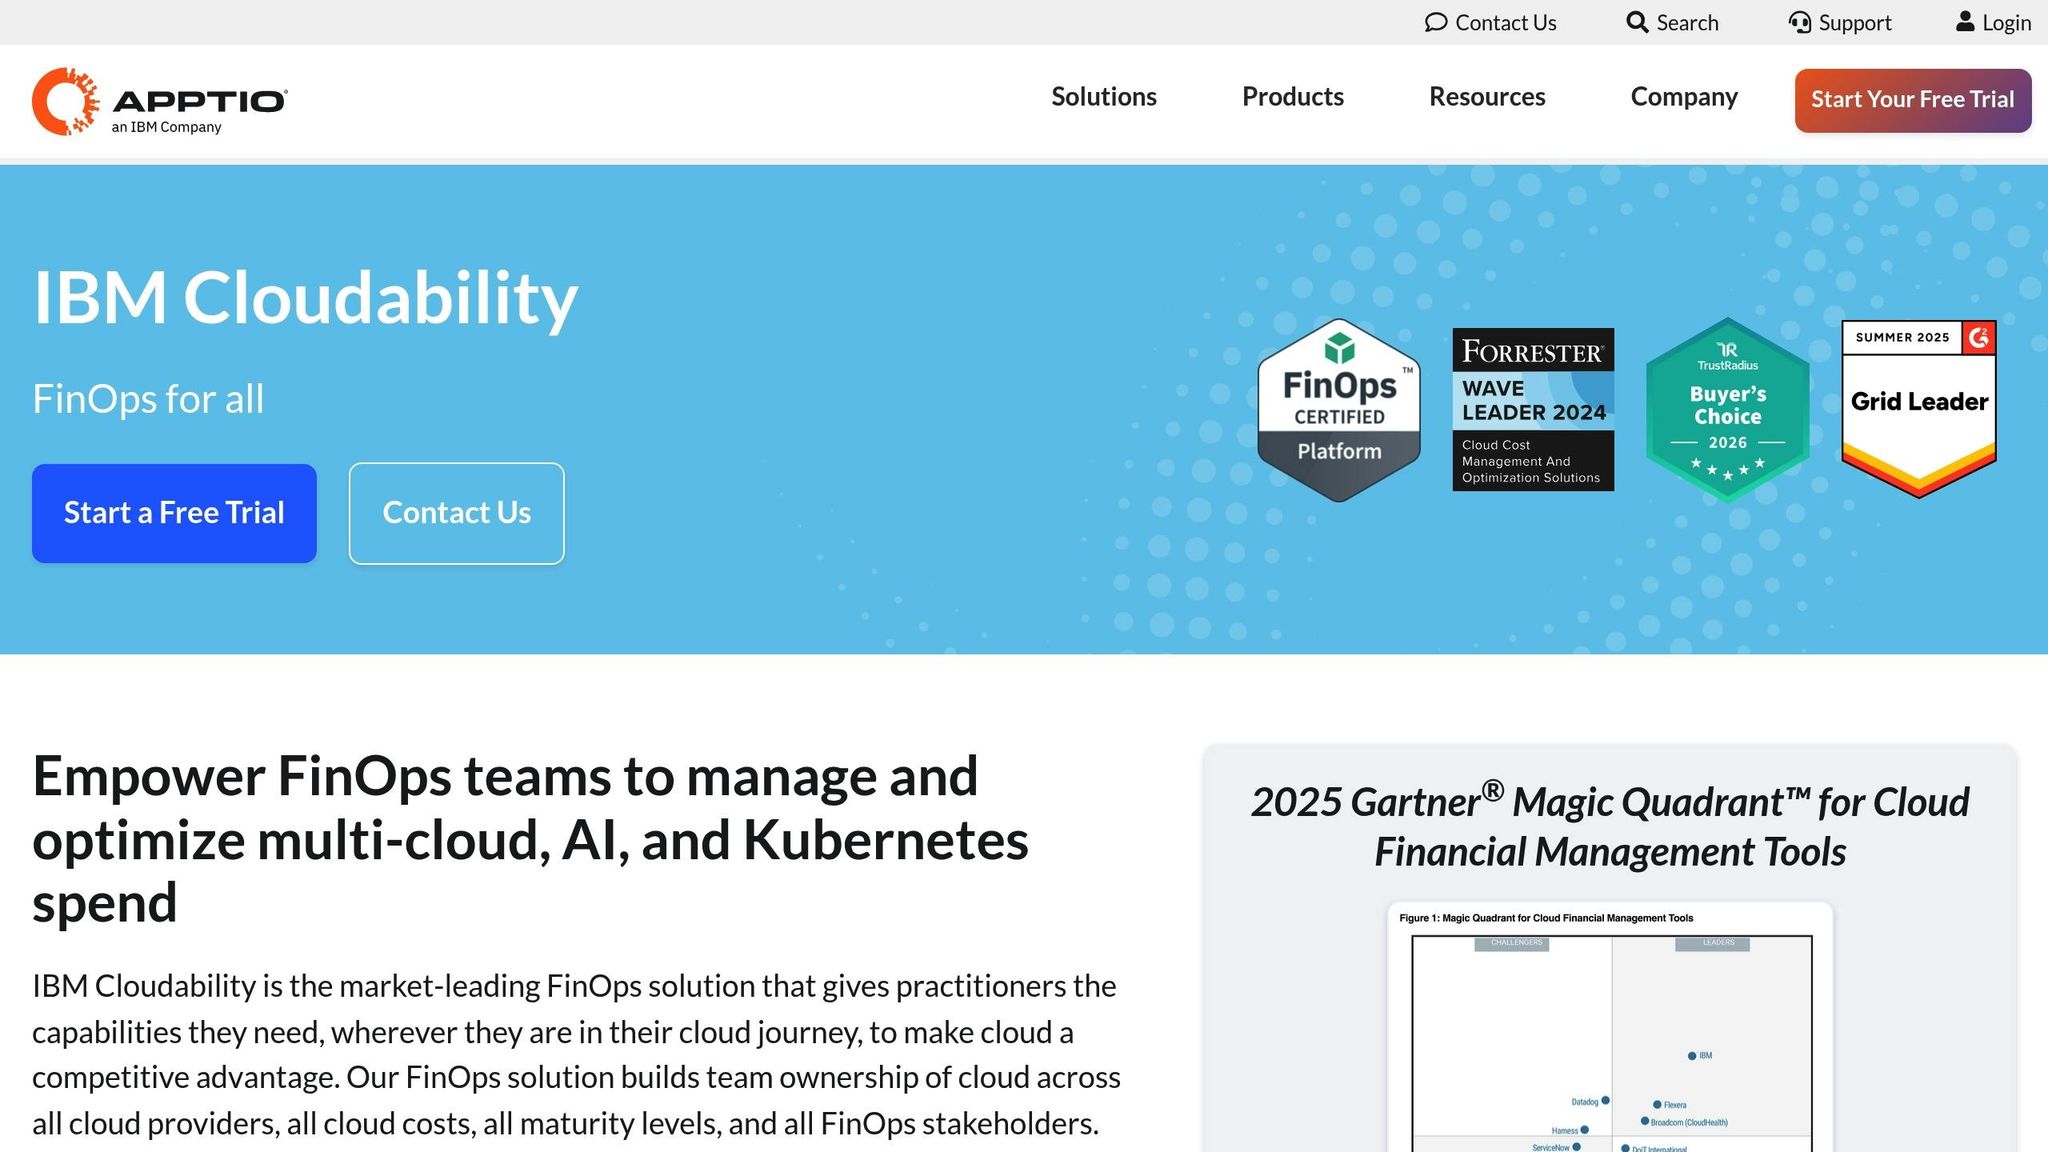
1. Cloudability
Real-time monitoring
Cloudability provides near-real-time cost visibility, with dashboards that refresh continuously as new data comes in[5]. Instead of waiting a full day for the official Cost and Usage Report, the platform offers real-time cost estimates, giving teams a head start on identifying and addressing any cost issues before they escalate[4].
The True Cost Explorer feature allows users to view costs in detail, breaking them down by cloud providers, cost categories, business units, and applications[6]. Teams can monitor key metrics like amortised costs, blended costs, unit economics (such as cost per customer or transaction), reserved instance usage, and even carbon footprint data for sustainability tracking[5][6]. This level of detail extends to container and Kubernetes expenses, which is vital for organisations leveraging modern cloud-native setups.
These real-time insights set the foundation for the platform's customisation options, enabling tailored reporting for different audiences.
Customisation options
Cloudability enables users to create unlimited custom dashboards and offers a Views
feature to customise reports for specific teams or stakeholders[5]. For instance, finance teams can access a company-wide spending overview, while engineering departments focus solely on costs tied to their budgets and resources.
The platform brings together data from AWS, Azure, and Google Cloud Platform into a multi-cloud single pane of glass[5]. This unified view allows users to generate reports for any data point or dimension, with dashboards supporting interactive drill-downs for deeper analysis.
Alerting precision
Cloudability complements its real-time insights with precise alerting capabilities. Using machine learning, it quickly identifies cost surges and anomalies[4][5]. To ensure these alerts lead to actionable outcomes, the platform integrates with tools like Jira, Datadog, and PagerDuty, automatically routing issues to the relevant engineering teams[5][6]. These teams can then take immediate corrective action.
The Business Mapping feature links cloud usage and costs to specific business outcomes, such as budgets, departments, or products[5]. Combined with resource-level reporting and the True Cost Explorer, this functionality enables teams to drill down into the exact services or containers driving cost spikes. This makes alerts more actionable than generic budget notifications.
Multi-cloud support
Cloudability supports native ingestion and normalisation for AWS, Azure, Google Cloud Platform, IBM Cloud, and Oracle[5][6]. By consolidating data from multiple providers into a single interface, organisations can manage their entire multi-cloud environment without switching between tools. This approach has earned Cloudability recognition as a Leader in the 2025 Gartner® Magic Quadrant™ for Cloud Financial Management Tools for the second consecutive year[5]. Additionally, Forrester Wave™ highlighted that IBM provides the most complete full-stack CCMO solution
[5].
This integrated multi-cloud capability sets the stage for evaluating other real-time dashboard solutions.
Need help optimizing your cloud costs?
Get expert advice on how to reduce your cloud expenses without sacrificing performance.
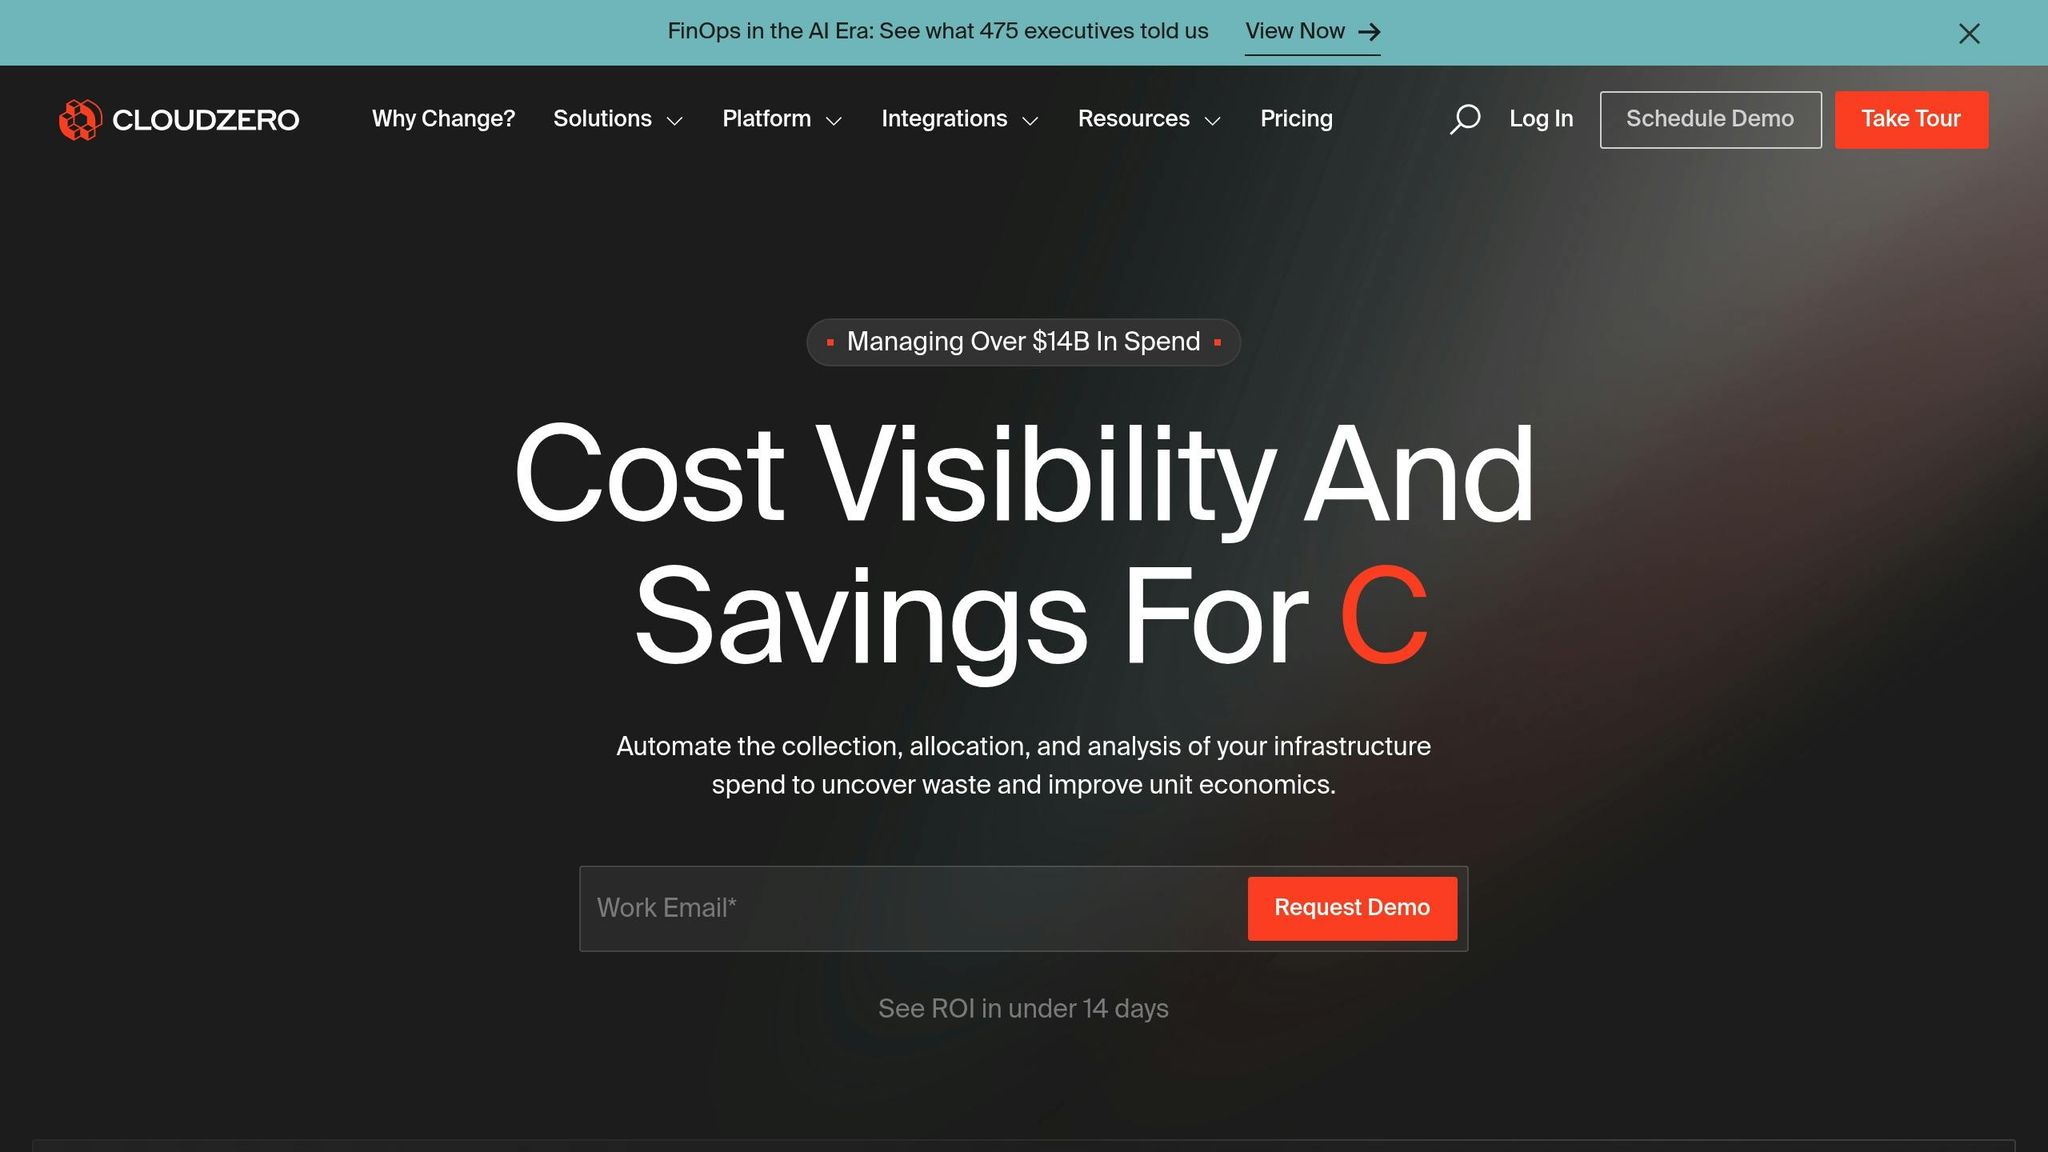
2. CloudZero
Real-time monitoring
CloudZero offers a sharp edge in cost management by identifying abnormal spending patterns within minutes, rather than waiting for the billing cycle to end [2]. The platform dives deep into cloud billing data, analysing it at an hourly level, which enables it to flag spending anomalies as they occur [8]. This detailed approach has uncovered over 5,500 cost-related issues and helped recover more than £20 billion in unexpected cloud expenses across its users [2].
The platform's AnyCost framework takes cost data from multiple sources using a Common Bill Format [7][12]. This means businesses can track spending across platforms like AWS, Azure, Google Cloud Platform, Snowflake, Kubernetes, and even AI services like Anthropic - all within one unified interface [10]. Additionally, CloudZero's CostFormation® technology ensures complete cost allocation, even for untagged resources, by using a proprietary definition language to organise spending based on business-specific dimensions [9][10].
CloudZero truly gives us a heartbeat of our spend at all times.– Adam Walker, VP of Infrastructure and Security, Validity [9]
These insights feed into highly flexible and customisable dashboards.
Customisation options
CloudZero empowers users to build and modify dashboards tailored to their needs. Using the CostFormation definition language, users can create Custom Dimensions
to map cloud costs directly to their business logic, such as specific products, features, or teams.
The platform also offers Views
, which allow team-specific dashboards and notifications via Slack or email [7][12]. This decentralised approach ensures that engineering teams only see costs relevant to their resources. Furthermore, CloudZero Analytics provides access to 13 months of data - covering the previous 12 months plus the current month - for long-term trend analysis [13].
Alerting precision
CloudZero doesn't just monitor costs - it refines alerts with advanced AI. Its self-training AI models continuously establish a dynamic baseline for normal
spending based on historical trends [2][15]. With hourly billing data analysis, it flags anomalies - averaging £401.74 per incident - within minutes [15]. To reduce false positives, the platform applies automatic thresholds based on a sliding scale of the previous 30 days. For example, accounts spending over £5 million monthly have a default alert threshold of £500 [8].
Peter Agelasto, Co-Founder and CPO at Starchive, shared how an alert helped him catch an enormous cost spike:
I click 'Review anomaly,' I jump in, and my first reaction is, 'Holy cow, we're up 1,600% of our normal costs!' Had we not been alerted, I wouldn't have caught this.[15]
This precision has led to major savings for customers, with Drift cutting annual costs by £2.4 million and PicPay saving £18.6 million [2][10].
Analytics depth
CloudZero stands out with its ability to calculate Unit Cost
metrics, such as cost per customer, transaction, or daily active user [11][12]. By focusing on these business-centric metrics, it shifts the conversation from raw spending to evaluating the value derived from that spend. Erik Peterson, CTO of CloudZero, summed it up perfectly:
The key question is no longer, 'How much did we spend?' It's now: 'Was it worth it?'[14]
To make cost management even easier, CloudZero includes an AI Advisor feature called Ask Advisor.
This tool allows users to query spending data using plain English instead of navigating complex filters [9]. Users have reported cutting the time spent managing costs by as much as 90% [9].
3. Kubecost
Real-time monitoring
Kubecost stands out by offering real-time insights and detailed cost tracking, making it easier for teams to manage cloud expenses effectively. It gathers pricing data from AWS, Azure, and GCP using billing APIs and makes this information accessible via a /metrics endpoint for instant visibility [16]. Costs are broken down at various levels - container, pod, namespace, deployment, service, and label - providing granular insights into where resources are being used [16][18].
To ensure accuracy, Kubecost starts by estimating node pricing based on data from the past week. These estimates are later reconciled with official invoices, typically 36–48 hours after billing data becomes available [17]. This dual-step process ensures teams have immediate access to actionable data while still aligning with final billing figures.
Additionally, Kubecost tracks infrastructure-specific costs like network egress (internet, cross-zone, and inter-region transfers), load balancers, and shared overhead [20]. IBM has reported that Kubecost’s optimisation tools can help teams cut infrastructure costs by 30–50% or more [19].
Customisation options
Kubecost offers extensive customisation, allowing users to create dashboards tailored to their needs. Using Kubernetes-native concepts - such as clusters, namespaces, controllers, deployments, services, labels, pods, and containers - teams can filter and focus on specific areas, like a single team's namespace or the costs of a particular service [16][18].
For environments like on-premises or air-gapped systems, Kubecost supports custom pricing models. Users can manually set rates or upload CSV files, making it possible to integrate cost management into GitOps workflows [16][17][18].
Alerting precision
Kubecost’s alerting system helps teams stay on top of their budgets with a range of notification types:
- Budget alerts: Compare daily spending against pre-set thresholds.
- Spend change alerts: Flag sudden cost spikes by analysing historical trends.
- Efficiency alerts: Highlight inefficiencies when resource requests exceed actual usage.
- Recurring update alerts: Provide scheduled reports of usage and costs, broken down by namespace [18].
Alerts can be sent via Slack, email, or webhooks (e.g., PagerDuty), ensuring timely notifications [18]. The Kubecost team has emphasised the importance of these alerts:
Technical teams can far exceed their expense budget without even realizing it, while financial managers would only notice it after the fact.[18]
Multi-cloud support
Kubecost integrates seamlessly with AWS, Azure, GCP, and Alibaba Cloud [21]. However, full multi-cloud functionality - such as viewing all assets across accounts in a single dashboard - is available only in the Enterprise tier [21]. For Alibaba Cloud, Kubecost provides accurate list prices but does not yet offer complete billing integration [21].
On-premises and air-gapped Kubernetes clusters are also supported through custom pricing sheets and CSV uploads, ensuring visibility regardless of the infrastructure's location [16][17]. These features enhance Kubecost’s ability to adapt to diverse environments, making it a versatile tool for managing cloud and on-premises costs effectively.
Advantages and Disadvantages
After exploring the key features, let’s dive into the strengths and challenges of each platform to understand how they stack up.
Cloudability stands out for its strong financial governance tools, offering reliable forecasting and detailed business mapping capabilities [4][23]. On the downside, some users find its interface outdated and note slower updates compared to competitors [22]. Additionally, its rightsizing alerts can be overly frequent, particularly if specific resource types, like certain EBS tiers, aren’t excluded [6].
CloudZero takes a different approach by tying cloud spend directly to critical unit economics, such as cost per customer [23]. It ensures full cost allocation by using telemetry and usage data to fill gaps left by incomplete tagging. Its near real-time anomaly detection, especially during product launches, makes it a great fit for digital-native companies [6]. However, its pricing model - based on a percentage of analysed cloud spend (typically 0.3% to 1%) - can become expensive as data volumes grow. Additionally, while its AWS insights are comprehensive, its depth for Azure and GCP is reportedly less advanced [6].
Kubecost is tailored for containerised environments, offering detailed analytics that track costs down to the container, pod, namespace, and label levels [23]. Its optimisation tools can significantly cut infrastructure costs, sometimes by 30–50% or more [19]. It also provides an open-source version and supports on-premises and air-gapped Kubernetes clusters with custom pricing options [4][23]. However, its real-time estimates rely on public pricing lists, requiring manual integration of negotiated vendor discounts via APIs [24]. As a result, its focus is primarily on containerised setups [23].
It’s worth noting that all these platforms face a shared limitation: inherent data latency. Cloud providers only generate Cost and Usage Reports once daily [4]. This delay can be a challenge for organisations aiming for real-time insights. Gartner also highlights that 30–40% of cloud budgets are often wasted on underutilised or forgotten resources [1]. Weighing these trade-offs is essential for organisations to choose a platform that aligns with their technical needs and financial goals in managing cloud costs effectively.
Conclusion
Choose a dashboard that aligns with your team's goals while helping to manage costs effectively. For finance teams focused on predictability and governance, tools like Cloudability provide strong forecasting capabilities. On the other hand, engineering-driven organisations that link cloud spending to profitability can benefit from platforms like CloudZero, which connect costs to unit metrics like cost per customer. Containerised environments, meanwhile, are best served by Kubecost, offering detailed Kubernetes cost analytics.
The ideal dashboard should combine real-time anomaly detection with actionable insights. This is crucial because many teams fail to spot cost spikes within 24 hours [3], and a large portion of cloud budgets often goes to waste [1]. Real-time monitoring and automation can cut cloud expenses by as much as 30% [1].
To maximise efficiency, consider implementing three types of dashboards:
- Anomaly detection dashboards to identify cost spikes early.
- Customer-level cost tracking to monitor profitability.
- Team-specific dashboards to encourage accountability.
Alan Cox, CEO of Beakpoint Insights, puts it best:
You can't optimise what you can't see[3].
It's also essential to enforce tagging for teams, environments, and projects to prevent cost misallocation [1].
Don’t let the pursuit of perfect data hold you back. Dashboards with approximations can still provide valuable insights and can evolve over time. Connect technical metrics, like CPU usage, to business outcomes such as cost per transaction. This ensures your dashboards inform strategic decisions rather than simply reporting past expenses.
Whether you're a startup or a large organisation, the right dashboard can transform cost management from a reactive process to a proactive strategy. If you need tailored solutions, Hokstad Consulting offers expertise in optimising DevOps, cloud infrastructure, and hosting costs for all types of environments, from public to hybrid setups.
FAQs
How ‘real-time’ is real-time for cloud cost data?
Real-time cloud cost data refers to updates and anomaly detection that occur within minutes. This allows organisations to spot and tackle cost-related issues as they arise. The accuracy of this data is usually within a 10% margin, depending on the tools and techniques employed. These features empower businesses to act swiftly, helping them manage expenses more effectively and avoid unnecessary overspending.
What alerts should a cost dashboard send to avoid false alarms?
A cost dashboard should generate alerts when anomalies are detected, based on thresholds defined through historical data and statistical methods like machine learning or Z-score analysis. This approach reduces unnecessary alerts caused by typical fluctuations in cloud spending, ensuring notifications are reserved for genuinely significant deviations.
How do I allocate cloud costs when tagging is incomplete?
If tagging isn't fully implemented, consider other strategies like grouping resources or using account-based allocation methods. Performing regular audits can reveal unallocated resources and spot irregularities, which helps refine cost tracking and ensures better clarity. The key is to establish a well-organised system to monitor and allocate costs efficiently.