
Multi-cloud benchmarking helps businesses evaluate cloud providers by tracking metrics like latency, throughput, and cost per transaction. This process ensures better performance, cost efficiency, and flexibility across multiple providers. It also prevents vendor lock-in, improves business continuity during outages, and identifies cost-saving opportunities.
Here are 10 key metrics to focus on:
- Latency: Measures delays in data transfer; critical for real-time applications.
- Throughput: Tracks the amount of data or transactions processed per second.
- Error Rate: Monitors the percentage of failed requests to ensure reliability.
- CPU Utilisation: Evaluates how effectively processing power is used.
- Memory Utilisation: Tracks RAM usage to prevent slowdowns or crashes.
- Auto-Scaling Efficiency: Assesses how well resources scale to meet demand.
- Network I/O: Measures data transfer rates across networks.
- Disk I/O: Tracks storage read/write speeds to avoid bottlenecks.
- Availability: Ensures systems remain operational and accessible.
- Resource Utilisation: Balances resource use to avoid waste or underperformance.
Why it matters: By monitoring these metrics, you can reduce cloud costs by up to 40% while improving performance. Tools like PerfKit Benchmarker, OpenTelemetry, and native cloud monitoring solutions (e.g., AWS CloudWatch, Azure Monitor) make tracking these metrics manageable. For businesses, this means optimising cloud investments and maintaining seamless operations.
::: @figure 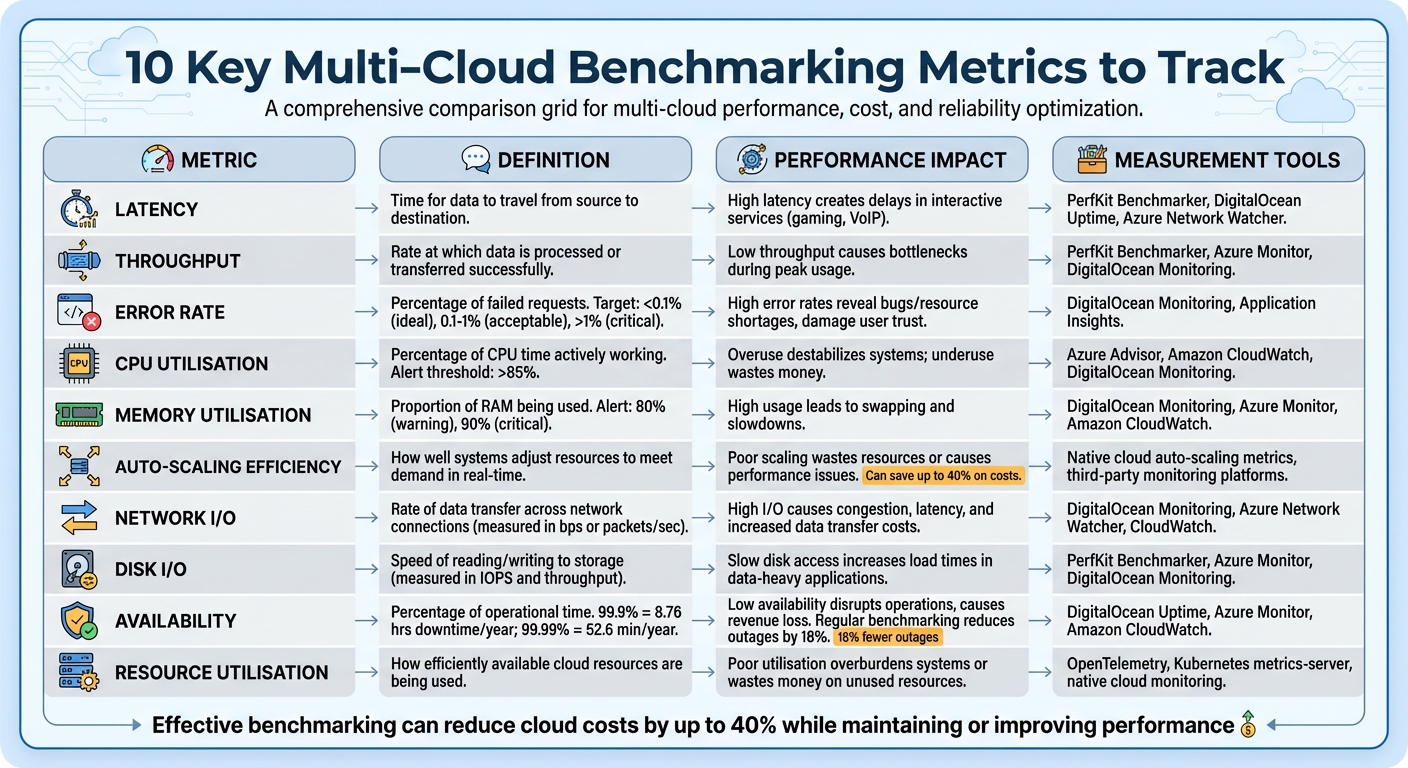 {10 Key Multi-Cloud Benchmarking Metrics: Definitions, Impact, and Measurement Tools}
:::
{10 Key Multi-Cloud Benchmarking Metrics: Definitions, Impact, and Measurement Tools}
:::
1. Latency
Definition of the metric
Latency refers to the delay in network communication - the time it takes for data to travel from its source to its destination [8][9]. This is often measured using two key metrics: RTT (Round-Trip Time), which tracks the total delay for a data packet to travel to its destination and back, and TTFB (Time to First Byte), which measures the time from initiating a connection to receiving the first byte of data. RTT is typically about twice the one-way latency [8][9]. These delays have a direct impact on how users perceive and interact with your application.
Impact on application performance
Latency plays a crucial role in how smoothly applications run, especially for services requiring real-time interaction like video conferencing or online gaming [3]. When latency is high, users experience slower responses, which can lead to frustration. This can hurt conversion rates, reduce the efficiency of customer support, and ultimately impact revenue [12].
It’s important to note that high bandwidth doesn’t necessarily mean low latency. As AWS has pointed out, Latency can reduce the return on investment in expensive, high-bandwidth infrastructure
[8]. For example, fibre-optic cables add approximately 4.9 microseconds of latency for every kilometre of distance [8].
Relevance in multi-cloud environments
Latency becomes even more complex in multi-cloud setups. The distance between data centres from different cloud providers, the number of network hops, and delays at Internet Exchange Points (IXPs) where networks connect all contribute to increased latency [8][9].
For latency-sensitive applications, it’s best to host them within the same Availability Zone to minimise delays [12]. Cross-cloud solutions like Google Cross-Cloud Interconnect are designed to provide reliable, low-latency links between different cloud providers [13]. Similarly, AWS Global Accelerator can optimise network paths, reducing latency and jitter, and improving user traffic performance by up to 60% [8].
Tools or methods to measure the metric
To measure latency effectively, synthetic testing is a common method. It simulates performance and is quicker to set up than full-scale load tests [4]. However, for accurate results, it’s essential to pre-warm
test environments for 10–15 minutes. This helps stabilise caches and ensures consistent data [4][12]. Repeating benchmarks over time is also necessary to capture any performance fluctuations [4].
When benchmarking latency across multiple cloud providers, tools like PerfKitBenchmarker can simplify the process by offering unified commands, reducing complexity in multi-cloud environments [14]. Monitoring latency on a per-region and per-cloud basis, rather than aggregating results, helps identify specific issues tied to a particular provider or geographic location [16]. Setting real-time alerts for response times exceeding 400ms or increasing by 50% can help maintain performance standards [12].
For microservices architectures, distributed tracing tools such as OpenTelemetry are invaluable. They map the flow of requests across various cloud services, helping pinpoint where delays occur [12][10].
Measuring and optimizing cloud performance isn't just about keeping systems running smoothly - it's about ensuring you're getting maximum value from every dollar spent[11].
2. Throughput
Definition of the Metric
Throughput refers to the amount of data or transactions a system processes in a set period. In application benchmarking, it’s the count of transactions or API requests handled per second. For storage systems and databases, it’s the volume of data read or written within a specific timeframe. This metric is often expressed in units like bits per second (bps), kilobytes per second (KBps), megabytes per second (MBps), or gigabytes per second (GBps). Performance can also be measured using metrics such as Requests Per Minute (RPM) or operations per second (ops/sec).
Impact on Application Performance
Throughput plays a key role in determining how many users a system can accommodate simultaneously and the number of transactions it can process during peak times. Systems with high throughput and low latency are not only quick but also efficient. In contrast, low throughput paired with high latency can cause bottlenecks and poor performance. The financial implications are notable - unclear performance tracking can waste up to 32% of cloud budgets, and ongoing slowdowns may reduce productivity by as much as 20% [12]. Boosting throughput ensures systems can handle more workload without requiring additional resources, which improves cost efficiency.
Relevance in Multi-Cloud Environments
In multi-cloud configurations, throughput is essential for identifying network communication bottlenecks between different cloud regions or providers. It helps organisations determine whether they are overspending on resources or under-provisioning, which can harm performance. By benchmarking throughput across various cloud environments, organisations can gather actionable data to optimise resources or justify adopting new features.
Benchmarking is a systematic process of evaluating the performance and value of cloud services using efficiency metrics, either within an organisation or against industry peers.
– FinOps Foundation [12]
Tools or Methods to Measure Throughput
Start with a 10–15 minute warm-up period to stabilise caches, followed by a one-hour steady-state test to gather consistent data. Burst tests can also be run to assess how the system handles spikes in demand. When comparing clouds, using default benchmark settings ensures a fair comparison across platforms, avoiding platform-specific optimisations that could skew results [15].
Tools like PerfKitBenchmarker (PKB) streamline multi-cloud benchmarking by offering unified commands for platforms such as GCP, AWS, Azure, and DigitalOcean [14]. At the application level, code instrumentation combined with Application Performance Monitoring (APM) tools or frameworks like OpenTelemetry can capture throughput metrics directly from the application [10]. Monitoring Requests Per Minute (RPM) helps identify peak usage periods, aiding in resource scaling decisions [16]. Additionally, calculating a Throughput Efficiency Index - by dividing total throughput by the number of CPU cores in use - can reveal how effectively resources are being utilised. Separating throughput data for production and non-production environments ensures that test data doesn’t distort performance baselines [17][10].
With throughput evaluated, the next metric - error rate - provides further insights into the system’s reliability.
3. Error Rate
Definition of the Metric
Error rate measures the percentage of failed requests out of the total processed. In benchmarking, this metric provides insights into system stability under both regular and peak loads. It helps pinpoint the moment when your infrastructure begins to falter [12]. Failures can stem from various sources, including database queries, external API calls, or user transactions [10]. Understanding this metric is key to evaluating its impact on user experience and system reliability.
Impact on Application Performance
For cloud applications, maintaining error rates below 0.1% is ideal. Rates between 0.1% and 1% are generally acceptable in testing scenarios [12]. However, anything above 1% or a consistent upward trend signals the need for immediate attention [12]. Elevated error rates often point to issues like software bugs, misconfigured servers, insufficient resources, or service quota limits [26,4]. If left unchecked, persistent high error rates can reduce productivity by as much as 20% [12]. Detecting and addressing these problems early is critical to preserving user trust and ensuring smooth service delivery [27,4]. Especially in multi-cloud setups, monitoring error rates becomes a necessity to maintain system performance.
Relevance in Multi-Cloud Environments
Error rate, alongside latency and throughput, is a key metric for evaluating cloud reliability. In multi-cloud deployments, keeping an eye on error rates is crucial to ensure consistent operations. Each cloud provider may exhibit unique failure patterns due to factors like service outages, incorrect cross-cloud configurations, or regional latency issues [16]. By isolating error rate data for each provider, you can identify underperforming environments and make informed decisions about workload distribution [3]. Separating error rate metrics for production and non-production environments also prevents test activities from skewing performance benchmarks [10].
Tools or Methods to Measure Error Rate
Measuring error rates in multi-cloud environments requires robust tools and methodologies. The RED Method (Rate, Errors, Duration) is a widely used framework for monitoring cloud applications, with error tracking as a core component [16]. OpenTelemetry has become the go-to standard for multi-cloud observability, enabling you to instrument applications once and send telemetry data to various backends without being tied to a single vendor [20]. For microservices-heavy architectures, distributed tracing can map requests across services, making it easier to identify failure points [10]. Structured logging with key-value pairs and unique correlation IDs for each transaction simplifies log analysis across different clouds [10]. Additionally, set up multi-level alerts that activate when error rates surpass historical norms, and segment these alerts by region to quickly identify provider-specific issues [21,13].
4. CPU Utilisation
Definition of the Metric
CPU utilisation refers to the percentage of time a central processing unit (CPU) is actively working on tasks within a set timeframe [3]. In containerised environments like Kubernetes, CPU is measured in cpu
units. Here, 1.0 CPU represents one physical or virtual core (vCPU/vCore), depending on the cloud provider [22][23]. For example, a fractional request like 250m (milliCPU) equates to 0.25 of a core [22][23]. It’s important to distinguish between requests (minimum guaranteed CPU) and limits (maximum allowed CPU). If CPU usage exceeds the defined limit, throttling occurs [22].
Impact on Application Performance
When CPU utilisation exceeds 85%, systems can experience strain, resulting in slower response times or even timeouts [12][3]. High CPU usage may also push systems to rely on slower disk-based storage, further affecting performance [3]. Monitoring the CPU queue length - the number of processes waiting for CPU time - can help identify bottlenecks, especially during periods of high latency [10]. Striking the right balance is key: over-provisioning wastes money, while under-provisioning risks system instability [12]. By adopting effective benchmarking practices, organisations can save up to 40% on costs while maintaining or improving performance [11].
Relevance in Multi-Cloud Environments
In multi-cloud setups, CPU metrics are essential for identifying whether resources are over-provisioned, leading to unnecessary expenses, or under-provisioned, causing delays [12][3]. Different cloud providers may use varying terms, such as Azure vCores, GCP Cores, or Oracle OCPUs, but the core concept remains consistent [17][23]. For reliable benchmarking, sampling operating system performance counters at least every minute is recommended [10]. Centralising CPU data from multiple cloud providers into a unified metrics platform provides a clear, overall view of your infrastructure [10]. Additionally, keeping an eye on limit utilisation
metrics is critical - values exceeding 1.0 (100%) indicate a container is attempting to use more CPU than its limit, which can degrade performance [21][22]. This level of visibility helps in choosing the right monitoring tools, as outlined below.
Tools or Methods to Measure CPU Utilisation
Several tools can help measure and monitor CPU utilisation effectively. PerfKit Benchmarker (PKB) is an open-source tool designed to compare CPU performance across providers like GCP, AWS, Azure, and DigitalOcean. It uses standard benchmarks such as CoreMark and SPEC CPU2006 [15][14]. Cloud-native monitoring tools like CloudWatch, Azure Monitor, and Google Cloud Monitoring offer real-time insights into CPU usage [21]. Additionally, Application Performance Monitoring (APM) tools can trace individual transactions to identify code paths responsible for excessive CPU consumption [18]. To ensure accurate results, pre-warm your testing environment and run multiple benchmarks to account for performance fluctuations [4].
5. Memory Utilisation
Definition of the Metric
Memory utilisation refers to the percentage of available RAM being consumed by your cloud workloads [24][27]. In containerised setups like Kubernetes, memory is generally measured in bytes (MB or GB). Each container is assigned specific requests (the minimum memory guaranteed) and limits (the maximum memory allowed). If a container exceeds its memory limit, the platform terminates it with an OOMKilled
event [16]. Let’s look at how high memory usage can directly impact application performance.
Impact on Application Performance
When memory utilisation consistently exceeds 90%, it poses a serious threat to system performance [12]. Once memory is exhausted, applications are forced to use swap space - essentially using disk storage to handle data that should be in RAM. This process significantly slows down responsiveness [24][3]. Excessive memory consumption also increases I/O operations, which can make applications sluggish and, in extreme cases, lead to complete shutdowns [3][16].
Relevance in Multi-Cloud Environments
Just like latency and CPU utilisation, monitoring memory usage is critical when benchmarking performance across multiple cloud providers. Comparing memory performance on platforms like AWS, Azure, and GCP helps determine which is better suited for specific workloads [25]. Metrics vary depending on the workload and environment. For instance, Linux EC2 instances track mem\_used\_percent
, while Windows instances use Memory % Committed Bytes In Use
and Memory Available Mbytes
[26]. In Kubernetes, metrics like node\_memory\_utilization
and pod\_memory\_utilization
are key [26]. Having a unified view across providers ensures that Service Level Objectives (SLOs) are met, regardless of the infrastructure [27]. This visibility is crucial for identifying cases of over-provisioning (leading to unnecessary costs) or under-provisioning (causing performance issues) in complex cloud environments [27][28].
Tools or Methods to Measure Memory Utilisation
There are several tools available to monitor memory usage. Native tools like AWS CloudWatch, Azure Monitor, and Google Cloud Operations Suite provide platform-specific monitoring but can lead to data silos in multi-cloud setups [16][25]. Centralised tools such as Grafana, Prometheus, and Datadog allow for unified monitoring across different platforms [25]. For benchmarking, PerfKit Benchmarker (PKB) can run workloads like memtier\_benchmark
to compare memory performance across providers such as GCP, AWS, Azure, and DigitalOcean [15]. Monitoring swap usage is especially useful for identifying when additional memory scaling is needed [24]. Setting alerts for when memory usage exceeds 80% (as a warning) or 90% (as critical) can help prevent crashes and maintain system stability [12].
6. Auto-Scaling Efficiency
What Is Auto-Scaling Efficiency?
Auto-scaling efficiency refers to how well your cloud infrastructure adjusts resources in real time to meet demand while keeping costs under control [29][1]. It’s all about finding that sweet spot: scaling up during busy periods to maintain performance and scaling down during quieter times to avoid wasting money [29]. Done right, it prevents underprovisioning, which can lead to delays and frustrated users, and overprovisioning, which unnecessarily eats into your budget [29][12][11]. The key is choosing the right trigger metrics. For instance, a video transcoding app should rely on queue depth for scaling decisions rather than CPU usage, as CPUs are expected to run at full capacity during processing [29].
Why It Matters for Application Performance
Auto-scaling efficiency is essential for ensuring your application runs smoothly without overspending. When scaling isn’t handled properly, it can lead to two main problems. First, underprovisioning - where resources fall short during peak times - causes delays and resource bottlenecks [29][12]. Second, overprovisioning results in idle resources that still rack up costs without adding any value [12][1]. Companies that adopt effective auto-scaling strategies often save up to 40% on costs while maintaining or even enhancing application performance [11].
The Challenge in Multi-Cloud Setups
Running workloads across multiple cloud platforms - like AWS, Azure, and Google Cloud - introduces a whole new level of complexity [31][1]. Each provider has its own monitoring tools and billing models, making it tough to get a unified view of scaling performance [30]. To overcome this, organisations need to normalise metrics like CPU usage, memory, and throughput across all platforms. This helps maintain consistency and avoid being locked into vendor-specific scaling approaches [30][1].
Many organisations find that as their cloud grows, staff can't keep up with the sheer volume of information and the complexity of running production workloads across multiple clouds.
Using automated scaling solutions with centralised visibility ensures that Service Level Objectives (SLOs) are met, no matter which cloud provider is involved.
How to Measure and Improve Auto-Scaling Efficiency
Native tools like AWS CloudWatch and Azure Monitor are great for single-platform monitoring but fall short in multi-cloud environments. That’s where third-party Application Performance Management (APM) tools come in, offering cross-platform compatibility and unified analytics [16]. There are several scaling approaches to consider:
- Target-tracking scaling: Adjusts resources based on a predefined metric, like maintaining CPU usage at a specific threshold.
- Predictive scaling: Uses historical data to anticipate demand and scale resources proactively.
- Schedule-based scaling: Allocates resources based on expected workload patterns, such as peak business hours [32][31].
For batch processing tasks, queue depth is a more reliable scaling metric than CPU usage [31]. Setting buffer limits and maximum instance counts can also help prevent unexpected cost spikes [11]. Implementing automated “guardrails” to correct scaling issues proactively - rather than relying on manual alerts - ensures optimal performance and cost management [1].
At Hokstad Consulting, we specialise in helping businesses fine-tune their auto-scaling strategies. By leveraging benchmarking data and refining multi-cloud performance, we help companies reduce costs by 30–50% while maintaining top-notch application performance.
7. Network I/O
Definition of the Metric
Network I/O refers to the rate at which data is transmitted across a network connection. It's typically measured in bits per second (bps) or packets per second. Unlike application throughput, Network I/O specifically focuses on the data transfer rates and the available capacity of the network [3][33].
Impact on Application Performance
Network performance plays a pivotal role in how responsive real-time applications appear to users. When network utilisation is high, it can lead to congestion, increased latency, and packet loss, all of which can severely impact performance [3]. For applications that rely heavily on data transfer, network throughput often becomes the main bottleneck [3].
The Transmission Control Protocol (TCP) can exacerbate this issue by introducing wait states.
TCP relies on acknowledgements for received data before sending more, which can limit effective throughput, especially when latency is high [37]. Even a small packet loss - just 1% - can disrupt real-time services like VoIP or video conferencing. Packet losses exceeding 3% are a clear indicator of poor network conditions [37].
The network is responsible for the connectivity between application components, cloud services, edge networks, and on-premises data, and therefore it can heavily impact workload performance.– AWS Well-Architected Framework [34]
Relevance in Multi-Cloud Environments
In multi-cloud setups, Network I/O becomes even more critical as data frequently moves between different cloud providers, on-premises data centres, and edge locations [34]. Performance in these environments depends on factors like inter-cloud connectivity options (e.g., AWS Direct Connect or Google Cloud Interconnect), virtual machine egress limits, and routing configurations [33][34].
Common challenges include routing all traffic through an on-premises firewall, which can create unnecessary detours (known as hair-pinning
), and the added overhead from stateful security rules or VPN tunnel encryption [34][39]. These issues can significantly affect application performance if not addressed.
Tools or Methods to Measure the Metric
To assess throughput, tools like iperf3 work well for single-CPU systems, while Netperf is better suited for multi-CPU environments where CPU limitations may skew results [33]. When benchmarking across regions, using 4–10 parallel streams can help achieve maximum throughput [33][35]. It's also essential to monitor CPU usage during these tests with tools like top or htop to ensure accurate results [33][35].
For multi-cloud environments, PerfKit Benchmarker simplifies the process of setting up and tearing down virtual infrastructure across different cloud providers, enabling consistent performance measurements [40]. For example, Google Cloud's n2-standard-64 VM instances can achieve up to 75 Gbps of egress bandwidth when Tier 1 networking is enabled. However, to avoid packet fragmentation, the Maximum Transmission Unit (MTU) must be set to 8896 [36][38]. These tools and configurations are essential for reliable and consistent network performance evaluations across diverse cloud environments.
8. Disk I/O
Definition of the Metric
Disk I/O refers to the speed at which data is read from or written to a storage device. It's typically measured in two ways: IOPS (input/output operations per second) and throughput (the total amount of data transferred over time). Think of IOPS as the number of cars passing a checkpoint on a motorway, while throughput is like the total weight of goods those cars are transporting in a given timeframe [41]. Understanding Disk I/O plays a key role in multi-cloud benchmarking, just like other performance metrics.
Impact on Application Performance
When the demand for disk I/O exceeds what the system can handle, applications can run into serious trouble. This can lead to queuing, longer response times, and even system instability [3]. High queue lengths - essentially the number of operations waiting to be processed - are a red flag, signalling that the storage system is struggling to keep up [45]. The fallout from this can be severe: errors, application timeouts, and even cloud providers stepping in to disable I/O operations if they detect inconsistencies. In extreme cases, this overload might block connections entirely and put data at risk [45].
Focusing solely on one metric at the expense of the other can lead to poor performance and user experience.– Buffalo Americas [41]
Relevance in Multi-Cloud Environments
Disk I/O is a crucial metric for understanding storage performance in multi-cloud setups. Variations in disk I/O performance across providers can directly impact how responsive applications are. Just like with latency or CPU usage, these differences are critical when evaluating multi-cloud performance. Cloud providers offer a range of storage tiers, each with unique performance features. For example, premium options like Google Cloud's Hyperdisk Extreme or Azure Premium SSDs can achieve sub-millisecond latencies [43]. To illustrate, an Azure Standard_D8ds_v4 VM can hit a maximum write IOPS of 12,800 and a read IOPS of 77,000 when host caching is enabled [42]. However, regional storage, which replicates data across multiple zones, often sacrifices write throughput due to the overhead of replication [43].
Tools or Methods to Measure the Metric
For measuring Disk I/O, the tools you use depend on your environment. DiskSpd is the go-to tool for Windows systems, especially for simulating SQL Server workloads [42][44]. On the other hand, fio (Flexible I/O Tester) is widely regarded as the industry standard for cross-platform benchmarking. Its creator, Jens Axboe, explained its purpose:
Fio was originally written to save me the hassle of writing special test case programs when I wanted to test a specific workload... I needed a tool that would be able to simulate specific I/O workloads without custom coding[46].
When benchmarking SSD-backed volumes, it's recommended to set a queue length of one for every 500–1,000 IOPS [44][45]. And before running read benchmarks on systems with caching enabled, make sure to warm up the cache first. This step ensures the results reflect actual storage performance, rather than the initial transfer from disk to cache [42].
9. Availability
Definition of the Metric
Availability refers to the percentage of time a service remains operational within a specific period, such as a month or year [47][49]. In today's distributed systems, partial failures are common, where only certain users, locations, or requests are impacted [48]. A more accurate way to calculate availability in cloud environments is by measuring the fraction of successful work units (like HTTP requests). For example, if 99,500 out of 100,000 requests are successful, the availability rate is 99.5% [47][48].
This metric is often expressed in terms of nines.
For instance, 99.9% availability (three nines) allows for 8.76 hours of downtime annually, while 99.99% availability (four nines) limits downtime to just 52.6 minutes [47]. If a service response exceeds the client timeout, it’s considered unavailable from the user's perspective, linking latency directly to availability [48]. This connection underscores how performance issues can significantly affect user experience.
Impact on Application Performance
Availability plays a vital role in determining a platform's reliability. Even the most feature-rich service loses its value if it’s unavailable when users need it, leading to potential revenue loss and reputational damage [49]. Cloud data centres can experience performance fluctuations of up to 30% during peak times, highlighting the need for consistent benchmarking to ensure vendor Service Level Agreements (SLAs) are met [50]. Companies that regularly assess their infrastructure report 18% fewer outages and a 25% faster release cycle [50]. Additionally, resilient system architectures can reduce unplanned downtime by as much as 40% annually [50].
Relevance in Multi-Cloud Environments
Availability takes on added complexity in multi-cloud setups, where workloads must remain operational across various Cloud Service Providers. By leveraging physical fault isolation boundaries, organisations can minimise the risk of a single provider or region failure [5]. Just as latency and error rates are critical in multi-cloud benchmarking, availability is essential to ensure uninterrupted service across platforms. For example, Google Cloud's n1-standard series shows up to 15% CPU performance variation across regions, while AWS t-series instances exhibit I/O differences of up to 12% between availability zones [50]. To ensure resilience, it’s crucial to supplement vendor-provided metrics with custom failover and stress tests [50].
Tools or Methods to Measure the Metric
Measuring availability requires a combination of server-side and client-side approaches. Server-side metrics, gathered through internal monitoring tools, can miss instances where clients cannot access the service due to network problems [48]. To address this, canaries - software agents that mimic user traffic - can be deployed to capture metrics from the client’s perspective [48][19].
For multi-cloud observability, OpenTelemetry has become a widely adopted standard. It enables the collection of logs, metrics, and traces using a vendor-neutral protocol [20]. Additionally, distributed tracing can follow requests through multiple services, helping identify bottlenecks and latency issues that may affect perceived availability [10][18]. These tools and methods allow organisations to proactively detect potential outages and strengthen their multi-cloud strategies.
10. Resource Utilisation
What Is Resource Utilisation?
Resource utilisation measures how much of your available cloud resources are actively being used [16]. It’s a key indicator of infrastructure health and plays a big role in capacity planning. In well-managed multi-cloud setups, organisations define an ideal state
where resources are balanced between cost and performance. Governance policies are then used to track and address any deviations from this ideal [1].
Each type of resource - CPU, memory, disk I/O, and network I/O - needs to align with specific cost and performance goals. Misalignment can lead to two major issues: over-provisioning, where you’re paying for unused resources, or under-provisioning, which can hurt performance.
How It Affects Application Performance
When utilisation consistently runs high - say, above 85% for CPU or 90% for memory - it’s a red flag. High usage can strain the system, increasing latency and risking instability. For instance, if memory is maxed out, Kubernetes might trigger OOM (Out of Memory) kills, abruptly shutting down applications. On the flip side, low utilisation suggests you’re paying for capacity you don’t need.
Looking at historical data can help identify patterns and adjust resources before issues arise. Take Segment as an example: in 2021, they fine-tuned their resource tracking and improved their profit margins by 20% [1]. This shows how closely monitoring resource utilisation can directly impact financial performance.
Why It Matters in Multi-Cloud Environments
Managing resource utilisation becomes even trickier in multi-cloud setups. Native tools like AWS CloudWatch or Azure Monitor are designed to work within their own ecosystems, so tracking resources across multiple clouds can be a challenge. That’s where third-party performance monitoring tools come in handy. These tools consolidate metrics into a single view, making it easier to manage resources across different platforms.
Advanced tracking can also connect cloud usage metrics, like cost per transaction, to broader business outcomes. A strong tagging strategy is another helpful practice - it lets you pinpoint teams or applications that consistently underuse their allocated resources [1].
Tools and Techniques for Tracking Resource Utilisation
To get a unified view of resource metrics across clouds, tools like OpenTelemetry (OTel) are invaluable. OTel has become a go-to solution for multi-cloud observability, allowing organisations to gather logs, metrics, and traces without needing to alter application code [20].
In containerised setups, Kubernetes uses tools like the metrics-server and kubelet, often paired with cAdvisor, to provide detailed CPU and memory stats at the pod and container levels.
By instrumenting your applications using OTel, you remove the need to replace this instrumentation at the application layer in the future... This turns part of your observability solution into a two-way door[20].
To optimise resource usage, set threshold alerts for critical metrics (e.g., CPU above 85%, memory above 90%) and automate shutdowns for idle development and testing resources. These strategies can significantly cut unnecessary costs.
Hokstad Consulting leverages these methods to help organisations optimise resource utilisation across multi-cloud environments, ensuring a careful balance between performance and cost efficiency.
Solving the Issue of Mysterious Database Benchmarking Results
Comparison Table
Here’s a quick overview of ten key metrics, what they mean, how they impact performance, and the tools you can use to measure them.
| Metric | Definition | Performance Impact | Measurement Tools |
|---|---|---|---|
| 1. Latency | Time it takes for a data packet to travel from source to destination [3]. | High latency creates delays, especially noticeable in interactive services like gaming or VoIP [3]. | PerfKit Benchmarker [51], DigitalOcean Uptime [3], Azure Network Watcher [12] |
| 2. Throughput | The rate at which data is processed or transferred successfully [51]. | Low throughput slows data flow and causes bottlenecks, especially during peak usage [3][12]. | PerfKit Benchmarker [51], Azure Monitor [12], DigitalOcean Monitoring [3] |
| 3. Error Rate | Percentage of requests that fail or result in errors [3]. | High error rates reveal bugs or resource shortages, potentially damaging user trust [3]. | DigitalOcean Monitoring [3], Application Insights [12] |
| 4. CPU Utilisation | Percentage of time the CPU is actively handling tasks [3]. | Overuse can destabilise systems and slow responses, while underuse wastes money [3][24]. | Azure Advisor [2], Amazon CloudWatch [24], DigitalOcean Monitoring [3] |
| 5. Memory Utilisation | The proportion of RAM being used by applications [3]. | High usage can lead to swapping, which slows performance. Balancing usage is key to avoiding waste [3][24]. | DigitalOcean Monitoring [3], Azure Monitor [12], Amazon CloudWatch [24] |
| 6. Auto-Scaling Efficiency | How well your system adjusts to changes in demand. | Poor auto-scaling wastes resources during low demand or causes issues during spikes. | Native cloud auto-scaling metrics, third-party monitoring platforms |
| 7. Network I/O | The rate of data transfer across a network or connection [3]. | High I/O can cause congestion and latency, with data transfer fees adding hidden costs [3][6]. | DigitalOcean Monitoring [3], Azure Network Watcher [12], CloudWatch [24] |
| 8. Disk I/O | Speed of reading from or writing to storage devices [3]. | Slow disk access hampers data-heavy apps, increasing load times and costs if IOPS thresholds are exceeded [12]. | PerfKit Benchmarker [51], Azure Monitor [12], DigitalOcean Monitoring [3] |
| 9. Availability | The percentage of time a system is operational and accessible [1]. | Low availability disrupts operations, leading to lost revenue and unhappy users [3][24]. | DigitalOcean Uptime [3], Azure Monitor [12], Amazon CloudWatch [24] |
| 10. Resource Utilisation | Tracks how efficiently cloud resources are being used. | Poor utilisation can overburden systems or waste money on unused resources. | OpenTelemetry, Kubernetes metrics-server, native cloud monitoring tools |
By keeping these metrics in focus, you can align your multi-cloud benchmarking efforts with better performance outcomes.
For consistent benchmarking across platforms, PerfKit Benchmarker offers unified commands. If you’re looking for expert help, Hokstad Consulting can guide you in selecting the right tools to streamline multi-cloud monitoring. This unified strategy ensures that your infrastructure performs at its best.
Conclusion
The metrics we’ve explored offer a solid foundation for achieving peak cloud performance. By keeping a close eye on these ten metrics, organisations can strike the right balance between performance, cost, and scalability. Without proper benchmarking, there’s a real risk of overprovisioning resources or running into performance bottlenecks. As Cody Slingerland, FinOps Certified Practitioner, aptly says:
You can't fix what you don't measure[24].
Effective benchmarking doesn’t just save money - it can lead to up to 40% cost reductions while maintaining or even improving performance [11]. Real-world examples show how benchmarking can significantly boost margins by refining resource allocation, streamlining code, and optimising availability zone strategies [1].
The spotlight is now shifting from overall cloud expenditure to unit economics - metrics like cost per active user or per transaction [7][1]. Tying these metrics directly to business outcomes allows organisations to make smarter, data-driven decisions. This approach also connects cloud metrics to critical financial indicators like Cost of Goods Sold (COGS) and gross margins, making it easier to justify optimisation efforts to stakeholders.
For those looking to take their cloud performance to the next level, Hokstad Consulting offers tailored solutions in cloud cost engineering and DevOps transformation. With expertise in multi-cloud monitoring, resource right-sizing, and automated governance, their team helps businesses cut cloud expenses by 30–50%. They guide organisations in setting up reliable benchmarks, choosing the right tools, and creating a sustainable strategy for managing cloud performance effectively.
FAQs
What are the best ways to monitor latency across multiple cloud platforms?
Monitoring latency in multi-cloud setups calls for tools that can provide a clear view across multiple providers. You have two main options: specialised platforms or open-source tools.
Some SaaS solutions stand out by continuously tracking latency trends and detecting potential outages. They offer a centralised dashboard, giving you a complete picture of performance across all your cloud services.
On the open-source side, tools like PerfKitBenchmarker let you conduct standardised latency tests across providers, making it easier to compare performance. You can also deploy monitoring agents like Prometheus directly on your workloads. These agents gather latency metrics, which you can then visualise and analyse using platforms like Grafana. This combination of tools ensures you have real-time, actionable insights into your cloud performance.
By blending these strategies, you can effectively monitor latency and maintain smooth operations across your multi-cloud environment.
What’s the best way to ensure efficient auto-scaling across multiple cloud platforms?
To manage auto-scaling effectively in a multi-cloud setup, businesses need to adopt unified, metric-driven scaling policies. These policies help maintain consistency across different cloud platforms while being flexible enough to handle fluctuating workloads.
Another essential component is using a centralised multi-cloud management tool. Such tools automate scaling processes and provide real-time visibility into critical metrics like latency, throughput, and resource usage. By keeping a close eye on these metrics, businesses can fine-tune performance and control costs across their cloud providers.
Why is it important to monitor error rates in multi-cloud environments?
Keeping a close eye on error rates in multi-cloud environments is essential for ensuring your services remain reliable. Tracking these errors allows you to swiftly pinpoint and address problems that could compromise availability or disrupt the user experience across various cloud platforms.
Monitoring error rates also helps teams uphold consistent performance standards, ensuring applications run smoothly no matter the infrastructure. By tackling errors early, you can reduce downtime and improve overall operational efficiency.