Cloud data transfer costs can silently inflate your cloud bills. These charges come from moving data outside a provider's network, between regions, or even within availability zones. They often account for 15–70% of cloud expenses, depending on the scale of operations. Without proper monitoring, costs can spiral due to misconfigurations, inefficient routing, or unexpected traffic spikes.
Key Points:
- Costs Breakdown: Outbound data transfers (egress) are charged, with rates ranging from £0.04 to £0.19 per GB, while inbound transfers are free.
- Types of Transfers:
- Internet Egress: Typically the most expensive, with rates around £0.075 per GB.
- Inter-region Transfers: Lower costs (~£0.016 per GB), but intercontinental transfers can be higher.
- Inter-Availability Zone Transfers: Less costly (~£0.008 per GB per direction) but can add up.
- Factors Influencing Costs: Data volume, geography, and hidden fees like NAT Gateway charges.
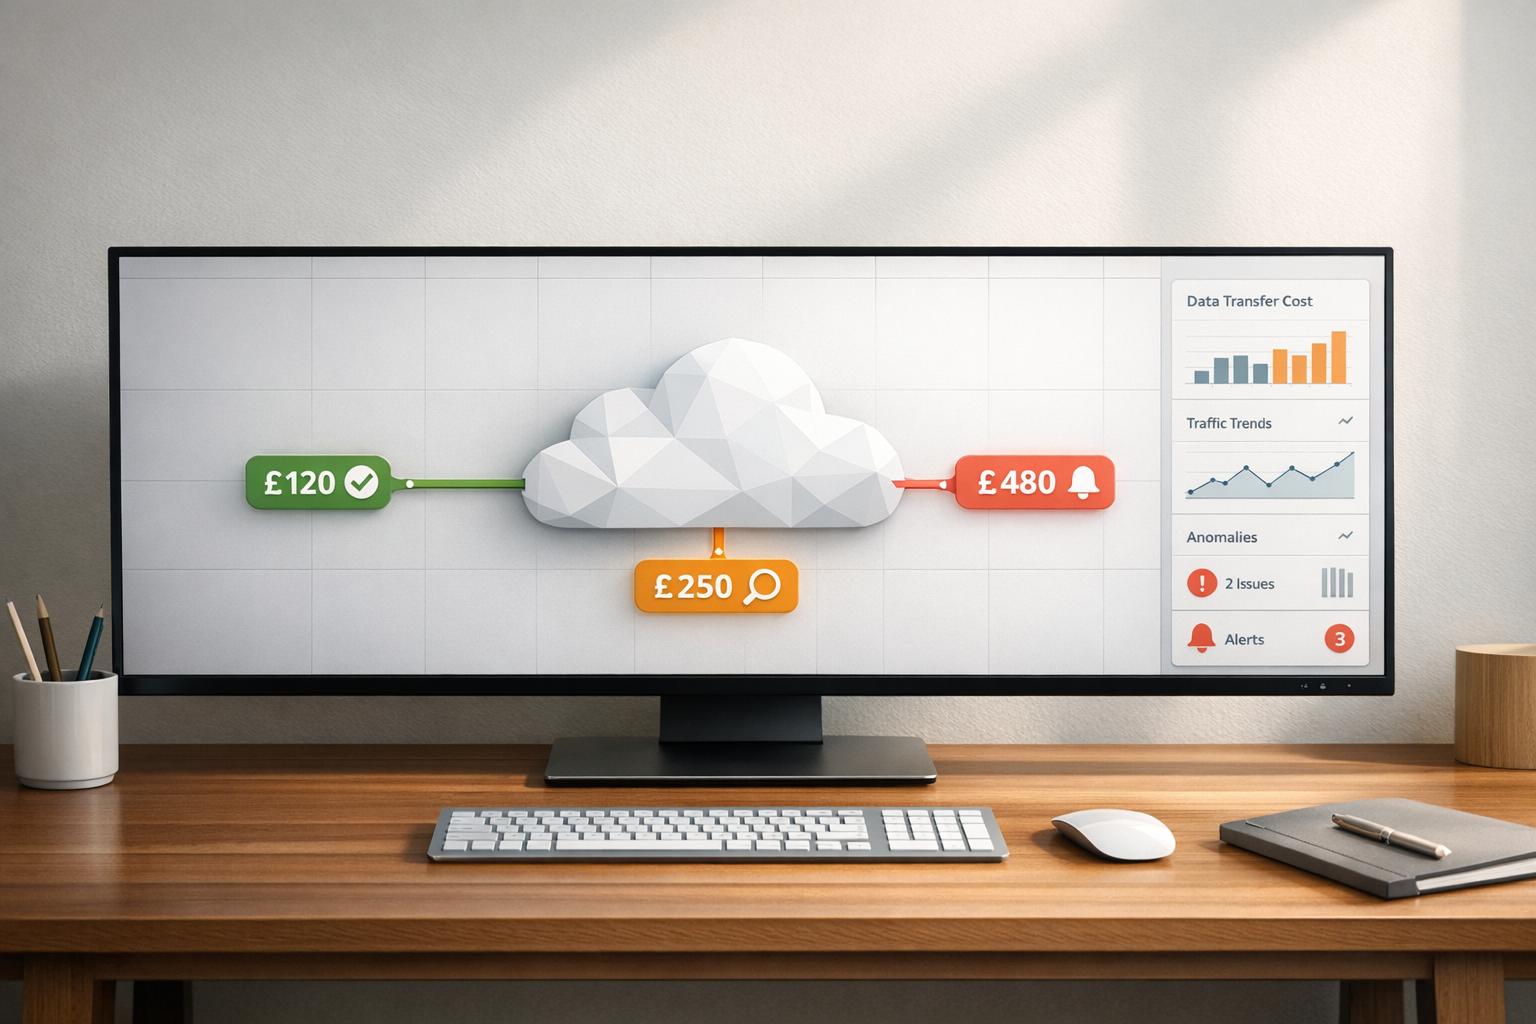
- Monitoring Tools:
- AWS Cost Explorer: Tracks historical and forecasted costs.
- Google Cloud Billing Reports: Offers insights by SKU and region.
- Third-Party Tools: Datadog and Grafana Cloud provide unified views for multi-cloud setups.
- Avoid Common Pitfalls: Misconfigured NAT Gateways, unmonitored cross-AZ traffic, and using public IPs for internal communication can inflate costs.
Solution: Use monitoring tools, enable alerts for cost spikes, and optimise data routing. Tag resources for better cost attribution and avoid unnecessary data transfers. For expert help, companies like Hokstad Consulting can analyse and reduce costs effectively.
AWS Supports You | Monitoring and Optimizing Your Data Transfer Costs
Need help optimizing your cloud costs?
Get expert advice on how to reduce your cloud expenses without sacrificing performance.
Understanding Cloud Data Transfer Costs
::: @figure 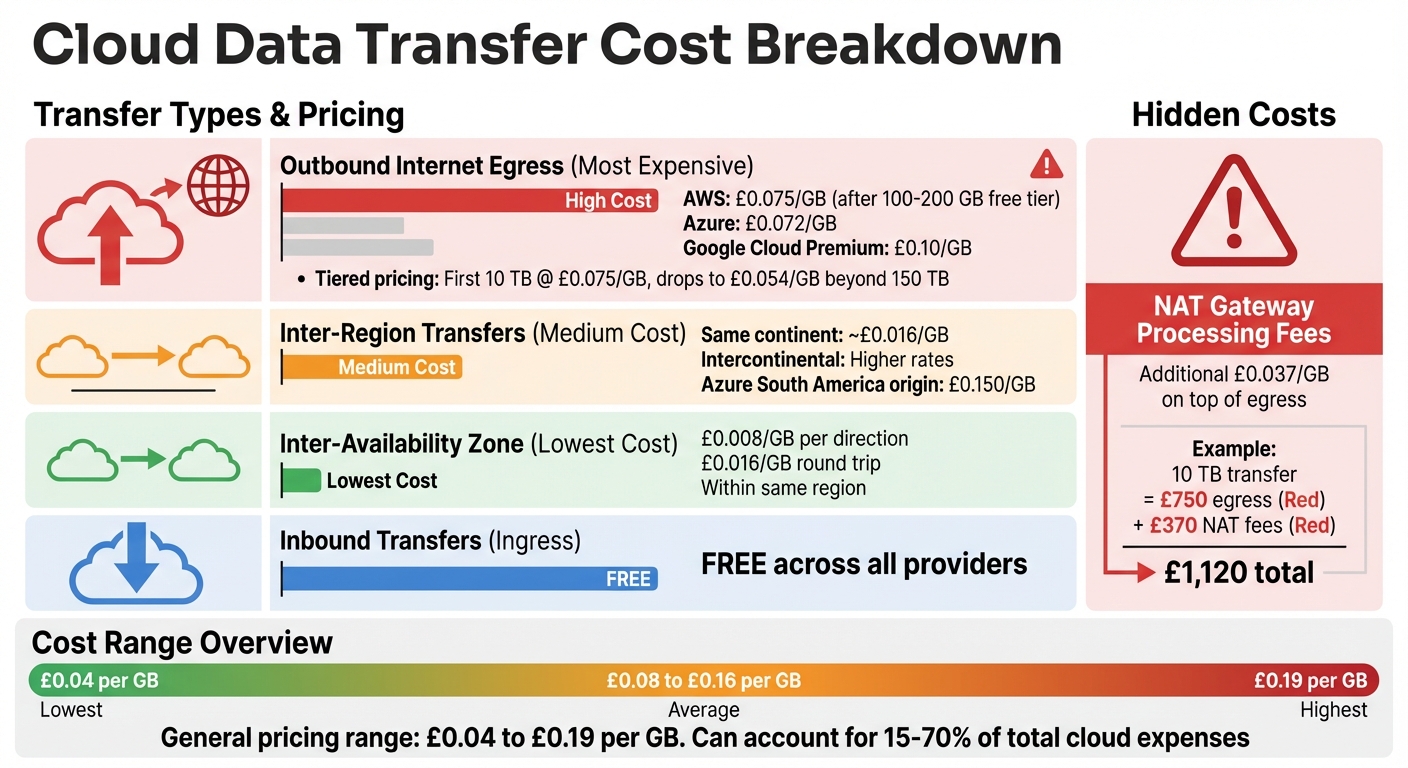 {Cloud Data Transfer Cost Breakdown by Type and Provider}
:::
{Cloud Data Transfer Cost Breakdown by Type and Provider}
:::
Cloud providers often use a pricing model where data ingress (inbound transfers) is free, but outbound data (egress) comes with a cost, usually ranging between £0.04 and £0.19 per GB [5][7]. This structure is designed to encourage users to keep their data within the provider's ecosystem by making it expensive to move data out [7][8].
Geography also plays a role in pricing. Transfers within the same availability zone are usually free. Moving data between zones within the same region may cost around £0.008 per GB per direction, while inter-region transfers can run approximately £0.016 per GB. It's worth noting that inter-region transfer costs are determined by the source region's outbound rates, not the destination's [6][8].
Cloud providers also employ tiered pricing for internet egress. For example, the first 10 TB might cost about £0.075 per GB, but rates drop to £0.054 per GB for usage beyond 150 TB [5][7]. Keeping track of these tiers can help you optimise costs.
Types of Data Transfers
Data transfers fall into three main categories, each with its own pricing structure:
Outbound Internet Egress: This is often the priciest type of transfer. After a free tier of 100–200 GB, costs typically hover around £0.075 per GB for AWS, £0.072 per GB for Azure, and about £0.10 per GB for Google Cloud's Premium tier [7].
Inter-region Transfers: These involve moving data between different geographic regions within the same provider. Costs are generally lower than internet egress - around £0.016 per GB within the same continent. However, intercontinental transfers can be much higher; for instance, Azure charges approximately £0.150 per GB for transfers originating in South America [9].
Inter-Availability Zone (AZ) Transfers: Although these are less costly, at about £0.008 per GB per direction (or £0.016 per GB for a round trip), they can add up if your applications frequently move data between zones [4][5].
Factors Affecting Data Transfer Costs
Several elements can influence how much you spend on data transfers:
Data Volume: Larger transfers benefit from tiered pricing. For example, transferring 5 TB monthly might cost around £0.075 per GB, while transferring 200 TB could bring the rate closer to £0.042 per GB [7]. This creates a cost advantage for larger organisations.
Geographic Routing: The cost varies depending on the source region. Transfers from North America or Europe are often cheaper than those from regions like Asia, Africa, or South America [6][9].
Hidden Processing Fees: Additional charges, such as NAT Gateway fees (typically £0.037 per GB), can significantly inflate costs. For instance, a 10 TB transfer might incur £750 in standard egress fees but add £370 in NAT processing fees, bringing the total to £1,120 [4][7].
Understanding how these factors interact is key to managing your expenses effectively.
Common Cost Pitfalls
Unexpected charges often stem from avoidable mistakes:
NAT Gateway Misconfigurations: Between 2015 and 2016, Dropbox saved around £61.9 million by moving away from Amazon S3 to its own infrastructure, with £32.8 million saved in the first year alone [5]. Similarly, Basecamp exited AWS and Google Cloud in 2023, investing £498,000 in hardware and projecting savings of £8.3 million over five years. Their shift away from S3 saved roughly £4,150 daily [5]. These cases highlight the importance of monitoring and optimising configurations.
Unmonitored Cross-AZ Traffic: Inefficient routing can quietly increase costs. For example, a Geocodio developer reported an £830 overspend due to routing traffic through a NAT Gateway instead of using free VPC Gateway Endpoints, which eliminate both NAT processing fees and inter-AZ charges [5].
Using Public IPs for Internal Communication: Routing internal traffic over public IPs can result in paying full internet egress rates instead of reduced internal rates [8]. Many businesses only realise this when they face unexpectedly high bills, making proactive monitoring essential.
| Common Pitfall | Typical Cost Impact | How to Identify It |
|---|---|---|
| NAT Gateway processing fees | +£0.037/GB on top of egress | Monitor BytesProcessedmetrics |
Cross-AZ chattyservices |
£0.008/GB per direction | Analyse VPC Flow Logs for traffic patterns |
| Public IP internal routing | Full internet egress rates | Check for traffic to public IPs in same region |
| Uncompressed data transfers | 60–80% unnecessary data | Review application logs for compression headers |
Next, we'll look at tools to help monitor and manage these cost drivers effectively.
Setting Up Monitoring Tools
To keep a close eye on data transfer costs, it's crucial to use monitoring tools that provide insights into usage patterns across your cloud setup. Once you’ve pinpointed what’s driving your expenses, cost tracking tools can help you stay on top of things. Many cloud providers even offer free, built-in tools to make this process easier.
Using Native Cloud Provider Tools
If you’re using Amazon Web Services (AWS), AWS Cost Explorer is your go-to tool for tracking data transfer costs. You’ll need to enable it in the AWS Cost Management console. This tool gives you access to historical data from the past 13 months and forecasts for the next 12 months, thanks to its machine learning models [11]. Keep in mind, though, that data updates take about 24 hours [10][11][16].
For better tracking, tagging your resources is a must. Use cost allocation tags like Environment=Production or Cost_Centre=Engineering on resources such as EC2 instances and Load Balancers [10]. After setting these tags, activate them in the Billing and Cost Management console [10][11]. Once everything is in place, filters like Usage Type Group
let you focus on specific transfers, such as EC2: Data Transfer - inter-Availability Zone
, Internet (Out)
, or Region to Region (Out)
[10].
If you need real-time updates, AWS CloudWatch Billing Alarms can alert you when costs exceed set limits. Just remember to switch your console region to US East (N. Virginia), where billing data is stored [12]. To set this up, enable Receive CloudWatch Billing Alerts
under Billing Preferences, then create an alarm for the EstimatedCharges metric [12]. It takes about 15 minutes for billing data and alarms to show up [12].
For Google Cloud users, Google Cloud Billing Reports offer a similar functionality. Head to the Reports
page in the Cost Management section and use the Group by
feature to break down costs, either by SKU for more detailed transfer insights or by Location to see regional spending [15]. Set the Time range
to Usage date
to compare actual usage with AI-driven cost forecasts [15]. While standard reports are free, running SQL queries on exported billing data will incur BigQuery usage fees [15].
If you’re managing multiple cloud platforms or need deeper insights, third-party tools can be a game-changer.
Deploying Third-Party Monitoring Tools
When you’re juggling costs across different cloud providers or require advanced analytics, third-party tools come in handy. For instance, Datadog connects to cloud providers through APIs, pulling in billing data and usage reports to give you a unified view of costs across AWS, Azure, and Google Cloud [14][17]. To set this up, you’ll need to grant the right IAM permissions [13][14]. Some setups even use agents, like the Datadog Agent, to link network traffic with cost data [14][18]. This allows for features like Tag Pipelines
and custom rules, so you can allocate data transfer costs to specific teams, projects, or environments [14][17].
Another option is Grafana Cloud, which offers a free tier that includes 10,000 metrics and 50 GB of logs and traces - perfect for smaller organisations exploring multi-cloud cost tracking [20]. These platforms are particularly useful in complex setups where native tools might fall short, especially for cross-cloud cost attribution or creating team-specific dashboards [19][21].
Configuring Alerts and Anomaly Detection
After setting up your monitoring tools, the next step is to configure alerts to catch any unexpected cost increases as they happen. Without these alerts in place, you might only notice a problem when your monthly bill arrives - by which time it's too late to take preventative action.
By fine-tuning your alerts, you can respond quickly to unusual spending patterns and avoid unnecessary costs.
Creating Alerts for Cost Spikes
One of the most effective ways to stay on top of your cloud spending is by setting up budget alerts that track your expenses against a specific financial limit. Here's how it works across different platforms:
- AWS: First, enable
Receive Billing Alerts
in the Billing and Cost Management console. Then, switch to the US East (N. Virginia) region to access billing data. Create an alarm for theEstimatedChargesmetric to monitor your total worldwide charges or focus on specific services [25][12]. - Azure: Cost Management provides anomaly alerts that track specific resource types, such as
microsoft.network/virtualnetworkgateways, and even individual SKUs like VpnGw1 or VpnGw3. Azure uses 60 days of historical data to predict expected daily usage and flags any deviations [27]. - Google Cloud: Billing Budgets in Google Cloud allows you to set alerts with email or Pub/Sub notifications, making it easier to track spending [26].
For those managing multiple cloud providers, third-party tools like Datadog and Grafana Cloud offer integrated solutions. Datadog’s Cloud Cost Monitors and Grafana Cloud’s usage-based alerts are particularly useful for unified monitoring [22][24].
Implementing Anomaly Detection
While budget alerts are great for known thresholds, anomaly detection helps uncover unexpected issues. For instance, it can identify problems like misconfigured autoscaling or unauthorised usage by analysing your normal usage patterns [23].
- AWS: To use AWS Cost Anomaly Detection, enable Cost Explorer at the management account level. AWS offers two types of monitors: managed monitors, which cover all services and accounts, and customer-managed monitors, which focus on up to 10 specific values, such as cost allocation tags for data transfer [26]. Managed monitors can track up to 5,000 values within a single dimension [26]. Alerts can be set to trigger when anomalies exceed £100 or deviate by 20%, with notifications available via Amazon SNS, email, or summaries [26].
- Infrastructure as Code: Tools like Terraform can help maintain consistent monitoring setups across multiple accounts. For example, you can deploy resources like
aws_ce_anomaly_monitorandaws_ce_anomaly_subscriptionfor automated anomaly detection [23].
AWS also provides a Top Root Cause
analysis for detected anomalies, which identifies the responsible service, account, region, and usage type [26].
| Platform | Alert Tool | Anomaly Detection | Notifications |
|---|---|---|---|
| AWS | CloudWatch Billing Alarms | Cost Anomaly Detection (ML) | Email, Amazon SNS, Slack, Chime |
| Azure | Cost Management Alerts | Cost Anomaly Alerts (ML) | Email, Azure Monitor alerts |
| Google Cloud | Billing Budgets | Budgets / ML-based insights | Email, Pub/Sub notifications |
| Datadog | Cloud Cost Monitor | Watchdog / Anomaly Monitors | Integrated Alerts [22] |
Strategies to Reduce Data Transfer Costs
Once you've set up monitoring tools, the next step is actively working to bring down data transfer costs. Even with detailed tracking, poor data routing or inefficient resource allocation can still lead to inflated cloud expenses.
Analysing and Tagging Data Transfers
A consistent tagging strategy is key to identifying where your data transfer costs are coming from. Without proper tags, it’s tough to figure out which departments, projects, or services are driving up your expenses. For AWS users, Transit Gateway resources deserve special attention. Make sure to tag both the Transit Gateway resources and their attachments. Additionally, tag the resource itself in every shared account to isolate these charges effectively [28]. Use your monitoring data to confirm that your tagging efforts are providing clear and accurate cost attribution.
Improving Data Routing and Usage Patterns
Take a closer look at your data routing setup. Use Content Delivery Networks (CDNs) to cache static content, and rely on edge locations to manage compute tasks. This reduces the need for long-distance data transfers. You can also consolidate resources geographically to cut down on inter-region charges and tweak API call patterns to avoid unnecessary transfers. If you’re looking for deeper optimisation, consulting with experts can make a difference.
Working with Hokstad Consulting
For professional support, Hokstad Consulting offers services in cloud cost engineering and DevOps automation. With the insights from your monitoring tools, they can identify inefficiencies and implement targeted solutions. They specialise in conducting thorough cloud cost audits and operate on a No Savings, No Fee
model, so you only pay if they deliver measurable savings.
Conclusion
Managing cloud data transfer costs is crucial for keeping spending in check, and the tools mentioned - AWS Cost Explorer, Vantage, and Datadog - offer real-time tracking and anomaly detection to help prevent unexpected spikes in expenses [1][2][3].
Shifting from a reactive to a proactive approach is key. By focusing on strategies like effective tagging, smart tool usage, and optimised data routing, businesses can reduce costs while maintaining performance. These steps also ensure precise cost allocation, making it easier to manage budgets. Implementing both native and third-party solutions promptly can help avoid unpleasant surprises.
For companies looking for expert assistance, Hokstad Consulting offers customised services in cloud cost management and DevOps optimisation. With their No Savings, No Fee model, businesses only pay when tangible results are achieved, making them a reliable partner for reducing data transfer costs across public, private, and hybrid cloud setups.
FAQs
How do I find what’s driving my egress costs?
To figure out what’s causing your egress costs, start by examining the types of data transfers that are adding the most to your expenses. Typical sources of high costs include cross-region transfers, inter-region transfers, and data being sent from the cloud to external locations.
Leverage built-in tools like AWS Cost Explorer or Azure Cost Management to identify the areas where costs are highest. Make it a habit to review your billing data regularly and map out your data flows. This will help you spot the main factors contributing to your egress charges.
How can I spot hidden data transfer fees like NAT Gateway charges?
To spot those sneaky hidden charges, like NAT Gateway fees, start by keeping an eye on your cloud network traffic. Tools such as VPC Flow Logs can be a lifesaver here, allowing you to track data movement through NAT Gateways and other network elements.
It's also a good idea to regularly check your billing details. Look out for costs related to things like IPv4 address rentals, NAT Gateway processing fees, and cross-region data transfers. By auditing your network usage and getting familiar with your provider’s pricing structure, you’ll be better equipped to identify and manage these fees.
What alerts should I set to catch data transfer cost spikes early?
To stay ahead of unexpected data transfer cost increases, it’s a smart move to set up alerts for unusual activity or when spending crosses certain limits. Here are two key types of alerts to consider:
- Cost Anomaly Alerts: These use machine learning or statistical models to flag sudden spikes in expenses that deviate from normal patterns.
- Budget Alerts: These notify you as your spending nears specific thresholds, such as 50%, 75%, or 90% of your budget.
Take advantage of your cloud provider’s monitoring tools to configure these alerts. Be sure to review them regularly so you can tackle any issues as soon as they arise.