
Observability costs are rising, and understanding the difference between metrics and logs can save you money. Metrics are compact, efficient, and up to 100 times cheaper than logs, making them ideal for continuous monitoring. Logs, while detailed and indispensable for debugging, drive costs due to their volume, indexing, and storage requirements.
Key takeaways:
- Metrics: Best for monitoring and alerting; cost-effective but requires cardinality control.
- Logs: Essential for root-cause analysis but expensive due to high ingestion and storage costs.
- Observability can account for 15–30% of cloud budgets, with logs often making up 60–80% of that.
Quick Comparison:
| Dimension | Metrics | Logs |
|---|---|---|
| Cost Driver | Cardinality (unique labels) | Ingestion volume (GB) |
| Storage Cost | Low (~1.6 bytes/sample) | High (~200 bytes/line) |
| Best Use Case | Dashboards, alerting | Debugging, compliance |
| Retention | Months to years (compressed) | Days to weeks (expensive hot storage) |
To cut costs:
- Limit high-cardinality labels in metrics.
- Filter unnecessary logs before storage.
- Use tiered storage and downsample data over time.
The goal is smarter observability - not storing everything. Start by auditing your telemetry pipeline and prioritising high-value data. If needed, consult experts to reduce costs by 30–50%.
::: @figure 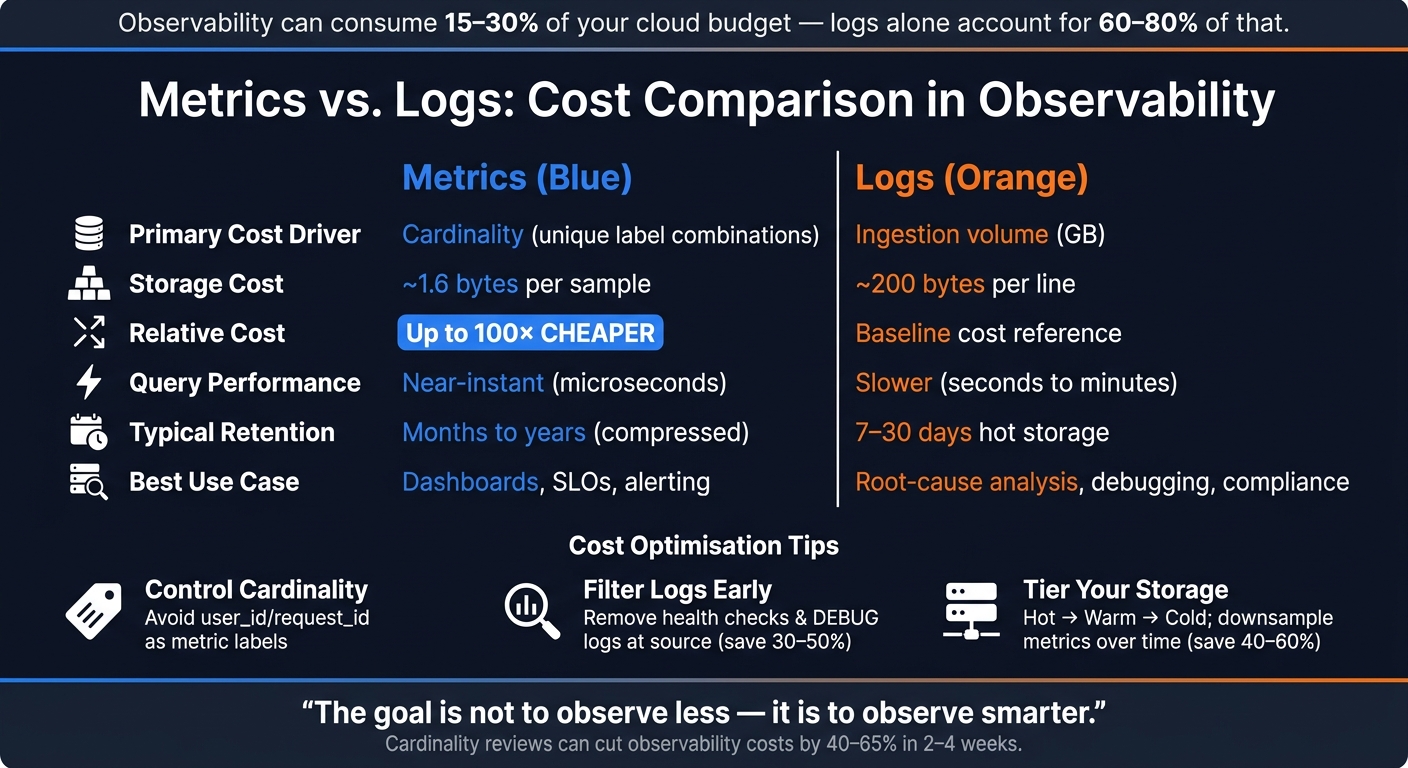 {Metrics vs. Logs: Cost Comparison in Observability}
:::
{Metrics vs. Logs: Cost Comparison in Observability}
:::
Metrics in Observability: What They Are and What They Cost
What Are Metrics?
Metrics are essentially structured, numerical data points recorded over time. Think of examples like CPU usage at 73%, an error rate of 0.4%, or 1,200 requests per second. These data points are aggregated and indexed with a name and labels (or dimensions), making them compact and quick to query. Advanced compression algorithms, such as Gorilla compression, can reduce a single metric sample to as little as 1.37 bytes – a massive improvement from the typical 16 bytes [2][10].
Metrics provide a summarised view of system behaviour, unlike logs, which detail individual events. As Mukta Aphale from Last9 aptly explains:
Metrics tell you something is wrong. Logs tell you what is wrong.[8]
Common Use Cases for Metrics
Thanks to their efficient structure, metrics play a crucial role in several areas:
- Real-time monitoring and alerting: Metrics allow teams to track Service Level Objectives (SLOs), build dashboards, and trigger alerts when thresholds are breached. For instance, an alert might fire if p95 latency exceeds 500ms.
- Capacity planning: Metrics are invaluable for predicting and managing resource needs over time. Their high compression efficiency means that storing a year’s worth of per-second metrics only takes up gigabytes, compared to the terabytes required for equivalent log data [2].
Metrics are particularly suited for alerting because numerical data can be evaluated against high-resolution time-series data far more efficiently than querying logs repeatedly [2][9].
To ensure metrics remain manageable and relevant, three widely-used frameworks guide their implementation:
- Four Golden Signals: Tracks Latency, Traffic, Errors, and Saturation to gauge service health.
- USE method: Focuses on Utilisation, Saturation, and Errors, commonly used for infrastructure monitoring.
- RED method: Monitors Rate, Errors, and Duration, ideal for service-level insights.
Cost Factors for Metrics
Metrics are often the most cost-efficient data type in observability, being around 100 times cheaper than logs for the same workload [2]. However, costs can rise quickly without careful control over cardinality.
Cardinality – the number of unique time series created by label combinations – is the biggest cost driver. Each unique set of label values (e.g., user_id or request_id) generates a separate billable time series. High cardinality can result in steep charges.
The single knob that actually controls observability cost is cardinality.- Muskan, DEV Community [3]
Other factors influencing costs include:
- Resolution: Collecting data more frequently (e.g., every second instead of every 15 seconds) increases the volume of samples and query loads.
- Retention: Storing data for longer periods increases storage requirements.
- Metric churn: In Kubernetes environments, ephemeral pod IDs and container names can generate many unique series, inflating costs.
- Dashboard refresh rates: Frequent refreshes can rack up API and query charges unnecessarily.
Here’s a breakdown of key cost factors and how to manage them:
| Cost Factor | Impact | Optimisation |
|---|---|---|
| Cardinality | Creates exponential growth in series | Avoid unbounded IDs in labels; use attributes or logs for high-cardinality data |
| Resolution | Increases sample and query volume | Lower frequency for non-critical metrics |
| Retention | Expands long-term storage needs | Downsample older data; adopt tiered storage solutions |
| Metric churn | Raises active series counts | Aggregate ephemeral data at the service level |
| Dashboard refresh | Adds unnecessary API and query charges | Reduce refresh rates for infrequently viewed dashboards |
For example, Datadog charges approximately £0.10 per month for every 100 custom metrics beyond the free limit [1]. Google Cloud Monitoring, on the other hand, prices metrics by ingestion volume, ranging from £0.2580 to £0.0610 per MiB [4].
To keep costs under control, treat metric labels like a schema. Review them during code reviews to avoid introducing dimensions that could generate excessive unique values. If a label risks exceeding 100 unique values per week, move it to trace attributes or log fields instead [3].
Next, we’ll dive into logs, another fundamental pillar of observability, and explore their cost considerations.
Need help optimizing your cloud costs?
Get expert advice on how to reduce your cloud expenses without sacrificing performance.
Logs in Observability: What They Are and What They Cost
What Are Logs?
Logs are timestamped records of individual events that detail exactly what happened in a system - whether it's a request arriving, a database query running, or an error being triggered. Unlike metrics, which summarise behaviour as numerical trends over time, logs retain the full context of each event.
Logs generally come in two formats: unstructured text, which is plain and human-readable, and semi-structured formats like JSON. JSON logs are becoming the preferred standard because they’re easier for machines to process and filter. Plus, they compress 2–5 times more efficiently than unstructured logs [5].
If metrics help answer is there a problem?
, logs help answer what went wrong, and why?
. Their detailed context makes them indispensable for troubleshooting and understanding incidents.
Common Use Cases for Logs
Logs are invaluable when you need detailed analysis rather than broad system health insights. Here are some of the most common scenarios:
- Root-cause analysis (RCA): Logs provide stack traces and error IDs that pinpoint exactly where and why a failure occurred.
- Incident investigation: Trace IDs in logs help reconstruct the sequence of events across distributed systems, offering clarity during outages.
- Compliance and auditing: Regulations like GDPR often require organisations to retain specific logs, such as payment or identity verification records, for set periods - typically 12 months or more [12][13]. These logs are non-negotiable, regardless of cost.
- Event validation: Logs can confirm structural event pairs, ensuring every
start
event has a correspondingcomplete
event - something metrics can’t reliably track [12].
Logging isn't a feature. It's the operational foundation everything else runs on.- Temitope Bamidele, Software Engineer [12]
Understanding these use cases is key to appreciating how logs contribute to observability expenses.
Cost Factors for Logs
Logs, while essential, can significantly impact budgets. In fact, they’re often the largest contributor to observability costs, accounting for 60–80% of total spending [5]. The primary driver? Volume. For example, a service handling 10,000 requests per second, with each log entry averaging 5 KB, generates around 4 TB of log data daily [1].
Here are the main factors influencing log costs:
- Ingestion volume: Most platforms, like Google Cloud Logging, AWS CloudWatch, and Datadog, charge based on the amount of data ingested. For instance, Google Cloud Logging charges about £0.40 per GiB [4].
- Indexing overhead: Full-text indexing enhances searchability but comes at a price. Indexing 1 GB of log data can result in 3–5 GB of storage usage [4].
- Retention: Storing verbose logs in expensive, fully indexed
hot
storage for extended periods is a common - and often unnecessary - expense.
Log ingestion is becoming a budget problem because logging is no longer a passive exhaust stream. It has become a high-volume operational product that many teams still manage like a side effect.- Frank Song, Software Engineer [6]
Tiered Retention Model
To optimise costs, consider a tiered retention strategy:
| Log Type | Recommended Retention | Storage Tier |
|---|---|---|
| Debug Logs | 1–3 days | Hot (SSD / Fully Indexed) |
| Info / Warn Logs | 14–30 days | Warm (HDD) |
| Error Logs | 90 days | Warm / Cold |
| Compliance / Audit | 1–5 years | Cold (e.g., Object Storage like S3) |
Reducing log costs often starts with filtering out unnecessary data - like health checks, successful authentications, or repetitive cron job outputs - right at the source. Tools like Fluent Bit or OpenTelemetry Collector can help with this [5][7]. Storing and indexing data you’ll never query is a costly mistake that’s entirely avoidable. These insights on managing log costs will play a crucial role in shaping a cost-efficient observability strategy.
Monitoring vs Observability: Logs, Metrics, Traces, APM, RUM & Costs
Metrics vs Logs: A Direct Cost Comparison
When we stack metrics and logs side by side, the cost difference is striking - metrics are approximately 50 to 100 times cheaper than logs for the same workload [2]. This disparity boils down to how metrics and logs are stored, queried, and retained. Metrics are the go-to for continuous monitoring, while logs are best suited for detailed investigations.
Cost Comparison Table
| Dimension | Metrics | Logs |
|---|---|---|
| Primary Cost Driver | Cardinality (unique tag combinations) [3] | Ingestion volume (GB) [7] |
| Storage Cost | Low (~1.6 bytes per sample) [2] | High (~200 bytes per line) [2] |
| Query Performance | Near-instant (microseconds) [2] | Slower (seconds to minutes) [2] |
| Typical Retention | Long-term (months to years) [2] | Short-term (7–30 days hot) [5] |
| Estimated Ingestion Cost | ~£0.008–£0.024 per 10,000 samples [15] | ~£0.40–£1.60 per GB [15] |
| Best Use Case | Dashboards, SLOs, alerting [2] | Root-cause analysis, forensics [2] |
Why Metrics Are Cheaper for Continuous Monitoring
Metrics consist of pre-aggregated numerical data - like counters, gauges, and histograms. Instead of capturing every event, they summarise overall behaviour, which makes them highly efficient to store and query. For example, generating dashboards from metrics takes microseconds, whereas using logs for the same task can take seconds or even minutes [2].
Computing dashboards from logs is technically possible and operationally infeasible. The query latency and storage cost don't scale with traffic.- Systems Explained [2]
This efficiency makes metrics ideal for continuous monitoring tasks like tracking Golden Signals (rate, errors, duration), monitoring SLO burn rates, and setting alert thresholds. You can store years of high-resolution metrics data in just gigabytes, while storing comparable log data would require terabytes [2].
Why Logs Can Become Expensive
Logs provide detailed event-level records, making them invaluable for debugging - but that same detail comes with a hefty price tag. Logs generate high costs due to their large ingestion volumes, intensive indexing, and the storage required for retention. For instance, indexing 1 GB of log data can consume an additional 3–5 GB of storage [4]. Moreover, log queries are scan-based, meaning costs increase with the amount of data searched. During incidents, when engineers run multiple queries across large time spans, these costs can skyrocket [4][14].
The takeaway? Use metrics for ongoing monitoring and alerting, and save logs for when you need in-depth, event-level insights.
Building a Cost-Efficient Observability Strategy
Understanding that logs can cost 50–100 times more than metrics is only half the battle. The real challenge lies in crafting a strategy that provides the necessary visibility while keeping costs under control. By leveraging the cost differences between metrics and logs, you can create a streamlined observability pipeline.
Metrics-Heavy, Logs-Heavy, and Balanced Approaches Compared
The best approach depends on factors like team size, technical expertise, and system complexity.
| Approach | Cost | Best For | Trade-offs |
|---|---|---|---|
| Metrics-Heavy | Low | Small teams; high-scale health monitoring | Limited insight into specific user or event-level details [2] |
| Logs-Heavy | High | Debugging; audit/compliance; low-traffic systems | High storage and query costs at scale [2] |
| Balanced | Moderate | Mature teams; complex microservices | Requires strict governance and signal linking [2][11] |
For large-scale environments, a balanced approach works best. Combining metrics for routine monitoring with logs for in-depth debugging strikes the right balance between visibility and cost. The secret? Linking metrics and logs. Attaching a trace_id to metric samples (exemplars) allows engineers to jump directly from a metric alert to the relevant log line, avoiding the need to store everything at full fidelity [2].
Practical Ways to Cut Observability Costs
The strategies outlined above provide a framework, but here’s how to turn those ideas into tangible savings:
- Control metric costs by enforcing cardinality governance. Avoid using high-uniqueness identifiers like
user_id,request_id, or UUIDs as metric labels. For example, a single metric with just four tags, includinguser_id, can generate over 1.4 billion unique time series [3]. Instead, move these identifiers to logs or traces. - Reduce log volume by filtering out unnecessary entries, such as health checks and
DEBUGlogs, before they’re stored. Tools like OpenTelemetry Collector, Vector, or Fluent Bit can help, reducing log volume by 30–50% [16]. Additionally, use dynamic log levels: keep production environments atINFOorWARNby default, enablingDEBUGonly when needed for investigations. - Tier your storage to save on long-term costs. For example:
| Tier | Retention | Storage Type | Cost |
|---|---|---|---|
| Hot | 0–7 days | SSD / Indexed | High |
| Warm | 7–30 days | HDD / Partial Index | Medium |
| Cold | 30+ days | Object Storage (e.g., S3) | ~£0.018/GB per month [4] |
For metrics, consider downsampling to reduce resolution over time. Keep raw data for a few days, then aggregate it into 5-minute or 1-hour intervals for long-term analysis [10]. This retention optimisation alone can cut storage costs by 40–60% [15].
How Hokstad Consulting Approaches Cost Management
Most expensive log bills do not happen because teams love logs too much. They happen because teams never forced themselves to distinguish critical visibility from default accumulation.- Frank Song, Software Engineer [11]
Hokstad Consulting starts with a thorough cloud cost audit to identify where observability spend is going. They focus on pinpointing high-cardinality detonators
in metric labels and retention policies that unnecessarily keep low-value logs in expensive hot storage. From there, they redesign telemetry pipelines, filtering out noise at the source using OpenTelemetry Collectors. This ensures only high-value signals reach costly vendor backends [5][11].
Their approach typically reduces cloud expenses by 30–50%. Operating on a no savings, no fee model, they eliminate upfront risks for clients. This method fosters a cost-conscious, efficient observability framework tailored for modern cloud environments.
Conclusion: Key Takeaways for Cost-Effective Observability
Metrics vs Logs: Cost Drivers Recap
Here’s the bottom line: metrics are far more cost-efficient than logs, often up to 100 times cheaper. This is because metrics compress well and scale predictably, whereas logs rack up expenses due to ingestion volume, indexing, and retention requirements [2]. The main cost factor for metrics is cardinality - the number of unique label combinations. For logs, it’s all about ingestion volume, indexing depth, and how long they’re retained.
At scale, observability can consume anywhere from 15% to 30% of your cloud budget [15]. That’s not pocket change! The real issue? Teams often log everything at full fidelity or unintentionally create massive numbers of time series with a misconfigured metric label (like including user_id), leading to runaway costs [3].
The goal is not to observe less - it is to observe smarter. Every byte of telemetry should earn its storage cost.- Codelit Team [5]
By understanding these cost dynamics, you can start building a smarter and more efficient observability framework.
Next Steps for Observability Optimisation
Now that you know what drives observability costs, it’s time to take action. The most meaningful improvements don’t usually involve switching vendors. Instead, focus on optimising how you collect and store telemetry data.
For example, a cardinality review can deliver significant savings - often cutting observability costs by 40–65% in just two to four weeks. Compare that to a vendor migration, which could take six to twelve months without addressing the root problem [3]. Start by auditing your top 20 metrics by series count, removing labels with high uniqueness, and setting production log levels to INFO or WARN by default.
If your team doesn’t have the capacity for this kind of audit, Hokstad Consulting offers a specialised service to help. They’ll conduct a detailed review of your observability spend, identify inefficiencies like cardinality issues or over-retained logs, and redesign your telemetry pipeline. Plus, their no savings, no fee model ensures zero upfront financial risk. Their clients typically see 30–50% reductions in cloud costs - a solid return for optimising your observability approach.
FAQs
When should I use logs instead of metrics?
Logs play a crucial role when digging into the root cause of an issue highlighted by metrics. While metrics offer a broad overview of a system's health, logs provide the detailed context you need - like error messages or stack traces - to perform in-depth analysis or meet compliance requirements.
To keep storage costs under control, use logs strategically. Focus their use on specific investigations, adopt structured logging for clarity, and set clear retention policies to manage data efficiently.
How do I spot and fix high-cardinality metric labels?
To spot high-cardinality labels, start by querying your metrics to count unique series or identify labels with an unusually large number of unique values - think labels with over 1,000 combinations.
Once identified, you can address these labels in a few ways:
- Use bounded labels: Group data by broader categories instead of specific identifiers. For example, categorise by
region
instead of individualuser IDs
. - Move unbounded identifiers to logs: Shift highly specific data, like user IDs, to logs where detailed tracking is more appropriate.
- Drop unnecessary labels: During the scraping process, exclude labels that aren't essential for monitoring.
- Pre-aggregate data: Apply recording rules to summarise data beforehand. This reduces the volume of unique series, keeping monitoring costs under control.
These approaches ensure your monitoring remains efficient and manageable without sacrificing key insights.
What retention and storage tiers should I use for logs and metrics?
When it comes to metrics, their high compression and low storage requirements make them ideal for long-term retention. This allows you to track performance trends effectively without consuming significant storage space.
For logs, a tiered storage approach works best. Store recent logs (7–14 days) in high-performance storage to ensure quick access for troubleshooting. Older logs, however, can be moved to cold storage or archives. This is useful for compliance purposes or for the occasional deep-dive investigation. Be cautious with 'never expire' settings, as unchecked log growth can lead to unnecessary costs over time.