
I measure AI agent ROI by money gained after costs - not minutes saved. I start with four to eight weeks of pre-AI data, then compare like-for-like work after launch. Time saved counts towards financial returns only when it cuts spending, avoids hiring or produces extra sales margin.
Here’s my checklist:
- Check what changed: use a control group or phased rollout to separate the agent’s effect from demand, staffing and process changes.
- Count every added cost: include setup, training, usage, hosting, support, human checks and corrections - without counting anything twice.
- Calculate the return: net value is attributable financial gains minus added AI costs. ROI is net value divided by those costs, multiplied by 100.
- Track payback monthly: use cash received and spent, allow for adoption delays, and test cautious, expected and upside cases.
- Check before expanding: keep records, review quality and safety, and update the figures when costs or scope change.
The catch? In the article’s hypothetical support workflow, 60% adoption still leaves a £2,610 monthly cash shortfall before setup costs. That’s why I keep freed-up time separate from cash returns and use the same reporting period and VAT treatment throughout.
::: @figure 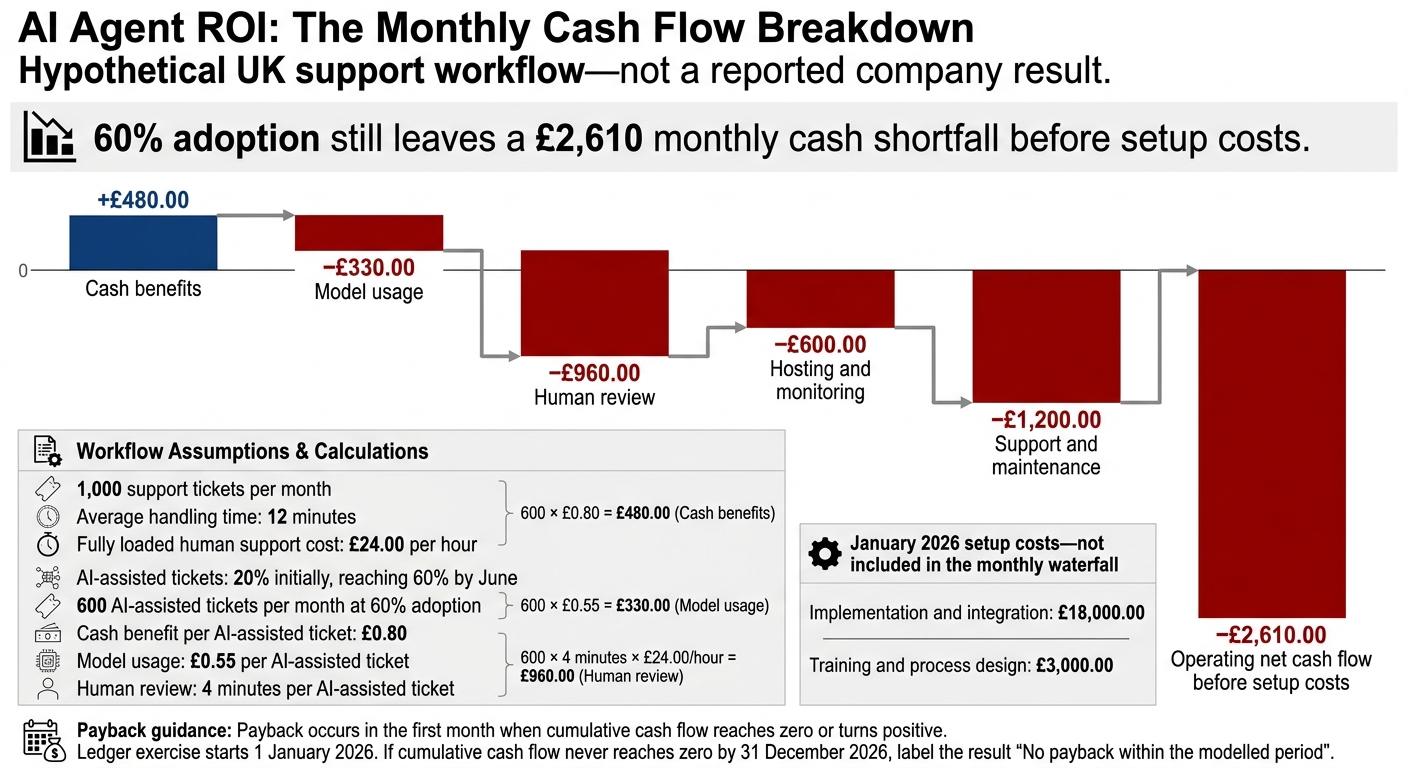 {AI Agent ROI: The Monthly Cash Flow Breakdown}
:::
{AI Agent ROI: The Monthly Cash Flow Breakdown}
:::
How to Measure the ROI of AI Agents
1. Set Your Baseline and Success Criteria
Choose one repeatable workflow with a clear start and finish. Before deployment, agree on the objective, targets and stop rules.[1][2] These form the baseline for post-launch comparisons, net value and payback.
Measure Performance Before AI
Create a one-page measurement brief covering eligible requests, exclusions, systems, service-level expectations and the required quality standard. Assign a process owner, measurement owner, finance reviewer and sponsor.
Your baseline should reflect normal peaks, shifts and task complexity. Extend the measurement period if seasonality or staffing changes would skew the results. Include all human effort, from searching to checking and correcting, but track active work separately from time spent waiting in queues.
Before launch, lock the baseline dates, inclusion rules and data extract. Record each metric’s baseline value in the data dictionary.[2][3] Complete the table’s final column with measured values and their baseline dates.
| Metric | Formula or definition | Source | Frequency | Owner | Baseline dates / value |
|---|---|---|---|---|---|
| Eligible volume | Count of in-scope tasks received | Case records | Weekly | Operations lead | |
| Active handling time | Median and average active human minutes per task | Time study | Weekly | Process owner | |
| Cycle time | Creation to approved completion; median and 95th percentile | Workflow timestamps | Weekly | Operations analyst | |
| Fully loaded labour rate | Eligible employment costs and overheads ÷ productive hours worked | Payroll and finance | Monthly | Finance reviewer | |
| Cost per completed task | Eligible process costs ÷ tasks meeting the agreed standard | Finance and case records | Monthly | Finance reviewer | |
| Error and rework rate | Tasks requiring correction ÷ completed tasks | Quality audit | Weekly | Quality owner | |
| Escalation rate | Escalated tasks ÷ eligible tasks | Case records | Weekly | Service owner | |
| Backlog and service level | Open eligible tasks; tasks within SLA ÷ tasks due | Workflow report | Weekly | Operations lead | |
| Customer satisfaction | Agreed survey score, with response count | Survey records | Monthly | Customer owner |
Compare Results After Deployment
After launch, retain the same task definitions, baseline dates and owners. Use the locked baseline definitions and task IDs so comparisons stay consistent.
A task counts as successful only when it meets the agreed standard. A draft, suggestion or unreviewed agent output does not count. For each task ID, log whether the agent was used, whether a human reviewed or edited its output, review minutes, corrections and exceptions.
Populate the table with baseline values and targets before launch, and set review levels by risk tier.[1][2][3]
| Measure | Baseline value | Post-deployment value | Calculation | Source | Target | Review |
|---|---|---|---|---|---|---|
| Eligible-task adoption | 0% | Agent-used eligible tasks ÷ eligible tasks | Workflow telemetry | 70%+ | Weekly | |
| Successful completion | 86.0% | Correct tasks without rework ÷ eligible completed tasks | Case audit | 90%+ | Weekly | |
| Median active handling time | 11.5 min | Median human minutes per task | Workforce data | ≤8.0 min | Weekly | |
| Human-review rate | 100% | Tasks requiring review ÷ agent-handled tasks | Agent and case logs | By risk tier | Weekly | |
| Escalation rate | 14.2% | Escalated tasks ÷ eligible tasks | Case system | ≤ baseline | Weekly | |
| Cost per completed task | £18.88 | Eligible total cost ÷ tasks meeting the agreed standard | Finance and telemetry | ≤£14.50 | Monthly | |
| Customer satisfaction | Approved survey score | Survey platform | No decline | Monthly |
Isolate the Agent’s Impact
Use a matched comparison group or phased rollout to separate the agent’s effect from other changes. Adjust comparisons for volume, complexity, input quality, staffing and process changes. Record model and prompt changes too.[2][3]
During the pilot, review workflow results weekly and financial results monthly. Once results are stable, move financial reviews to a monthly or quarterly schedule. Keep a decision record showing whether quality, cost and customer thresholds were met, whether the evidence supports attributing results to the agent, and whether to stop, revise or expand.[4]
Apply the same attribution rules when measuring benefits and costs. Without a control, describe gains as associated with deployment - not as proven to have been caused by it.[2][3]
2. Measure Benefits and Total Costs
Use the locked baseline dates and task IDs from Section 1 to link every benefit and cost to the same workflow. Keep one ledger for the reporting period, with separate lines for benefits, baseline running costs and additional AI costs. Give each line an owner, a formula and supporting evidence.
Keep existing expenditure separate. An unchanged salary bill is neither a new AI cost nor a cash saving. Count only gains and costs traced to the agent - not those caused by other process or staffing changes.
Separate Cash Savings from Freed-Up Time
Value verified hours released at the fully loaded UK labour rate. Calculate this by adding salary, employer National Insurance, pension, benefits and overheads, then dividing by productive hours.
| Benefit | Valuation rule | Evidence required |
|---|---|---|
| Cash savings | Actual reductions in overtime, supplier spend, refunds, rework costs or penalties | Payroll, invoices and reconciled operating records |
| Avoided costs | Expenditure that would otherwise have occurred | Approved vacant role, contractor plan or budget commitment |
| Released capacity | Verified hours released × fully loaded hourly rate; count only when converted to savings, avoided hiring or extra contribution | Time records and evidence of redeployment |
| Revenue contribution | Additional sales less related variable costs, not total sales revenue | Attributed sales and finance-approved contribution margin |
| Non-financial outcomes | Report service, quality and risk separately unless an agreed monetary value exists | Service reports, quality audits and customer feedback |
Give each benefit its own identifier and record its dependencies. Don't count the same gain twice. If released capacity leads to extra sales, count the additional contribution - not that contribution plus the value of the same hours. If fewer errors cut both refunds and correction work, record those separate effects without counting correction time twice.
Track Setup and Running Costs
Separate one-off investment from recurring spend. Use actual supplier rates and internal labour costs rather than generic list prices. Tag usage and charges to the workflow, and allocate shared costs using a documented usage measure.
Include orchestration, observability, evaluation, security, integration, data pipelines and human review - not just token spend.[5]
| Category | Driver | Unit rate | Volume | Period | Owner |
|---|---|---|---|---|---|
| Discovery, development and integration | Project hours | Approved £/hour | Recorded hours | One-off | Delivery lead |
| Data preparation, testing, security and compliance | Specialist hours | Approved £/hour | Recorded hours | One-off or periodic | Assurance lead |
| Training and change management | Staff or workshop hours | Loaded £/hour or supplier fee | Hours or sessions | One-off or periodic | Change lead |
| Model usage | Input/output tokens, by model | Contract £/million tokens | Logged tokens | Monthly | AI product owner |
| Tools and third-party services | API calls or transactions | Contract £/call | Logged calls | Monthly | Integration owner |
| Hosting, storage and retrieval | Compute, storage and retrieval usage | Billed £/unit | Metered units | Monthly | IT owner |
| Monitoring, evaluation, maintenance and support | Reviews, tests, dashboards and staff hours | Contract fee or £/hour | Recorded usage | Monthly | Service owner |
| Incidents and recovery | Staff hours and additional usage | Loaded £/hour plus usage rates | Logged effort and usage | Monthly | Incident owner |
Account for Human Review and Failures
Compare all remaining human effort with the baseline. Include review, corrections, escalations, control checks, fallback handling and recovery.
Choose one accounting treatment: deduct this effort from gross time released, or record it as an explicit cost. Don't add failed-run and retry usage again if it's already included in model or tool bills.
Reconcile these lines monthly and document the chosen treatment alongside the evidence. Carry the reconciled totals into the net value and ROI calculation.
3. Calculate Net Value, ROI and Payback
Calculate Net Value and ROI
Use the reconciled ledger from Section 2 to calculate returns for each reporting period:
Net value = attributable financial benefits − incremental AI costs.
ROI = net value ÷ incremental AI costs × 100.[6][7]
Count only incremental setup, model, hosting, monitoring, support and human review costs. Include review time only if you haven’t already deducted it from benefits. The denominator is incremental AI investment, not the cost of the existing workflow.
Keep financial ROI separate from capacity and quality gains. Report first-year ROI with setup costs and steady-state ROI without one-off setup costs. State whether the figures include or exclude VAT, and apply that treatment consistently.
Track Cash Flow and Find the Payback Point
Build a monthly cash-flow schedule. Don’t simply divide annual cost by annual benefit.
For each month, record attributable cash benefits realised; implementation, model, hosting, support and review costs; net monthly cash flow; and cumulative cash flow. Account for deployment delays, adoption ramp-up, seasonal demand and uneven ticket volumes.
Payback occurs in the first month when cumulative cash flow reaches zero or turns positive. If that happens part-way through a month, estimate the fraction using:
Payback fraction = unrecovered opening balance ÷ monthly net cash benefit.
Base payback on realised monthly cash benefit - not the launch date or assumed full-volume output.[8][9]
Apply this method to the monthly ledger below.
Hypothetical UK support workflow - not a reported company result. Ledger exercise starting 1 January 2026:
- 1,000 support tickets per month
- Average handling time: 12 minutes
- Fully loaded human support cost: £24.00 per hour
- AI-assisted tickets: 20% initially, reaching 60% by June
- Implementation and integration: £18,000.00 in January
- Training and process design: £3,000.00 in January
- Model usage: £0.55 per AI-assisted ticket
- Hosting and monitoring: £600.00 per month
- Support and maintenance: £1,200.00 per month
- Human review: 4 minutes per AI-assisted ticket
- Cash benefit per AI-assisted ticket: £0.80
Monthly ledger at 60% adoption:
Ledger line Amount AI-assisted tickets 600 Cash benefits £480.00 Model usage £330.00 Human review: 600 × 4 minutes × £24.00/hour £960.00 Hosting and monitoring £600.00 Support and maintenance £1,200.00 Operating net cash flow before setup costs −£2,610.00 Carry each month’s net cash flow into the cumulative balance. If it never reaches zero by 31 December 2026, label the result No payback within the modelled period.
Next, test the same calculation using conservative, expected and upside assumptions.
Compare Conservative, Expected and Upside Cases
Vary adoption, eligible volume, model usage, review rates, error reduction and labour costs - not just the final benefit total. Check payback against each case’s monthly schedule. Label any unrecovered investment No payback within the modelled period.
For evidence confidence, use high for audited records, medium for a representative pilot and low for untested forecasts.
These illustrative cases are separate planning assumptions, not extensions of the ledger exercise.
Illustrative case Attributable financial benefits Incremental AI costs Net value ROI Payback Evidence confidence Conservative £45,000.00 £25,000.00 £20,000.00 80.00% 10 months High Expected £85,000.00 £30,000.00 £55,000.00 183.33% 6 months Medium Upside £120,000.00 £35,000.00 £85,000.00 242.86% 4 months Low
Conclusion: Check Results Before Expanding
Expand only when financial results and quality controls meet agreed thresholds. Require an auditable baseline, proof that the gains come from the agent and the full cost of ownership. Keep freed-up capacity separate from cash returns, and use the same definition of net value throughout.
Keep Records and Update ROI
Once you’ve calculated ROI, lock the evidence trail before expanding. Assign one owner to approve the final reconciled dataset, and use only approved data in the ROI model.
Reconcile agent logs with invoices, workforce records and service reports. Check a sample of outputs for incorrect advice, exposed personal data, skipped approvals and actions outside the agent’s permitted scope. Profit does not excuse control failures.
Keep the minimum source records, dates, formulas, approvals and agent-version history needed to reproduce the calculation. Review ROI monthly during the pilot and quarterly once stabilised. Recalculate after material changes to pricing, scope, staffing or escalation rules. Then record the decision: continue, redesign, expand or stop.
Plan Measurement Before Deployment
Agree the baseline period, cost-allocation rules, attribution method, quality thresholds and review dates before launch. This prevents cherry-picking after the results are in and makes measurement part of implementation.
FAQs
How can I measure ROI without reliable pre-AI data?
When reliable pre-AI data isn’t available, focus on unit economics and infrastructure-as-code governance. Define workload units, such as cost per 1,000 inferences, and use simulation modes to forecast costs before deployment.
Build a baseline using 60–90 days of production metrics. Track task completion, retries and the cost of human intervention to identify minimum usage. Monitor cost per successful task and set spending limits in pounds (£).
What adoption rate would make my AI agent break even?
First, record your performance and costs before using AI. Calculate cost per successful task by dividing your total delivery spend by the number of accepted tasks. Include model usage, tools, retries, recovery, support and human review in that spend.
Your break-even adoption rate is the level at which savings per task compared with your manual baseline, multiplied by the number of successful agent-driven tasks, cover your implementation and running costs.
How should I allocate costs shared by several AI agents?
Group shared costs with key-value tags such as project, team or environment. For complex inference workloads, use Virtual Tags or identity-based attribution to automate cost allocation and track spending by user or project.
For shared infrastructure, track unit costs, such as cost per agent task or per 1,000 inferences, to align budgets. Keep model, tool and infrastructure costs separate so you can see how much each contributes to the total cost in £.