
Istio simplifies managing microservices but requires rigorous testing to ensure stability and cost efficiency. Here's what you need to know:
- Why Test Istio? Misconfigurations can cause HTTP 503 errors and outages. Testing ensures routing, resilience, and performance are reliable.
- Challenges: Issues like configuration delays, latency overheads, and observability gaps often arise.
- Best Practices: Use tools like
istioctl analyzefor static checks, dry-run validations to catch errors early, and enforce policies to avoid configuration conflicts. - Traffic Management: Test
VirtualServicesandDestinationRulesfor proper routing and resilience. Use fault injection to simulate failures and chaos testing to validate system stability. - Observability: Metrics from Prometheus and distributed tracing in Jaeger help monitor performance and debug routing issues.
- Performance Testing: Benchmark Envoy proxies to measure Istio's resource usage and cost impact. Ambient mode reduces CPU and memory usage significantly.
- DevOps Integration: Incorporate testing into CI/CD pipelines using layered validation, GitOps workflows, and governance standards.
Testing Istio ensures your service mesh is reliable, cost-effective, and resilient under load. Let’s dive into the details.
Istio Telemetry: Complete Guide to Metrics, Traces & Logs | Service Mesh Observability
Configuration Validation Best Practices
Before deploying configurations to production, it’s essential to validate your manifests to ensure they are correct, complete, and compliant. Using static validation early in the development process can help prevent costly mistakes from making their way into production. To secure your mesh configuration, it’s worth incorporating static analysis, dry-run validations, and policy enforcement into your workflow.
Static Configuration Analysis with istioctl
The istioctl analyze command is a read-only diagnostic tool designed to spot potential issues in Istio configurations. It works by analysing live clusters, local manifest files, or both, without making any changes to the cluster state.
Analysis never changes configuration state. It is a completely read-only operation that will never alter the state of a cluster.[8]
This tool can catch schema violations, identify missing namespace injection labels, and flag unreachable VirtualService rules [8][10]. For example, running istioctl analyze <file.yaml> allows you to validate specific manifests against the current cluster state before applying them with kubectl apply. This helps detect issues such as host mismatches or missing gateways [8].
In CI/CD pipelines, the --use-kube=false flag enables offline validation of configuration sets, ensuring they are schema-valid and consistent before deployment [8]. Teams in the UK can also enable background analysis by setting istiod.enableAnalysis=true during installation. This feature continuously writes validation messages into the status subresource of affected resources [8].
Some common errors flagged by istioctl analyze include:
- IST0101: ReferencedResourceNotFound
- IST0102: NamespaceNotInjected
- IST0106: SchemaValidationError
- IST0130: VirtualServiceUnreachableRule [10]
To suppress warnings that are known or unavoidable, use the --suppress CLI flag or add the galley.istio.io/analyze-suppress annotation to specific resources [8]. It’s also crucial to match the version of istioctl with your Istio control plane version to avoid compatibility issues [9].
Dry-Run Validation with Kubernetes
Using kubectl apply --dry-run=server activates Istio’s validating webhook, which checks the schema and basic logic of configurations before they are applied [11]. This server-side validation operates on a fail-close principle: if the configuration is invalid or the webhook is unreachable (e.g., if istiod is down), the request will be rejected, protecting the mesh from broken configurations [11].
Validation is fail-close. If the istiod pod is not ready, configuration cannot be created and updated.[11]
The dry-run process validates resources across multiple Istio API groups, including networking.istio.io, security.istio.io, telemetry.istio.io, and extensions.istio.io [11]. However, while this method catches schema and syntax errors, it may miss semantic issues, such as a VirtualService referencing a non-existent Gateway. To address these gaps, combine dry-run=server with istioctl analyze <file> --use-kube=true, which simulates applying the YAML to the live cluster and detects cross-resource conflicts [8].
To avoid errors during dry-run, ensure the istio-validator webhook is active and the caBundle is valid. Confirm that istiod pods are ready and the webhook is accessible to prevent no endpoints available
errors [11]. If certificate errors arise, verify the caBundle in the ValidatingWebhookConfiguration - Istio must have write access to update this configuration for secure communication between the API server and the webhook [11]. When testing changes to subsets in DestinationRules, use dry-run to validate the manifest but always apply the DestinationRule before the VirtualService that references it to avoid 503 errors during the consistency propagation period [2].
Policy Enforcement for Configuration Standards
In addition to static checks and dry-runs, enforcing configuration policies can further stabilise your mesh. Istio provides built-in mechanisms for this. For example, the exportTo field in VirtualServices and DestinationRules restricts resource visibility to specific namespaces, preventing accidental cross-namespace overrides [2]. Setting exportTo: "." ensures a VirtualService is only visible within its own namespace, helping maintain isolation and avoid unintended global routing changes [2].
To ensure reliability across the mesh, standardise settings like timeouts, retries, and circuit breakers in your configurations [1]. Codifying these policies in templates helps reduce the risk of inconsistent or unsafe settings being introduced by individual teams.
For automated pipelines, integrate istioctl analyze --use-kube=false into your CI/CD workflows. This catches errors such as missing injection labels or host mismatches before they reach the cluster [8]. The istio-validator webhook is configured with a default timeout of 10 seconds to prevent admission requests from hanging indefinitely [11].
| Validation Strategy | Tool/Mechanism | Timing | Primary Benefit |
|---|---|---|---|
| Static Analysis | istioctl analyze |
Pre-deployment | Identifies logic and schema errors in CI/CD |
| Admission Control | ValidatingWebhook |
Deployment-time | Blocks invalid manifests at the API level |
| Background Analysis |
istiod (enableAnalysis) |
Post-deployment | Monitors resource health continuously |
| Visibility Control |
exportTo field |
Runtime | Enforces namespace-level isolation |
| Resilience Standards | VirtualService |
Runtime | Ensures consistency in timeouts and retry logic |
For organisations needing more advanced policy enforcement, tools like Open Policy Agent (OPA) can be integrated with Istio. OPA can enforce custom rules, such as requiring mutual TLS (mTLS) for all service communications or setting default timeouts across the mesh. These policies are validated during admission, ensuring only compliant configurations are accepted into the cluster.
Testing Traffic Management and Resilience
Once static validation is complete, the next step is to ensure traffic flows as expected. Istio relies on VirtualServices to dictate how requests reach services and DestinationRules to define policies at the destination. Testing these configurations is critical to confirm that your service mesh handles both regular operations and failure scenarios smoothly.
Validating Virtual Services and Destination Rules
For Istio to apply policies defined in a DestinationRule, the associated VirtualService must explicitly route traffic to the specified subsets. Avoid relying on default round-robin routing - always reference the configured subsets directly.
When defining hosts in your configuration, use Fully Qualified Domain Names (FQDN). Istio resolves namespaces in a specific order: client namespace, service namespace, and finally the root namespace (istio-system).
When making configuration updates, adopt a make-before-break
approach:
- Add new subsets to your DestinationRules and allow a brief propagation period.
- Then, update your VirtualServices to reference the new subsets.
- Conversely, remove references from VirtualServices before deleting subsets in DestinationRules to avoid 503 errors during transitions.
To manually verify routing, you can use the following command:
kubectl exec $(kubectl get pod -l app=curl -o jsonpath='{.items[0].metadata.name}') -- curl -sS http://service:port/path
This ensures that internal routing behaves as expected. Keep in mind that a VirtualService bound only to a gateway won’t impact internal mesh traffic. To apply rules internally and externally, include the reserved word mesh in the gateways list.
These foundational tests set the stage for more advanced traffic control strategies like progressive delivery.
Progressive Delivery: Canary Releases and Fault Injection
Progressive delivery techniques, such as canary releases, allow you to introduce new versions gradually, minimising risks to production users. Start by creating a VirtualService with a default route for each service. This ensures that new versions won’t inadvertently receive uncontrolled traffic upon deployment.
To test new routing rules or fault injections without disturbing real users, use match conditions in VirtualServices. For instance, routing based on a header like end-user: test-user enables internal testers to validate changes. Place specific match rules at the top of the configuration, followed by a catch-all default at the bottom, as rules are processed sequentially.
Fault injection operates at the application layer (L7), enabling tests for specific HTTP error codes or latency delays. In one example from the Bookinfo application, testers introduced a 7-second delay between reviews:v2 and the ratings service. This revealed a misconfiguration: while reviews:v2 had a 10-second timeout, the upstream productpage service had a shorter aggregate timeout of 6 seconds (3 seconds plus one retry) [4]. To avoid such issues, injected delays should exceed the calling service’s timeout but remain within the downstream service’s limits. You can monitor response times using browser Developer Tools to confirm they match the configured fixedDelay.
| Fault Type | Configuration | Simulates | Use Case |
|---|---|---|---|
| Delay |
fixedDelay and percentage |
Network congestion or overloaded upstream service | Testing timeout and retry behaviour |
| Abort |
httpStatus and percentage |
Service crashes or TCP failures | Validating error handling and fallback mechanisms |
With these strategies in place, you can move on to chaos testing to evaluate resilience under failure conditions.
Chaos Testing for Resilience Validation
Chaos testing ensures that your service mesh can handle failures gracefully, allowing for partial service degradation rather than a complete breakdown. The goal is to keep the application functional, even if some services are unavailable.
In a controlled chaos test with the Bookinfo application, testers terminated the details service across all pods (using a command like pkill ruby). The application remained operational, displaying book reviews and basic information while showing a friendly details unavailable
message instead of failing entirely [5]. This demonstrated Istio’s ability to reroute traffic effectively during disruptions, thanks to its load balancing and health check features.
Circuit breakers, configured in DestinationRules, further enhance resilience by enabling fast failure for overloaded services. To validate circuit breakers, you can use tools like fortio to simulate high concurrency. For example, in a test with the httpbin service, a DestinationRule was configured with maxConnections set to 1 and http1MaxPendingRequests set to 1. With two concurrent connections, 15% of requests failed, while with three concurrent connections, failure rates jumped to 63.3% - proving the proxy’s effectiveness in protecting services [12].
Outlier detection adds another layer of resilience by ejecting unhealthy instances from the load-balancing pool temporarily. You can test this by simulating consecutive 5xx errors from a specific pod. Istio should automatically remove the failing instance while continuing to serve traffic from healthy ones.
These tests not only validate traffic management but also ensure that your mesh can withstand real-world challenges, maintaining stability and user experience.
Using Observability Tools for Testing
Building on configuration validation and traffic management, observability testing adds another layer of assurance to ensure the reliability and performance of the service mesh. To test Istio effectively, having a comprehensive view of the mesh is essential. Tools like Prometheus, Grafana, Kiali, and Jaeger play a key role in this process. Prometheus collects metrics from the Istio control plane (istiod), gateways, and Envoy sidecars [14]. Grafana transforms this data into visual dashboards, while Kiali offers a real-time view of the service topology [14]. Meanwhile, Jaeger enables tracking of individual request paths, which is crucial for verifying routing logic and pinpointing timeout issues [13][14].
Previous tests highlight how observability tools can identify timeout mismatches between services - problems that are nearly impossible to catch manually. By working together, these tools provide the precise metrics needed for thorough testing. Beyond just confirming configurations, they also help validate ongoing resilience and performance.
Key Metrics for Monitoring and Validation
When testing, focus on metrics that reflect the system's health. For example:
-
istio_requests_total: Tracks request success rates and flags 4xx/5xx errors. -
istio_request_duration_milliseconds_bucket: Measures latency percentiles (e.g., P95, P99) during load testing [3][15]. -
istio_tcp_connections_opened_total: Monitors connection churn and identifies potential TCP connection leaks [3][16]. -
istio_request_bytes_sum: Detects unexpected spikes in data transfer, which could signal configuration issues.
Envoy sidecars provide a mix of mesh and application metrics, accessible at :15020/stats/prometheus [14]. If STRICT mTLS is enabled, you'll need to configure Prometheus with Istio certificates to collect these metrics [14]. For large-scale testing, consider using recording rules to aggregate metrics across pods and instances. This approach reduces query latency and eases resource usage [3]. Keep in mind that Istio's default Prometheus setup retains data for only six hours, so plan your testing sessions accordingly [3].
Distributed Tracing for Routing and Performance Insights
While metrics give a quantitative snapshot of performance, distributed tracing offers a deeper look into the flow of requests. Tracing helps verify routing paths and captures retries and timeouts. By default, Istio samples traces at a rate of 1%, meaning at least 100 requests are needed to generate a single trace in Jaeger [13]. During testing, increase the sampling rate to ensure you collect enough data, especially when testing fault injection scenarios.
For tracing to work, applications must forward the correct request context headers. Without these, Envoy cannot maintain the trace spans necessary for full visibility [15]. When validating new routing rules, use Jaeger to confirm that traffic is flowing through the intended service versions and that retries are functioning as expected. Additionally, the response_flags label in Istio metrics can help distinguish between application-level errors and mesh-level issues, such as circuit breaker trips or timeouts [15].
Dashboards and Alerts for UK Production Environments
Istio provides detailed dashboards for monitoring global, service-level, and performance metrics [17]. The Performance Dashboard is particularly helpful during load testing, as it tracks the CPU and memory usage of Envoy proxies, ensuring that sidecar overhead stays within acceptable limits [17].
For UK production environments, alert configurations should align with standard business hours (09:00–17:30 GMT/BST). Escalation policies should differentiate between immediate responses during working hours and critical-only alerts outside of these times. To avoid confusion during the switch to British Summer Time, synchronise all observability tools to UTC/GMT. For critical production alerts, use recording rules set to 5-second intervals for high-resolution data [3]. Additionally, implement hierarchical federation to aggregate data from an Istio-specific Prometheus instance into a centralised production system [3].
Need help optimizing your cloud costs?
Get expert advice on how to reduce your cloud expenses without sacrificing performance.
Performance Testing and Cost Optimisation
::: @figure 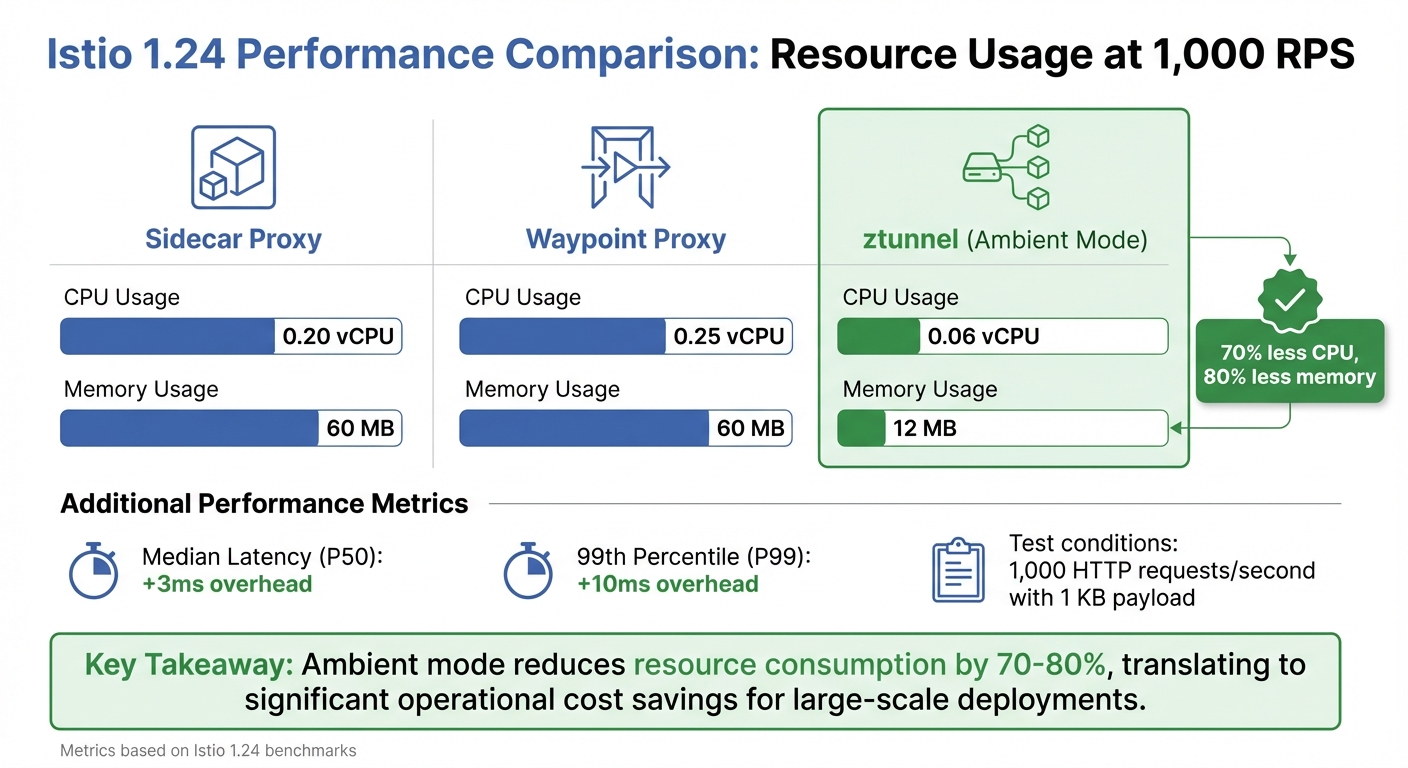 {Istio Performance Comparison: Sidecar vs Ambient Mode Resource Usage}
:::
{Istio Performance Comparison: Sidecar vs Ambient Mode Resource Usage}
:::
Once observability is in place, the next step is evaluating Istio's performance impact and its associated costs. At scale, the data plane - primarily the Envoy proxies - uses significantly more resources than the control plane. This makes it essential to benchmark these proxies for effective capacity planning and cost management.
Benchmarking Istio Performance
To measure Istio's overhead, test in three configurations: baseline (no proxies), server-only, and both proxies enabled [7][18]. This method helps pinpoint the additional latency and resource usage caused by Istio. For example, in Istio 1.24, a single sidecar proxy handling 1,000 HTTP requests per second (with a 1 KB payload) consumes 0.20 vCPU and 60 MB of memory [18]. At this load, the mesh adds approximately 3 milliseconds to median latency (P50) and 10 milliseconds to the 99th percentile latency (P99) [7].
| Component (Istio 1.24) | CPU Usage (per 1k RPS) | Memory Usage |
|---|---|---|
| Sidecar Proxy | 0.20 vCPU | 60 MB |
| Waypoint Proxy | 0.25 vCPU | 60 MB |
| ztunnel (Ambient) | 0.06 vCPU | 12 MB |
These metrics are critical for both capacity planning and cost management. Features like telemetry (e.g., access logging and tracing) can increase CPU usage and tail latency [7][18]. To accurately assess their impact, run tests with and without these features. Avoid using the demo
installation profile for benchmarking, as its heavy tracing and logging can distort results. Instead, opt for the default
or production-tuned profiles [7]. These benchmarks establish a baseline for conducting realistic load tests under varied traffic conditions.
Load Testing for Realistic Scenarios
Building on the benchmarking results, real-world traffic scenarios involve more than just raw throughput - they also include multiple concurrent connections. To simulate this, increase both throughput and the number of concurrent connections during testing [7]. Tools like Fortio are excellent for constant throughput testing, while Nighthawk (built on Envoy) handles more complex load profiles [18]. For simulating intricate service topologies, Isotope is a great option for creating synthetic application graphs [18].
During load tests, monitor the istio_request_duration_milliseconds_bucket metric to track latency percentiles. If you notice unexpected spikes in P99 latency, investigate whether proxies are CPU-throttled or if telemetry filters are causing worker thread queuing [18]. To reduce memory usage in large service meshes, use the Sidecar resource to limit the number of services each proxy monitors [7][1]. These tests provide valuable insights for optimising infrastructure costs.
Cost-Aware Optimisation Strategies
Performance and load testing often highlight areas where costs can be reduced. For example, minimising unnecessary configuration state can lower proxy resource usage, directly cutting operational expenses. By using the Sidecar resource and the exportTo field in VirtualServices, you can prevent proxies from tracking excessive configuration data, which can otherwise inflate memory usage [18][2].
For cost-sensitive workloads, consider Istio's ambient mode. The ztunnel proxy in this mode is far more resource-efficient, consuming just 0.06 vCPU and 12 MB of memory per 1,000 RPS - a substantial improvement over traditional sidecars [18].
At scale, with lots of application containers, the data plane's memory and CPU usage quickly eclipses that of the Istio control plane.– Megan O'Keefe, John Howard, and Mandar Jog, Google [7]
Use benchmarking data to calculate the sidecar tax
and adjust Kubernetes node requests and limits accordingly [18]. Additionally, set up Prometheus recording rules to aggregate metrics at the workload level, which helps reduce the resource consumption of your monitoring stack [3]. For UK businesses, these strategies can lead to significant savings, especially when combined with appropriately sized nodes and autoscaling [7]. For more tailored cost-saving solutions, Hokstad Consulting (https://hokstadconsulting.com) offers services that specialise in reducing cloud expenses by 30–50% through customised infrastructure optimisation.
Integrating Istio Testing into DevOps Workflows
To ensure only well-tested changes make it to production, integrating thorough Istio testing into your DevOps workflows is essential. By embedding this into your CI/CD pipelines, you can catch configuration issues early while keeping development moving at a steady pace. Aim to keep integration tests efficient, ideally under 30 minutes [19].
Creating a Layered Test Pipeline
A solid testing strategy involves multiple layers of validation. At the pre-merge stage, run tests for every Pull Request using the Istio Test Framework on local KinD (Kubernetes-in-Docker) clusters [20]. This ensures configuration logic is verified before changes reach the main branch. In the staging phase, replicate realistic traffic patterns across clusters and apply the make-before-break principle when rolling out subset updates [2]. Finally, in production, combine canary releases with chaos testing - like terminating pods - to confirm Istio can handle failures gracefully, avoiding cascading disruptions [5][1].
| Pipeline Stage | Tooling/Practice | Primary Objective |
|---|---|---|
| Pre-merge (Local/CI) | Istio Test Framework + KinD | Logic validation and integration testing [20] |
| Staging |
istioctl + Make-before-break |
Validating configuration propagation and avoiding 503 errors [2] |
| Production | Canary Releases + Chaos Testing | Ensuring resilience and gradual degradation under failure [5][1] |
This multi-layered approach complements early configuration validations, ensuring a seamless transition through each stage.
GitOps for Declarative Configuration Management
Istio's reliance on Kubernetes Custom Resource Definitions (CRDs), such as VirtualServices and DestinationRules, makes it a natural fit for GitOps workflows [1]. Store all mesh configurations in version control and use istioctl analyze during pre-merge pipelines to catch issues before they escalate to production [6]. For larger deployments, consider breaking down bulky VirtualService files into smaller, path-specific fragments. This allows for better team ownership and reduces the potential impact of changes [2]. Additionally, leverage the exportTo field to restrict configuration sharing across namespaces, ensuring that team-specific policies don’t unintentionally affect the entire mesh [2].
Governance and Standards for Mesh Testing
Shared standards are key to avoiding configuration drift and ensuring consistent behaviour across environments. Set up a VirtualService with a default route for every service as soon as it’s deployed, even if only one version exists [2]. This prevents new versions from receiving traffic before routing rules are established. Define global defaults for timeouts and retries in meshconfig.rootNamespace (commonly istio-system) to maintain reliability [2][1]. Since Istio disables HTTP timeouts by default and retries HTTP requests twice before returning an error [1], standardising these settings across all services is crucial. Tag integration tests with feature labels to track coverage and identify which parts of the mesh are validated in your CI pipeline [19].
For UK companies managing intricate service meshes, organisations like Hokstad Consulting (https://hokstadconsulting.com) provide DevOps transformation services to establish governance frameworks and streamline deployment cycles effectively.
Conclusion
Testing Istio deployments requires a well-rounded approach that covers configuration checks, traffic management, observability, and cost efficiency. To avoid 503 errors, always update DestinationRules to include new subsets before making changes to VirtualServices [2]. From the outset, define clear default routes for every service to ensure traffic policies, such as circuit breakers, function as intended [2]. This layered approach not only validates configurations but also strengthens system resilience.
Resilience testing, including fault injection and chaos engineering, is key to uncovering issues like fixed timeouts and cascading failures before they affect production environments [4][1]. For large-scale observability, using Prometheus recording rules to aggregate metrics at the workload level can significantly cut storage costs and enhance query performance [3][16].
With Istio 1.24, the traditional sidecar proxy consumes around 0.20 vCPU and 60 MB per 1,000 RPS, whereas ambient mode’s ztunnel uses just 0.06 vCPU and 12 MB. This reduces CPU usage by about 70% and memory by 80% [18]. For UK businesses, this translates into tangible savings on operational costs.
Incorporating these testing methods into DevOps pipelines ensures resource efficiency goes hand in hand with operational stability. By embedding these practices through layered pipelines, GitOps, and clear governance standards, configuration errors can be caught early without slowing development. For organisations managing complex service meshes across multiple environments, working with specialists like Hokstad Consulting (https://hokstadconsulting.com) can help establish effective testing frameworks and optimise cloud infrastructure costs.
FAQs
What is Istio's ambient mode and how does it improve resource efficiency?
Istio's ambient mode introduces a more resource-efficient alternative to the traditional sidecar proxy model. Rather than assigning an Envoy sidecar proxy to every pod, it employs a single per-node L4-only proxy (called a ztunnel) alongside an optional waypoint proxy.
This setup dramatically cuts down on resource consumption, including CPU, memory, and network usage. The result? Better performance and reduced infrastructure expenses, offering a smarter way to manage service mesh deployments.
How does using static analysis with istioctl benefit CI/CD pipelines?
Integrating istioctl's static analysis (istioctl analyze) into your CI/CD pipelines is a smart way to validate Istio configuration files or live clusters before deployment. This tool can flag potential issues like missing injection labels, syntax mistakes, or policy conflicts early in the process.
By identifying these problems ahead of time, you can avoid deployment failures, enhance the reliability of your service mesh, and simplify the rollout of changes with much greater confidence.
How does chaos testing help improve the resilience of an Istio service mesh?
Chaos testing is all about deliberately introducing faults - like shutting down pods or injecting delays - to mimic real-world system failures. The aim? To see how well Istio’s capabilities, such as routing, retries, and circuit breakers, manage these unexpected disruptions.
By uncovering vulnerabilities in a controlled environment, chaos testing allows you to address weak spots and build a more resilient service mesh. It also serves as a great way to test observability tools, ensuring you’re equipped to monitor and respond effectively when issues arise in production.