
Distributed systems like Kubernetes and microservices power today’s digital services but bring complexity. Monitoring them effectively is essential to ensure performance, reliability, and cost efficiency. Google’s four golden signals - latency, traffic, errors, and saturation - are key metrics that help teams understand system health and user experience.
- Latency: Measures request processing time, focusing on percentiles (e.g., p95, p99) to identify slow responses.
- Traffic: Tracks system demand (e.g., requests per second) to detect workload changes.
- Errors: Monitors failure rates (e.g., HTTP 5xx) to catch issues early.
- Saturation: Shows resource usage (e.g., CPU, memory) to prevent capacity bottlenecks.
These signals are interconnected. For example, high traffic can increase saturation, which may lead to higher latency and errors. They also support cost management by identifying underused resources or optimising scaling strategies.
To implement, use tools like Prometheus and Grafana for consistent monitoring, build dashboards to track metrics, and set Service Level Objectives (SLOs) for reliability. Alerts should focus on user impact, not minor issues, ensuring actionable notifications. By starting small and expanding gradually, businesses can improve system performance while controlling cloud costs.
::: @figure 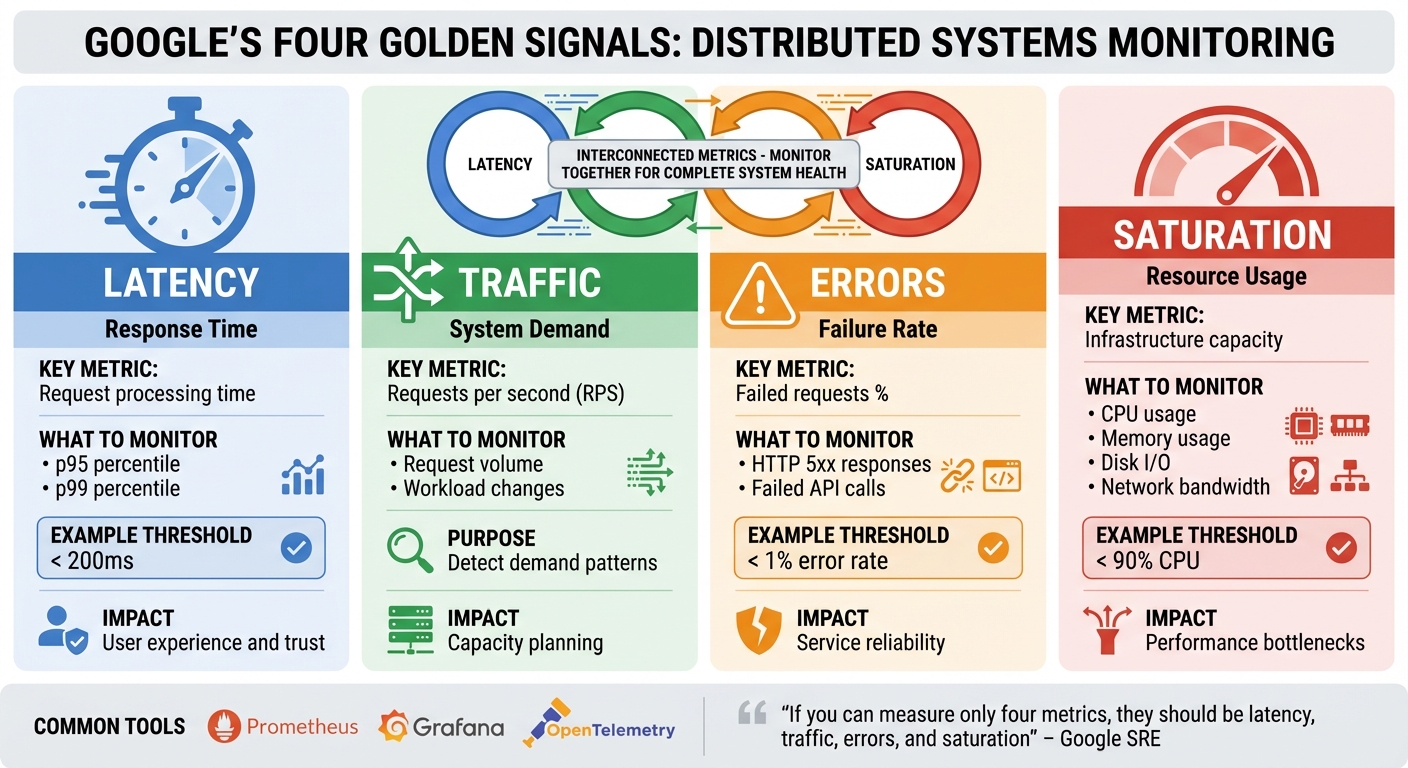 {The 4 Golden Signals of System Monitoring: Latency, Traffic, Errors, and Saturation}
:::
{The 4 Golden Signals of System Monitoring: Latency, Traffic, Errors, and Saturation}
:::
Google’s Golden Signals with the OpenTelemetry Demo and Grafana
The 4 Golden Signals Explained
The four golden signals form a comprehensive framework for understanding system performance, with each signal offering a unique perspective. While they can be valuable individually, their real strength lies in being monitored together, as they are deeply interconnected. As Google's SRE guidance puts it, if you can measure only four metrics, they should be latency, traffic, errors, and saturation
[4].
For instance, when traffic doubles, resource saturation often rises as the system works harder to handle the increased demand. If saturation becomes excessive - like when CPU usage hits 90% - latency spikes as requests take longer to process. This can lead to higher error rates, with requests timing out or being rejected. Monitoring these signals together not only reveals what’s happening but also helps pinpoint the root causes.
These metrics also help differentiate between various issues. High latency with low saturation might point to slow external dependencies, such as databases or third-party APIs. On the other hand, high saturation combined with increasing latency suggests that the system is nearing its capacity. Even when traffic and latency remain steady, a rise in error rates could signal hidden problems that need further investigation.
Tools like Prometheus and Grafana are commonly used to track these metrics. Many teams also adopt RED metrics (Rate, Errors, Duration) on their dashboards to complement the golden signals and keep a close eye on performance.
Let’s break down each signal to understand its specific influence on system performance.
Latency: Measuring Response Times
Latency, the first golden signal, is crucial for user experience and closely ties to the other metrics. It measures the time between receiving a request and sending a response. In distributed systems, this is a key indicator of how users perceive system performance - slow responses can frustrate users, while fast responses foster trust.
Why percentiles matter more than averages:
Averages can be deceptive. That’s why many teams use percentiles, like the 95th (p95) or 99th (p99), to get a clearer picture of performance under real-world conditions.
Latency should be measured as a distribution. Prometheus, for example, offers histogram and summary metrics to capture latency distributions and calculate quantiles. This allows teams to set meaningful thresholds - like 200 milliseconds - and trigger alerts when these thresholds are exceeded.
Additionally, separating latency for successful and failed requests provides deeper insights. High latency for successful requests may indicate performance bottlenecks, while fast failures could point to issues like dependency problems or request validation errors.
Traffic: Understanding Throughput
Traffic measures the volume of requests your system processes over time, typically in requests per second (RPS) or requests per minute (RPM). This metric reflects demand and directly impacts other signals.
As traffic grows, systems often experience higher resource utilisation. More requests can increase saturation, which might then cause latency to rise if the system struggles to keep up. By establishing baseline traffic patterns and monitoring deviations, teams can implement auto-scaling strategies - such as those in Kubernetes - to maintain consistent performance.
In cloud-native setups, traffic is monitored at multiple levels. Load balancers distribute incoming requests evenly, API gateways detect anomalies (like unexpected spikes in a payment API), and service meshes provide granular metrics on per-route or per-service traffic. This data not only helps with capacity planning but also ensures resources are allocated efficiently, keeping costs under control.
Errors: Identifying Failures
Errors track the rate of failed or incorrect responses, offering a clear signal when something goes wrong. Instead of just counting errors, it’s more effective to measure the error rate as a percentage of total requests over short intervals.
It’s important to distinguish between user-facing errors, such as HTTP 5xx responses or failed API calls, and internal errors that may not immediately affect users but could escalate into larger issues. Internal errors often serve as early warnings for potential system-wide problems.
When analysed alongside other signals, errors reveal patterns. For example, a spike in HTTP 429 (rate limit) errors might indicate that a downstream service is struggling, leading to excessive retries. By correlating error rates with latency and saturation, teams can quickly identify whether an issue is a temporary glitch or a systemic problem, enabling faster fixes.
Saturation: Resource Utilisation
Saturation measures how much of your system’s resources - like CPU, memory, disk I/O, or network bandwidth - are being used at any given moment. While the other signals focus on user-facing impacts, saturation gives insight into the workload on your infrastructure.
As saturation increases, performance often degrades. For instance, at 90% CPU usage, requests may be delayed. High memory usage can lead to frequent garbage collection or even swapping, and network saturation might cause packet loss. These issues can result in a poor user experience, making it essential to monitor saturation and scale resources proactively.
How to Implement Golden Signals in Cloud-Native Systems
Instrumentation and Data Collection
To implement golden signals effectively, start with consistent instrumentation across all services. With tools like OpenTelemetry SDKs, you can automatically trace and time every HTTP or RPC request using client and server middleware. This approach ensures that critical metrics - latency, traffic, errors, and saturation - are consistently captured, regardless of which team manages a specific microservice.
A shared metrics schema is key to maintaining uniformity. For instance, define http.server.duration for latency histograms, http.server.requests for tracking traffic, and http.server.errors for error counts. For saturation, combine application-level metrics, like queue depth, with platform metrics such as CPU and memory usage, which can be gathered from Kubernetes container exporters.
In Kubernetes environments, deploy the OpenTelemetry Collector as a sidecar or DaemonSet. This setup collects OTLP data, exports metrics to Prometheus, and sends traces to Jaeger. By packaging these configurations into a base Helm chart, every new microservice can automatically expose a /metrics endpoint with standard labels like service, env, and version.
To streamline troubleshooting, use correlation IDs from the API gateway. These IDs link metrics, logs, and traces, allowing operators to quickly move from a high-latency alert on a dashboard to the related slow traces in Jaeger. This makes it easier to pinpoint bottlenecks along the critical path.
Building Dashboards and Alerts
Dashboards should provide a clear view of service performance, focusing on uptime, latency, and load. A tiered dashboard layout is effective: start with an overview of service health, then drill down into each golden signal, and finally, include detailed breakdowns for dependencies. For example, display p50, p95, and p99 latency values for key endpoints, monitor request rates and concurrency for traffic, and categorise errors by HTTP status codes. To assess saturation, include metrics like CPU, memory, and queue depth, along with capacity thresholds.
For alerts, focus on symptoms rather than root causes. For example, trigger alerts if the five-minute rolling p95 latency exceeds SLO targets for ten minutes or if error rates surpass 1%. To minimise noise while ensuring timely detection, use multi-window, multi-burn-rate strategies. Include links to runbooks in your alerts to speed up issue resolution.
This structured approach provides a solid foundation for monitoring and responding to system performance issues.
Hokstad Consulting's Approach
Hokstad Consulting applies these principles by integrating golden signal monitoring into DevOps pipelines and cloud cost management. By leveraging automated CI/CD and Infrastructure as Code, they help UK businesses accelerate deployment and optimise infrastructure costs.
Need help optimizing your cloud costs?
Get expert advice on how to reduce your cloud expenses without sacrificing performance.
Creating SLOs and Alerts with Golden Signals
Once you’ve set up and started monitoring the golden signals, the next step is to turn those metrics into actionable reliability targets and meaningful alerts.
Building Service Level Indicators (SLIs)
Service Level Indicators (SLIs) are designed to measure what users actually experience, translating the four golden signals into specific, measurable targets. These indicators focus on the end-user impact rather than internal metrics.
For latency, SLIs should include clear percentile-based thresholds. For example: 99% of checkout API requests complete in under 500 milliseconds
or 95th percentile end-to-end latency for the orders API remains below 250 milliseconds.
Error rate SLIs track the ratio of successful requests to total requests. Examples include: The proportion of HTTP 5xx responses over total requests in a five-minute window
or 99.9% of payment transactions succeed.
These metrics directly reflect whether users can achieve their intended actions without disruptions.
Traffic SLIs, on the other hand, monitor throughput to confirm the system performs well under varying levels of demand. For instance: Requests per second during UK peak trading hours (09:00–17:30 GMT)
or Messages processed per second for the order queue.
While traffic might not be a direct reliability target, it provides critical context for understanding how latency and error SLIs behave during demand surges.
Setting Service Level Objectives (SLOs)
Service Level Objectives (SLOs) define the target reliability level for each SLI over a specific time frame. These objectives should reflect real user needs and business goals, rather than aiming for unnecessarily high levels of perfection. For instance, a 99.999% availability target may sound impressive, but it’s often prohibitively expensive in cloud environments and exceeds what users typically require.
For UK-based organisations, it’s wise to align SLO timeframes with local usage patterns. For example, B2B services primarily used during UK working hours (09:00–17:30, Monday to Friday) might warrant stricter reliability targets during those active periods, while allowing more leniency overnight. Similarly, e-commerce platforms should account for seasonal peaks like Black Friday, Cyber Monday, and the pre-Christmas shopping period (November to December) to ensure that latency and error targets remain realistic during high-demand times.
A well-defined SLO might look like this: Over a rolling 30-day period, 99.9% of minutes must have successful home page loads for UK users
or 99% of checkout API requests complete in under 500 milliseconds, and 95% in under 250 milliseconds.
For a 99.9% availability SLO over 30 days, this translates to an error budget of 0.1%, or approximately 43.2 minutes of downtime.
These objectives strike a balance between performance requirements and cost efficiency, ensuring resources are allocated based on real business needs, not theoretical ideals. Once SLOs are in place, the focus shifts to creating alerts that accurately reflect user-impacting conditions.
Alert Design Best Practices
Good alerting practices revolve around user impact, not minor infrastructure issues. As Google’s SRE book explains:
Every alert should correspond to a real user-affecting condition, or a condition that will imminently become user-affecting[4].
This approach reduces alert fatigue by filtering out irrelevant fluctuations that don’t affect service quality.
To make alerts more effective, use multi-window, multi-burn-rate alerting. This method captures both sudden outages and slower, ongoing degradations. For example, you could configure an immediate alert if a five-minute window exceeds 14.4× the allowed error rate, and a lower-severity alert if the one-hour rate exceeds 6× the permitted level[4]. This dual approach ensures both rapid response to critical issues and early detection of emerging problems.
Focus your alerts on key user journeys - such as checkout, payments, or login - rather than trying to monitor every microservice. Include links to runbooks in alert notifications to speed up resolution, and ensure alerts provide enough context (e.g., affected service, current error rate, SLO threshold) for on-call engineers to quickly assess the situation. For UK businesses, this targeted approach not only keeps operational costs in check but also ensures attention is directed towards issues that could impact revenue or customer satisfaction.
Conclusion and Next Steps
The four golden signals - latency, traffic, errors, and saturation - offer key insights into the health of user-facing systems, especially in complex, distributed architectures. By keeping a close eye on these metrics, organisations can catch unusual behaviour early, resolve issues faster, and stop problems from spiralling out of control[4][3].
But it’s not just about reliability. These signals also play a role in cloud cost management. By monitoring saturation and traffic, organisations can fine-tune capacity planning, enabling smarter autoscaling and rightsizing decisions. This approach helps cut down on over-provisioning, ensuring costs align more closely with actual user demand. For UK-based businesses, especially those running microservices or Kubernetes, this simplified, user-focused monitoring is a practical way to handle the complexity of managing numerous components[2][5][7].
If you’re ready to implement this, start small. Choose one critical service and set up a basic dashboard to track the golden signals, along with a few SLO-based alerts. Gradually expand this practice to cover all user-facing services. Incorporate logs and traces for a complete observability setup, and use trends in these metrics to guide capacity planning. To measure success, focus on outcomes like mean time to detect incidents, user-facing availability, and cost per unit of traffic[8][10][9][6]. This structured approach not only improves reliability but ensures resources are used where they’re needed most.
The rewards are both operational and financial. Hokstad Consulting, a specialist in DevOps and cloud infrastructure, helps UK businesses optimise their monitoring strategies and cloud costs. They offer services like golden-signal-based SLIs and SLOs, cloud-native instrumentation, and autoscaling alignment to cut cloud expenses by 30–50%[2][5]. Their track record includes up to 75% faster deployments and a 90% reduction in errors[1]. Hokstad Consulting can audit your current practices, integrate these improvements into your workflows, and ensure compliance with UK regulations, helping you achieve both efficiency and cost savings.
FAQs
What are the golden signals, and how do they enhance system performance and reliability?
The golden signals - latency, traffic, errors, and saturation - are crucial metrics for keeping an eye on distributed systems. These indicators offer a clear snapshot of system health and can pinpoint performance issues before they start affecting users.
When organisations monitor these signals, they can swiftly tackle problems like sluggish response times, spikes in errors, or resource overloads. This approach helps ensure systems stay dependable, scalable, and fine-tuned for user needs. Keeping track of these metrics is especially important in managing the complexities of distributed environments, where smooth operations are critical.
What are the best tools for monitoring the golden signals in distributed systems?
Monitoring the golden signals - latency, traffic, errors, and saturation - in distributed systems is crucial for maintaining performance and reliability. To do this effectively, you need tools that offer detailed metrics, visualisation, and alerting capabilities. Here are some popular options to consider:
- Prometheus: Great for real-time metric collection and querying. It's widely used for its reliability and flexibility.
- Grafana: Excellent for building custom dashboards to visualise system performance and spot trends.
- Elastic Stack (ELK): Ideal for aggregating and analysing logs, complementing your monitoring efforts.
- Datadog: A powerful platform that combines metrics, logs, and traces, specifically designed for distributed systems.
The best tool for your setup will depend on factors like your system's complexity, budget, and specific requirements. If you're unsure where to start or need help fine-tuning your monitoring strategy, experts like Hokstad Consulting can provide tailored solutions for distributed systems and cloud infrastructure.
How can businesses leverage golden signals to optimise cloud costs?
Golden signals - latency, traffic, errors, and saturation - are key metrics for keeping distributed systems running smoothly. By keeping an eye on these signals, businesses can spot inefficiencies and fine-tune their cloud infrastructure to save money.
Take latency, for instance. Monitoring it can uncover delays caused by sluggish services. Keeping tabs on traffic ensures resources are scaled correctly, meeting demand without unnecessary spending. Quickly addressing errors can stop downtime in its tracks, while keeping an eye on saturation ensures you’re not over-provisioning or leaving resources sitting idle.
Incorporating these golden signals into your monitoring approach allows you to strike the right balance between performance and cost.