
Cloud services are essential for businesses, but without clear cost visibility, you risk overspending. FinOps, or Cloud Financial Operations, helps by uniting finance, engineering, and business teams to track and manage cloud expenses in real time. Here's how FinOps improves cloud cost visibility:
- Real-Time Tracking: Instead of waiting for month-end reports, FinOps provides dashboards that show up-to-date costs, helping you spot inefficiencies immediately.
- Cost Accountability: Teams can see exactly how their decisions impact budgets, encouraging smarter spending.
- Detailed Allocation: Costs are broken down by team, project, or resource, ensuring every pound is accounted for.
- Automation: Tools and policies enforce tagging and cost controls, reducing manual errors and wasted resources.
For example, companies using FinOps have cut cloud costs by up to 30% by identifying unused resources and optimising processes. This approach ensures you stay on budget while maintaining performance.
Want to know how to implement these practices? Keep reading for actionable steps and real-world examples.
Navigating FinOps for Cloud Cost Management | Monitoring Course #5
What is FinOps and How Does It Improve Cloud Cost Visibility?
::: @figure 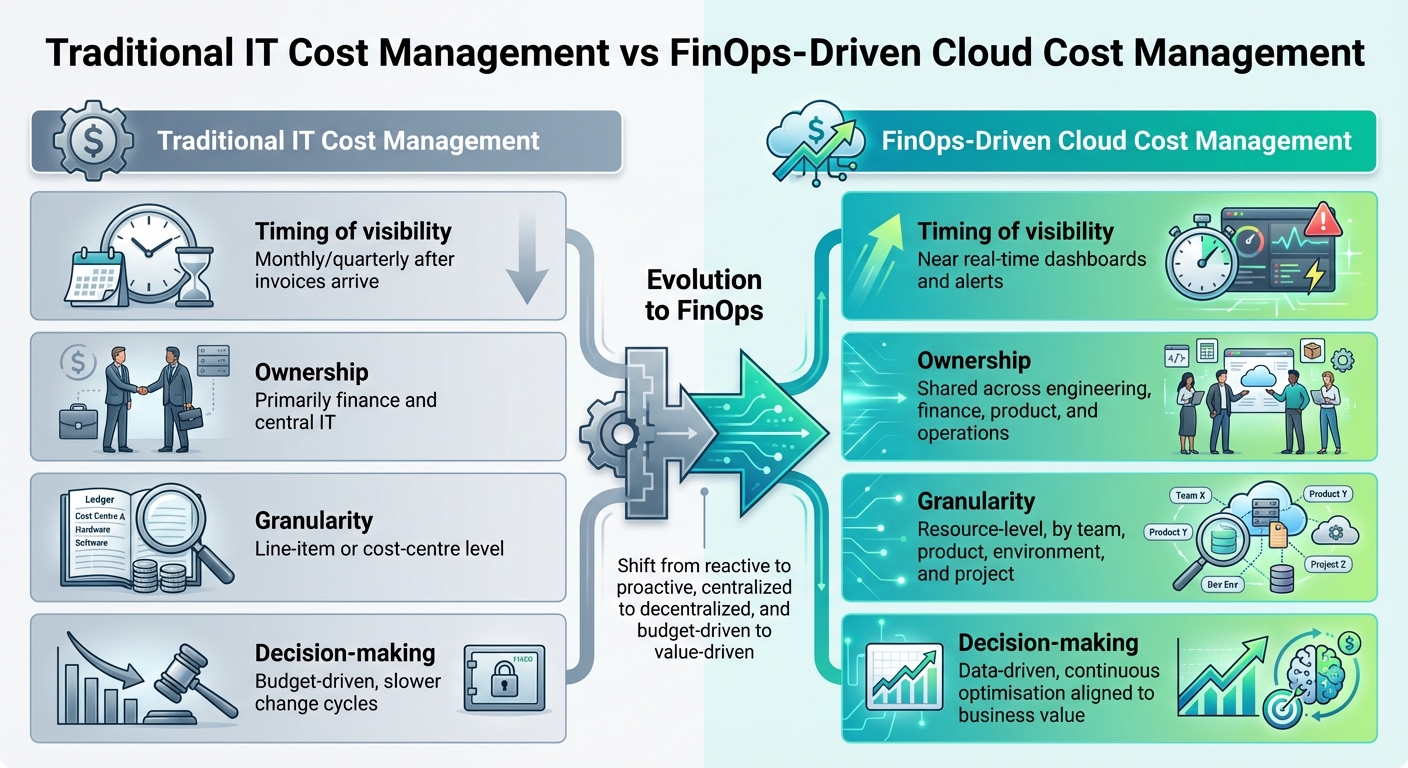 {Traditional IT Cost Management vs FinOps-Driven Cloud Cost Management}
:::
{Traditional IT Cost Management vs FinOps-Driven Cloud Cost Management}
:::
FinOps, short for Cloud Financial Operations, is a collaborative operating model designed to help organisations manage cloud expenses while maximising the value derived from their cloud investments. It unites teams across engineering, finance, product, and operations, making cloud cost management a shared responsibility. This approach reshapes how businesses understand and control their cloud spending.
At its core, FinOps operates on three guiding principles: collaboration, accountability, and transparency. By giving all stakeholders access to cost data, FinOps enables informed decisions about architecture, resource use, and purchasing strategies. Engineers can evaluate the financial impact of their designs, finance teams can create more accurate forecasts, and operations teams can optimise resource allocation. This foundational understanding sets the stage for exploring the principles behind FinOps and how they drive cost optimisation.
Core Principles of FinOps
Collaboration is the cornerstone of FinOps. Instead of finance teams chasing engineers for explanations, all teams work together from the outset. Engineers take ownership of the costs they influence, while finance provides tools and reports to monitor spending. This shared accountability ensures that cost considerations become a natural part of technical decisions, rather than an afterthought.
Transparency ensures that everyone has a clear view of where money is being spent. Unified dashboards offer detailed insights into costs across providers. For example, a developer can quickly spot that a test environment cost £2,400 last month and take immediate action to address it.
Accountability shifts cost management from a reactive process to a proactive, collaborative effort. Integrating cost data into tools like Jira or Slack allows engineers to see the financial impact of their work in real time. This approach encourages teams to solve problems together, with costs directly tied to specific business units or projects.
The Inform Phase of FinOps
The FinOps lifecycle begins with the Inform phase, which focuses on collecting, categorising, and presenting cloud cost data in a way that’s easy to understand. This phase pulls billing data into real-time, interactive dashboards, enabling teams to filter by services, accounts, or cost drivers. This ensures that engineers, finance teams, and executives have timely and accurate information - not just at month-end.
During this stage, organisations create detailed breakdowns of costs by business unit, project, or individual resource. These granular views help identify anomalies and establish spending baselines, reducing the risk of overspending. For example, automated dashboards might display 12-month spending trends, service-specific breakdowns, or month-over-month changes across multi-cloud environments. This real-time visibility allows teams to respond quickly to unexpected patterns. Once the data is accessible and organised, the next step is leveraging this visibility to drive optimisation.
Why Visibility Matters for Cost Optimisation
With clear cost allocation and real-time insights, organisations gain the ability to spot inefficiencies and act quickly. Without resource-level visibility, it’s nearly impossible to identify trends, anomalies, or unused resources that drive up costs. Visibility is the foundation for all FinOps practices, enabling accurate cost allocation and proactive adjustments, such as rightsizing underutilised instances.
Granular visibility also improves forecasting and budgeting, helping organisations avoid unexpected bills and align spending with business goals. For instance, a company might discover that 200 unused resources are costing £15,000 per month. Acting on this insight immediately prevents unnecessary expenses from spiralling out of control.
By building on this visibility, proven strategies can reduce infrastructure costs by 30% to 50% without compromising performance [1]. The key difference between traditional IT cost management and FinOps lies in its approach: moving from monthly reconciliations to near real-time dashboards, shifting ownership from finance alone to shared responsibility, and transitioning from high-level cost-centre reporting to detailed, resource-level insights.
| Aspect | Traditional IT Cost Management | FinOps-Driven Cloud Cost Management |
|---|---|---|
| Timing of visibility | Monthly/quarterly after invoices arrive | Near real-time dashboards and alerts |
| Ownership | Primarily finance and central IT | Shared across engineering, finance, product, and operations |
| Granularity | Line-item or cost-centre level | Resource-level, by team, product, environment, and project |
| Decision-making | Budget-driven, slower change cycles | Data-driven, continuous optimisation aligned to business value |
Building the Foundations for Cloud Cost Visibility
To achieve real-time, actionable insights into cloud spending, organisations must establish a solid foundation rooted in FinOps principles. This includes creating a clear account structure, implementing consistent resource tagging, and using cost management tools effectively. Without these, cost management efforts are often incomplete and less effective. [8][10]
Creating a Clear Account Structure
A well-organised account structure is key to understanding and managing cloud costs. By separating accounts by business domain (e.g., Retail, Wholesale, Internal IT), product, and environment (e.g., production, staging, development), organisations can gain precise visibility into spending. For instance, a UK company might use separate AWS accounts or Azure subscriptions labelled Retail-Payments-Prod
and Retail-Payments-NonProd.
This setup enables detailed cost reports, showing monthly spending per product and environment in pounds sterling, even for shared platform accounts like networking or security. [8][12][13]
Such a structure simplifies cost allocation, reduces disputes over cross-charging between business units, and enhances compliance reporting - especially critical in regulated sectors like financial services. [10][13] Using Infrastructure as Code (IaC) to define this structure ensures consistency and eliminates manual errors, which can often lead to gaps in cost visibility. This approach can also lead to significant savings, with infrastructure costs reduced by as much as 30%–50%. [1] This clarity aligns with FinOps' focus on transparency and precise cost allocation.
Setting Up Resource Tagging Standards
Consistent and meaningful tagging is another cornerstone of effective cost management. Key tags include CostCentre, BusinessUnit, Product/Service, Environment, Owner, and Project/ClientCode. These tags allow costs to be accurately attributed to departments (e.g., FIN-001
), UK cost centres, or specific client contracts, which are crucial for processes like showback, chargeback, and accurate financial reporting. [6][13]
For UK organisations, tagging is particularly important for reconciling cloud invoices with departmental budgets in GBP and meeting specific reporting needs, such as separating costs related to GDPR compliance. Tags like CostCentre (aligned with finance codes), BusinessUnit, and Project/ClientCode help ensure that spending is properly allocated to internal projects or external clients. [10][13]
To enforce tagging, organisations should adopt strict policies and automation tools. Policies define mandatory tags and assign accountability, while automation ensures compliance through methods like Terraform modules with required tags, cloud policy engines that block non-compliant resources, and regular reports highlighting untagged or mis-tagged items. [9][12] Incorporating tagging reviews into engineering ceremonies, like sprint reviews, and tracking KPIs such as percentage of spend with complete tags
can foster a culture where tagging is an integral part of the development process. Automated DevOps practices that embed these standards can dramatically reduce errors - by up to 90% - and speed up deployments by as much as 75%. [1] Accurate tagging is essential for the transparency and accountability that FinOps demands.
Using Cost Management Tools
Native tools like AWS Cost Explorer and Azure Cost Management can provide valuable insights when configured to group spending by account, subscription, and tags, with costs displayed in GBP. Dashboards that track daily and monthly spending trends, highlight top services, and break down costs by key dimensions are invaluable for both immediate decisions and long-term planning. [7][8][11]
However, for more complex needs - such as multi-cloud consolidation, custom metrics, or advanced allocation scenarios - exporting billing data to a data warehouse or BI tool becomes essential. This allows organisations to combine cost data with HR, CRM, or project information for deeper analysis, such as evaluating costs per customer, feature, or team. These insights, expressed in pounds and aligned with UK financial periods, support advanced capabilities like forecasting, anomaly detection, and scenario modelling (e.g., How will a 30% traffic increase in Q4 impact annual cloud spend?
). [8][10][12]
Specialist partners like Hokstad Consulting can help accelerate this process, offering expertise in designing account models, tagging schemes, and dashboards tailored to UK financial and reporting standards. By embedding these elements as code
in CI/CD pipelines, they ensure that visibility scales automatically as the cloud environment grows. This integration within DevOps practices guarantees that cost transparency remains intact, even as cloud usage expands. [8][10][12]
How to Apply FinOps Practices to Improve Visibility
FinOps practices are built on collaboration and transparency, with the aim of embedding cost awareness into everyday workflows. When the foundational elements are in place, organisations can turn raw cost data into actionable insights. This is done through detailed cost allocation, real-time monitoring, and integrating cost considerations into engineering processes. The result? A shift from reactive, end-of-month reviews to proactive, continuous optimisation. The journey begins with accurately allocating costs and ensuring every expense is accounted for.
Detailed Cost Allocation Methods
A solid cost allocation system is essential. This involves defining cost categories and using chargeback or showback models. Cost categories allow teams to group spending by service type, region, or business function, giving a clear picture of where money is going. For instance, a UK-based retailer might organise costs into categories like Customer-Facing Services
, Internal Platforms
, and Data Analytics
, grouping tagged resources under each.
Chargeback models directly assign costs to teams based on their usage. For example, a development team might see monthly charges of £12,500 for compute, £3,200 for storage, and £1,800 for data transfer. On the other hand, showback provides visibility into costs without actual billing, making it a great starting point for organisations new to FinOps.
One global financial institution, operating across more than 50 countries, tackled over $50 million (around £39 million) in annual cloud spending with limited visibility. By implementing detailed cost allocation across AWS, Azure, and on-premises systems, they achieved 95% budget forecast accuracy, reduced reconciliation time by 80%, and reached 99% cost allocation accuracy [10].
Starting with showback helps build transparency and buy-in. Once teams understand their spending patterns, organisations can transition to chargeback. Automated tools like AWS Cost and Usage Reports, Azure Cost Management, or Google Cloud Billing simplify this process, ensuring allocation data integrates smoothly into finance systems. Displaying costs in GBP and aligning them with UK financial periods ensures consistency.
Setting Up Real-Time Monitoring and Alerts
Relying on month-end cost reviews often means spotting problems too late. Real-time monitoring changes this by providing instant visibility into spending trends and anomalies. Dashboards can show daily and monthly spending patterns, highlight top cost drivers, and allow filtering by business unit, environment, or project. Costs can also be displayed in GBP and compared month-on-month to identify trends.
Alerts are a key part of staying ahead of cost issues. For instance, if compute costs spike by 20% in a single day, an email or Slack notification can alert the relevant team. Other examples include identifying idle EC2 instances running for over 72 hours, databases exceeding budget, or unexpected increases in data transfer costs [2].
Cloud-native tools like AWS CloudWatch and Azure Monitor, combined with third-party platforms, enable organisations to act on anomalies within hours instead of weeks. Automated responses, such as shutting down non-production environments after hours or scaling down over-provisioned instances, can further minimise waste [6].
Adding FinOps to Engineering Workflows
To truly integrate financial control, cost insights need to be part of daily engineering practices. The best FinOps strategies make financial accountability as routine as code reviews or security checks. This means embedding cost data into CI/CD pipelines, development tools, and collaboration platforms like Jira, ServiceNow, or Slack.
With CI/CD integration, teams can evaluate the cost impact of deployments before they go live. For example, tools that pull billing data from cloud APIs can compare costs against budgets and block deployments if thresholds are exceeded. A pipeline might flag a new microservice expected to add £5,000 per month in compute costs, prompting engineers to optimise resources or explore alternatives like spot instances.
Policy guardrails automate cost governance by embedding cost data into CI/CD pipelines and using Infrastructure as Code with cost-saving configurations. This reduces errors and speeds up deployment cycles [1]. Tracking metrics, such as the percentage of deployments within budget or the average time to address anomalies, helps teams refine their processes.
Specialist partners like Hokstad Consulting can speed up this integration by designing automation that embeds cost visibility into existing DevOps workflows. Their expertise in Infrastructure as Code and automated CI/CD pipelines has helped organisations cut infrastructure spending by 30%–50% without compromising performance [1]. By making cost data accessible in tools engineers already use, companies can create a culture where financial responsibility becomes second nature.
Need help optimizing your cloud costs?
Get expert advice on how to reduce your cloud expenses without sacrificing performance.
Turning Visibility into Continuous Cost Control
Building on the earlier discussion of FinOps principles, this section delves into how visibility can evolve into a process of ongoing cost management. Simply put, visibility isn't enough on its own - it needs to fuel continuous actions that keep spending in check. This involves creating optimisation loops to eliminate waste, establishing governance structures to ensure accountability, and leveraging historical data for precise forecasting. Together, these strategies enable teams to align their performance with financial constraints. Let’s explore how to turn cost visibility into a mechanism for continuous control.
Creating Cost Optimisation Loops
At its core, an optimisation loop is a cycle of monitoring, identifying inefficiencies, acting on them, and measuring the outcomes. With detailed insights into resource usage, teams can quickly identify areas of waste - like idle servers, oversized virtual machines, or unused storage. Dashboards make these inefficiencies immediately visible, allowing teams to take swift action. For example, automated systems can shut down non-production environments outside of working hours or adjust resource sizes to match actual demand. These loops integrate seamlessly with the dashboards and tagging strategies previously mentioned.
Regular reviews, such as weekly check-ins, focus on the most impactful opportunities for savings. Imagine a scenario where development environments run 24/7 but are only used during business hours - automated scheduling could reduce those costs by up to 70%. These iterative processes transform visibility from static data into a dynamic tool for ongoing improvement.
Building Governance and Accountability Structures
Governance ensures that cost control becomes an organisational habit rather than an individual effort. Shared KPIs, like cost per business unit or resource efficiency metrics, make spending transparent across all teams. When engineering, finance, and operations come together in regular FinOps meetings to review these metrics, accountability shifts from being isolated to being collective.
Practical governance measures include forming cross-functional FinOps teams that meet monthly to review spending trends and set priorities. A chargeback model, where departments are billed based on their actual usage, introduces direct financial accountability. Policy guardrails - such as requiring budget approvals for deploying new resources or enforcing tagging standards - help automate governance and minimise the risk of overspending. These structures strike a balance between giving teams autonomy and maintaining central oversight, laying the groundwork for effective budgeting and forecasting.
Using Visibility for Budgeting and Forecasting
With governance in place, historical cost data becomes a valuable resource for predicting future expenses. Analysing past spending patterns can reveal seasonal trends, growth trajectories, and the financial implications of planned projects. For UK organisations, this means aligning forecasts with quarterly financial periods (April–June, July–September, October–December, January–March) and presenting figures in GBP.
Advanced tools that integrate cost allocation with budgeting systems allow for detailed tracking at the project, team, or service level. Alerts for anomalies - such as an unexpected 20% spike in database costs - enable proactive adjustments before budgets spiral out of control. Scenario planning also becomes feasible, letting teams model the financial impact of scaling up operations or launching new services.
For example, a global financial institution operating in over 50 countries tackled over $50 million (around £39 million) in annual cloud expenses by deploying visibility tools and cost allocation across AWS, Azure, and on-premises platforms. The results were impressive: they achieved 95% budget forecast accuracy, cut reconciliation time by 80%, and reached 99% cost allocation accuracy [10]. When everyone works with the same reliable data, budgeting shifts from being a contentious process to a collaborative one.
Measuring the Impact of FinOps on Cloud Cost Visibility
When it comes to understanding the value of FinOps, the key is to focus on measurable results. This isn't about vague impressions or general improvements; it's about tracking specific metrics that can clearly demonstrate progress to engineering teams, finance departments, and senior leadership. These metrics allow organisations to compare historical data and directly connect improvements to cost savings.
Key Metrics for Visibility Improvements
To assess how FinOps improves cloud cost visibility, start by tracking the percentage of tagged resources, both by count and monthly spend (in GBP). The goal is to achieve 90–95% resource tagging coverage. Additionally, monitor allocation coverage, aiming for over 98% of monthly spend to be allocated to specific teams or projects. These metrics are essential for ensuring that costs are properly attributed and understood [3][4].
Another critical metric is allocation accuracy, which evaluates how much of the allocated spend is based on precise tags rather than assumptions or flat splits. Similarly, track forecast accuracy by comparing predicted monthly cloud spend to actual invoices, with a target variance of ±5–10% [2][4]. Finally, measure the timeliness of data, focusing on how quickly costs become visible after resources are used. Moving from end-of-month reports to near real-time dashboards can significantly improve how teams respond to spending patterns [2][4][10].
Before-and-After Comparisons
Once you've defined these metrics, compare historical data to quantify the impact of FinOps. Create side-by-side tables showing performance over a 6–12 month period before FinOps implementation and an equivalent timeframe after. Key metrics to include are:
- Percentage of spend with valid tags
- Unallocated charges (in £)
- Average monthly forecast error
- Number of cost anomalies detected per quarter [2][3][10]
For instance, one organisation achieved 95% forecast accuracy, reduced reconciliation time by 80%, and reached 99% cost allocation accuracy after adopting FinOps practices [10].
To make these comparisons clear, structure your table with columns like Metric | Baseline (H1 2023) | After FinOps (H1 2024) | Change (%). A second table can focus on financial outcomes, such as £ per customer, £ per transaction, and total monthly spend, tying visibility improvements directly to monetary savings [2][4].
Linking Visibility to Cost Savings
Improved visibility is not just about tracking numbers - it’s about turning insights into actions that reduce waste. Monitor how visibility improvements lead to tangible savings by recording each optimisation initiative. For example, track the visibility trigger (like an anomaly alert or dashboard review) and the resulting monthly savings in GBP [2][5].
Specific areas to measure include monthly waste savings from unused volumes and idle virtual machines. Additionally, quantify savings from commercial optimisations, such as Savings Plans, which become feasible once workloads are better understood [2][5].
To go deeper, focus on unit economics. Track cost-per-unit metrics such as £ per active user or £ per order for key services [2][4]. When these figures improve while maintaining or enhancing service levels, it proves that visibility isn’t just about cutting costs - it’s about creating a more efficient and effective operation. For organisations in the UK, experts like Hokstad Consulting can assist in defining relevant KPIs and designing dashboards that align with governance needs, ensuring every improvement is measurable and actionable.
Conclusion
Understanding cloud costs is the foundation of smarter infrastructure decisions. This guide has walked through how FinOps practices transform cost management - shifting from reactive approaches to proactive strategies. By establishing clear tagging standards, structuring accounts effectively, implementing real-time monitoring, and creating optimisation cycles, businesses can unlock ongoing savings.
The results speak for themselves: organisations adopting FinOps principles have achieved 95% forecast accuracy, slashed reconciliation times by 80%, and reached 99% cost allocation accuracy [10]. These improvements translate directly into savings. For instance, a SaaS company saved £120,000 annually by optimising its infrastructure, while an e-commerce platform reduced costs by 30% and boosted performance by 50% [1]. These outcomes highlight how visibility helps businesses eliminate waste, right-size resources, and align spending with their actual needs.
Switching from month-end reconciliations to real-time dashboards embeds cost awareness into daily workflows. When developers can instantly see the financial impact of their decisions, they naturally make more efficient choices - without compromising speed or innovation.
For UK businesses navigating the challenges of public, private, or hybrid cloud environments, expert support can make a significant difference. Firms like Hokstad Consulting offer tailored guidance, integrating visibility frameworks, automation, and governance into FinOps strategies. Their performance-based model, where fees are tied to actual savings, ensures businesses see tangible benefits while navigating complex multi-cloud setups and regulatory demands.
FAQs
How does FinOps improve visibility into cloud costs in real time?
FinOps provides businesses with real-time insights into cloud expenses by using automated monitoring and analytics tools. These tools work around the clock to track resource usage and spending, delivering up-to-date data that highlights inefficiencies and helps organisations act swiftly.
With its focus on proactive cost management, FinOps enables companies to fine-tune their cloud spending. This approach ensures they pay only for the resources they genuinely need, all while keeping their budgets firmly under control.
How does a well-structured FinOps account system benefit cloud cost management?
A well-organised FinOps account system plays a key role in improving cost visibility, making it simpler to monitor and evaluate cloud expenses. With a clear view of spending, organisations can identify what’s driving costs, prioritise budgets according to business goals, and distribute resources more efficiently.
By encouraging accountability and enabling detailed reporting, businesses can uncover inefficiencies, cut down on wasteful spending, and make smarter decisions to fine-tune cloud usage. This not only helps maintain better control over cloud expenses but also contributes to stronger financial planning and smoother operations in the long run.
How can FinOps be seamlessly incorporated into engineering workflows?
To weave FinOps principles into engineering workflows, begin by incorporating automated CI/CD pipelines, Infrastructure as Code (IaC), and real-time monitoring tools. These tools provide ongoing insight into cloud expenses, making it easier to keep spending in check.
Make it a habit to regularly review resource usage and fine-tune infrastructure to fit actual needs - this process, often called right-sizing, prevents unnecessary costs. Strengthen collaboration between engineering and finance teams so that technical choices align with financial objectives. This way, you can achieve cost efficiency while maintaining top-notch system performance and fast deployment cycles.