
If your Kubernetes workers sit idle for hours and then get hit by a queue spike, KEDA is often the right fix. I’d sum it up like this: KEDA lets me scale on work waiting to be done instead of waiting for CPU or memory to climb, and it can take pods all the way down to 0 when nothing is happening.
In plain terms, this guide shows me how to:
- use external signals like queue depth, stream lag, and schedules to scale workloads
- set up ScaledObjects, triggers, activation rules, and auth
- use scale-to-zero to cut idle pod spend
- avoid common issues like flapping, bad credentials, cold starts, and broken metrics
- check whether KEDA is saving money by comparing provisioned vs used capacity and monthly compute spend in £
A few points matter most:
- HPA alone is often too late for bursty workers because CPU may stay low until backlog is already building
- KEDA works with HPA, not instead of it: KEDA supplies external metrics, and HPA applies the scaling
-
minReplicaCount: 0is where cost savings often come from, but it can add cold start latency -
maxReplicaCount,cooldownPeriod, andfallbackhelp stop runaway scaling and bad scale-down behaviour - ScaledJob can be a better fit than a Deployment for one-off tasks like image processing or report runs
- before rollout, I’d test auth, network access, CRDs, external metrics API, and scale-down under load
Here’s the core idea in one quick view:
| Area | What to know |
|---|---|
| Best fit | Queue workers, stream consumers, batch jobs, scheduled tasks |
| Poor fit | Steady services with flat, predictable load |
| Main KEDA parts | Scalers, ScaledObject, activation, TriggerAuthentication |
| Big gain | Scale from demand signals and drop to 0 pods when idle |
| Main risk | Cold starts, bad trigger setup, or scale-down during in-flight work |
| Checks before go-live | Metrics API, operator logs, HPA state, connectivity, secrets, replica limits |
So if I wanted the short answer, it would be this: KEDA is a strong choice when demand comes from outside the cluster, arrives in bursts, and makes always-on pods a waste of money. The rest of the guide is about setting it up cleanly, tuning it, and making sure the scaling works when traffic turns messy.
::: @figure 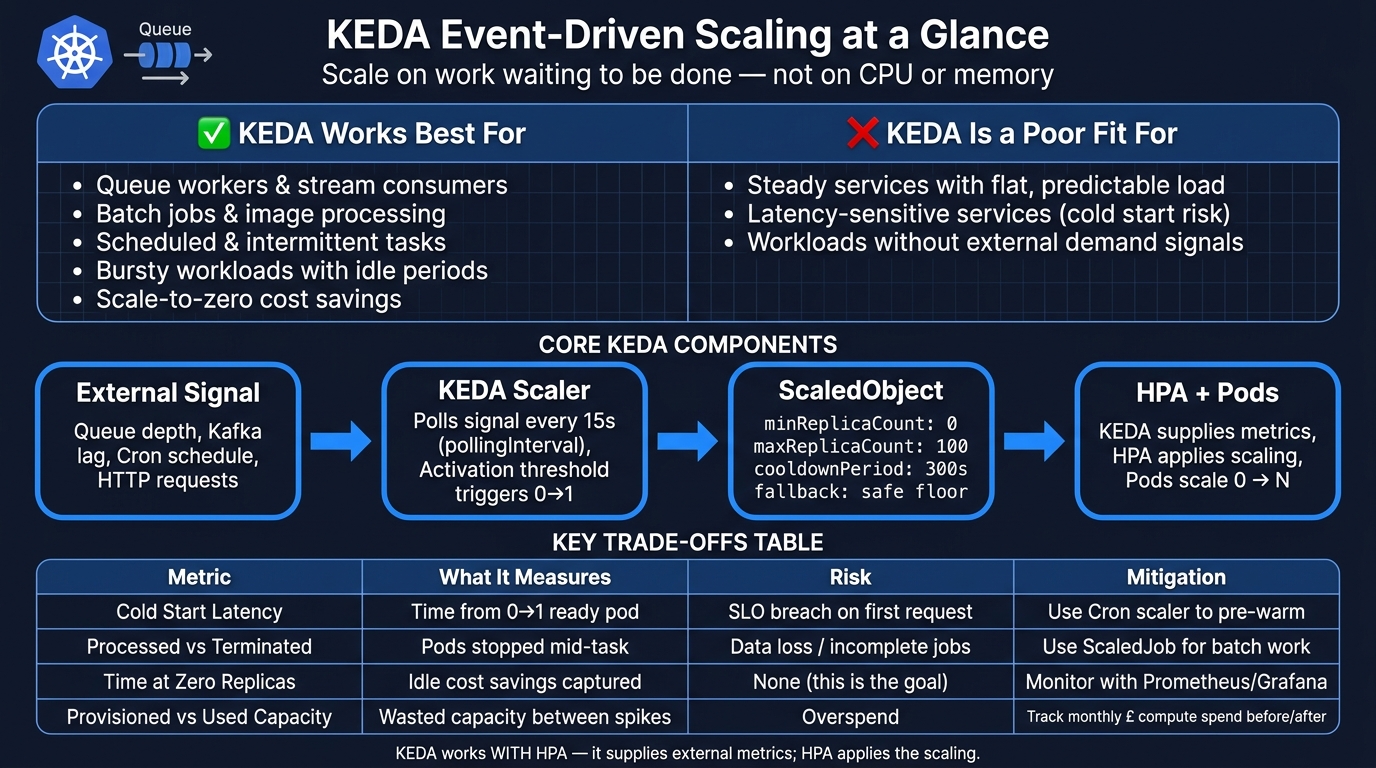 {KEDA vs HPA: Event-Driven Scaling Decision Guide}
:::
{KEDA vs HPA: Event-Driven Scaling Decision Guide}
:::
Master KEDA: Hands-on Kubernetes Event-Driven Autoscaling ✅
Need help optimizing your cloud costs?
Get expert advice on how to reduce your cloud expenses without sacrificing performance.
Installing KEDA and preparing the cluster
A few checks before installation can save a lot of hassle later.
Prerequisites: cluster access, namespaces and permissions
KEDA needs cluster-admin, or an equivalent RBAC setup, plus permission to create CRDs and controllers that watch the cluster or chosen namespaces [1]. Those permissions, along with the right namespaces, allow KEDA to watch demand signals and publish metrics safely.
Use a dedicated namespace such as keda so the operator and its service accounts stay separate from the rest of the cluster. Once that's in place, you can install the operator and check that the APIs it depends on are available.
Helm installation and component checks
The standard way to install KEDA is with Helm:
helm repo add kedacore https://kedacore.github.io/charts
helm repo update
helm install keda kedacore/keda --namespace keda --create-namespace
After installation, check that the operator, metrics path and webhooks are healthy before you create any ScaledObjects. Here's what each part does and how to check it:
| Component | Primary Function | Verification Check |
|---|---|---|
| KEDA Operator | Manages the lifecycle of ScaledObjects |
kubectl get pods -n keda (Status: Running) |
| Metrics API Adapter | Provides external metrics to HPA | kubectl get apiservice v1beta1.external.metrics.k8s.io |
| Admission Webhooks | Validates KEDA CRD configurations on creation/update | Check logs for keda-operator-metrics-apiserver
|
KEDA depends on custom.metrics.k8s.io and external.metrics.k8s.io. If either one is missing, HPA won't be able to read KEDA's external metrics. You should also run kubectl get crds | grep keda.sh to confirm the CRDs were installed as expected.
Setup considerations for managed clusters
Managed Kubernetes platforms such as AKS and EKS add a few extra things to watch for. In many cases, you need egress rules or network policies that allow the operator to reach external systems such as Kafka or cloud brokers, because KEDA must connect to the systems that produce demand signals [1]. A simple way to test this is from the operator pod with tools such as curl or nc [2].
For KEDA 2.15 and above, Workload Identity is required. Pod identity is no longer supported [1]. That means your service accounts need to be set up before an upgrade or a new installation.
In multi-tenant clusters, use namespace scoping or separate KEDA instances. It also helps to enforce quotas and labels with policy tools so scaling doesn't run away. Put plainly: if identity and tenancy controls are loose, the wrong trigger can push replica counts up when you don't want it to [1] [2].
Once the cluster is ready, define the ScaledObject and triggers that map demand signals to workload scale-up.
Configuring ScaledObjects and triggers
With KEDA in place, you define the workload, the demand signals, and the scaling guardrails in a ScaledObject. Start by pointing KEDA at the workload, then connect the external signal and the scaling limits.
ScaledObject fields that control scaling behaviour
The ScaledObject is the KEDA resource you'll touch most often. It tells KEDA which workload to scale, how often to check for demand, and how fast to scale up or back down.
Remove spec.replicas from Deployment and StatefulSet manifests once KEDA takes over scaling. If you leave it there, you'll end up with a tug-of-war between the replica count stored in Git and the one KEDA is changing in the cluster.
| Field | Purpose | Typical Default | Why It Matters |
|---|---|---|---|
scaleTargetRef |
Identifies the Deployment or StatefulSet to scale | Required | Must match the workload name exactly |
minReplicaCount |
Minimum pods to maintain | 0 | Set to 0 to cut spend; use 1 or more for low-latency services |
maxReplicaCount |
Upper limit on pod count | 100 | Stops runaway scaling if a queue backlog spikes without warning |
pollingInterval |
How often KEDA checks the event source | 15 seconds | Shorter means faster reaction; longer means less API load |
cooldownPeriod |
Wait time before scaling back down | 300 seconds | Increase this if pods scale down, then bounce straight back up |
fallback |
Safe replica count if the metrics source is unavailable | - | Helps stop a workload scaling to zero during a metrics outage |
Use fallback when you need a safe floor during a metrics failure.
Once the target and limits are in place, define the triggers that tell KEDA when to start scaling.
Trigger metadata and using multiple demand signals
Each trigger maps to one event source. Its metadata tells KEDA which signal to read and which threshold should drive scaling.
Use more than one trigger when a single signal doesn't tell the whole story. In that setup, the highest replica demand wins. A common case is a worker service that uses both queue depth and CPU utilisation: the queue shows how much work is waiting, while CPU shows how hard the current pods are already pushing.
| Feature | Single-Trigger | Multi-Trigger |
|---|---|---|
| Logic | One signal drives scaling | All signals are evaluated; the highest replica count wins |
| Complexity | Low; straightforward to debug | Higher; needs care when balancing different metric types |
| Best For | Dedicated queue workers | Apps where both event volume and resource intensity vary |
Some scalers, including Prometheus, use an activation threshold to move a workload from zero to one replica. That's separate from the threshold the HPA uses to scale from one to many.
Authentication, Secrets and safe credential handling
Credentials for external event sources - connection strings, API keys, and broker passwords - sit outside trigger metadata. KEDA uses TriggerAuthentication for namespaced credentials and ClusterTriggerAuthentication for shared infrastructure used across several namespaces.
Both resources use secretTargetRef to map parameters to keys in standard Kubernetes Secrets. The parameter name must match the Secret key exactly, or scaling will fail [2].
Rotate Secrets on a fixed schedule.
With scaling rules and credentials set, the next step is tuning behaviour and watching for failure modes.
Advanced patterns, observability and production safety
Scale-to-zero, jobs and custom resource targets
Once the ScaledObject is live, the next step is tuning it for quiet periods, batch work, and the sort of failure cases that only show up when traffic gets messy.
Setting minReplicaCount: 0 turns on scale-to-zero. That can cut cost, but there’s a trade-off: cold starts. If the service has been idle, the first event has to wait while a pod spins up. For latency-sensitive services, that delay can hit user-facing SLOs. It helps to use startupProbes or readinessProbes with a sensible initialDelaySeconds so short CPU spikes during application start-up don’t give you a false picture.
For bursty or batch-heavy workloads, such as image processing, report generation, or data exports, a ScaledJob is often a better choice than a long-running Deployment. Each event creates a Job that runs to completion. That matters because it avoids a nasty edge case: a pod getting shut down halfway through a task during scale-down. If you’re using StatefulSets, keep terminationGracePeriodSeconds long enough to allow a clean shutdown and cache flushes. If you’re scaling custom resources, point scaleTargetRef at the supported scale subresource, then test how scale-down behaves while the system is under load.
If traffic spikes are predictable, KEDA’s Cron scaler can pre-warm replicas before the rush hits. That removes cold-start delay when you already know demand is coming.
After you’ve picked the right workload shape, check that KEDA is exposing the signals you expect.
Inspecting scaling state and diagnosing failures
When scaling starts acting oddly, begin with kubectl describe scaledobject <name>. The status conditions show whether KEDA is polling the event source and whether the scaler is healthy. Next, inspect the HPA KEDA created with kubectl describe hpa keda-hpa-<scaledobject-name>. That tells you whether metrics are arriving and whether replica limits are getting in the way. You should also confirm that the external metrics API is registered with kubectl get apiservice | grep external.metrics. If it isn’t there, the HPA has nothing to read from.
KEDA operator logs are usually the fastest way to trace activation failures. Run kubectl logs -n keda -l app=keda-operator and look for auth errors, bad trigger metadata, or connection failures to the event source. If the scaler can’t reach a Kafka broker or RabbitMQ API, test connectivity from the KEDA operator pod itself with nc or curl. That helps you split network trouble from bad credentials.
Those checks are worth doing before production traffic lands, not after.
Production safeguards for stable scaling
Tune cooldownPeriod, maxReplicaCount, and fallback to avoid flapping and runaway spend.
For business-critical services, keep an eye on four metrics all the time:
- Cold start latency: time from zero to one ready replica
- Processed vs. terminated count: whether pods are being stopped mid-task
- Time at zero replicas: how long workloads stay idle
- Provisioned vs used capacity: how much capacity is sitting there unused
Send these to Prometheus and show them in Grafana next to trigger metrics such as queue depth or Kafka consumer lag. That way, you can tell whether scaling decisions are matching demand or drifting away from it. Cold start latency and time at zero replicas are especially useful because they show where scale-to-zero is saving money and where it may be adding SLO risk.
| Metric | What It Tells You |
|---|---|
| Cold start latency | Whether 0-to-1 scaling meets your SLO |
| Processed vs. terminated count | Whether scale-down is interrupting in-flight work |
| Time at zero replicas | How much idle time you're actually capturing as cost savings |
| Provisioned vs used capacity | Whether provisioned capacity is being wasted between scaling events |
Cost impact, architecture fit and conclusion
How KEDA helps reduce cloud costs
Once scaling is steady, the next step is simple: check whether it’s cutting idle spend.
KEDA lowers cost by removing idle compute from bursty workloads. That matters most when services sit doing very little between spikes. In those cases, idle replicas can quietly eat through budget. Workloads driven by queues, databases, HTTP requests or schedules are often a good fit, because downtime between bursts can turn into clear £ savings.
You need to measure this before and after rollout. Track provisioned capacity against used capacity, then compare monthly compute spend and utilisation across both periods. Without that side-by-side view, any claim of cost reduction is just a guess.
Where KEDA fits across public, private, hybrid and managed hosting
KEDA’s fit depends as much on your cluster model as it does on the workload itself.
KEDA runs wherever Kubernetes runs, so it can work in a broad range of setups. But the way it helps changes by environment. In public cloud, scale-to-zero is often the big win because it cuts idle pod spend. In private or on-premises clusters, the gain is different: it frees capacity for other workloads instead of leaving resources tied up doing nothing. In managed and hybrid setups, the trigger path needs to match the cluster’s identity, network and namespace model.
Key decisions and next steps
Use KEDA for bursty, queue-backed or intermittent demand. A good place to start is one queue-driven worker service.
Validate the trigger setup in staging, test scale-down behaviour under realistic load, and make sure scaling down doesn’t interrupt in-flight work. After that, measure utilisation and compute spend before and after rollout. That gives you a clear proof point you can take back to the rest of the platform team.
Get the ScaledObject, authentication and observability right first. Once those pieces are solid, extending KEDA to other workloads gets much easier.
FAQs
When should I use KEDA?
Use KEDA when workloads need to scale based on external event triggers like queue depth, streaming data, or HTTP request rates, instead of relying only on CPU or memory use.
It works especially well for unpredictable or bursty traffic. When demand drops, KEDA can scale workloads down to zero during idle periods, which helps cut unnecessary costs.
It’s also a strong fit for resource-heavy workloads, including GPU-based AI, machine learning, internal tools, staging environments, and batch processes.
How do I avoid cold starts?
For interactive services, set minReplicaCount to 1 or more. That keeps one pod running, so the app stays warm and avoids the delay that comes with scaling from zero.
If you need to scale to zero to cut costs, tune activationThreshold so KEDA only scales up after a set level of events is reached. That can help control cold starts, but it won't remove the first start-up delay.
Should I use ScaledObject or ScaledJob?
Use a ScaledObject for long-running services or deployments that should keep running, or scale to zero when event triggers say there’s no work to do.
Use a ScaledJob for separate, long-running tasks that need Kubernetes Jobs. That way, replicas aren’t shut down too early during scale-down.