
Metrics drive better DevOps performance. Without them, teams rely on guesswork, leading to inefficiencies. High-performing teams deploy code more frequently, maintain lower failure rates (0–15%), and recover faster. Metrics like deployment frequency, lead time for changes, and mean time to recovery help identify bottlenecks and improve both speed and stability.
Here’s a quick look at the 7 key metrics every DevOps team should track:
- Deployment Frequency: Measures how often your team releases code. Frequent deployments indicate agility.
- Lead Time for Changes: Tracks how quickly code moves from commit to production, highlighting inefficiencies.
- Change Failure Rate (CFR): Shows the percentage of deployments causing failures, ensuring quality isn’t sacrificed.
- Mean Time to Recovery (MTTR): Measures how quickly services are restored after failures, reflecting system stability.
- Deployment Speed: Focuses on how efficiently your CI/CD pipeline moves code through stages.
- Deployment Success Rate: Tracks the percentage of deployments completed without issues.
- Error Rate: Monitors ongoing system reliability by measuring failed requests.
These metrics provide a clear roadmap for improving software delivery and balancing speed with reliability. Tracking them helps teams deliver faster, reduce risks, and improve recovery times.
::: @figure 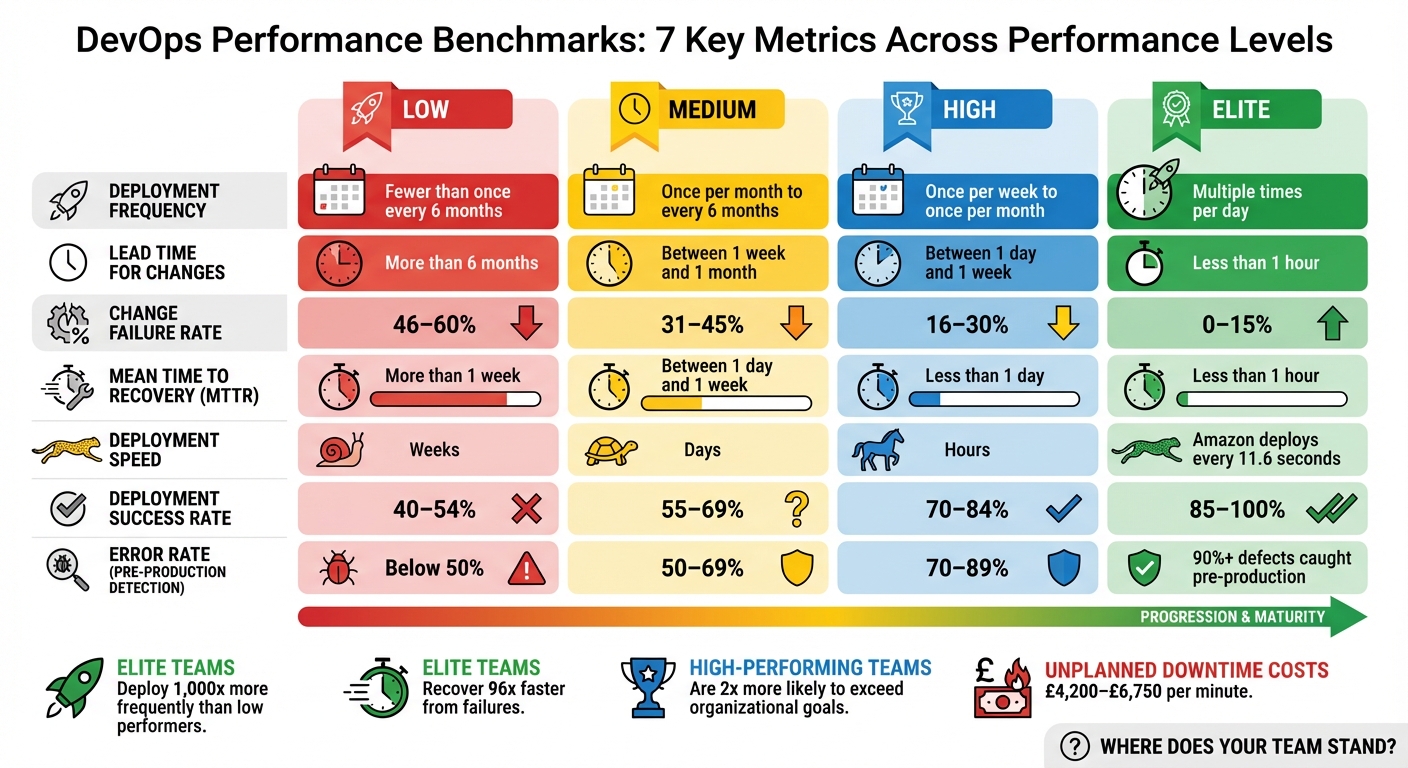 {DevOps Performance Levels: Benchmarks for 7 Key Deployment Metrics}
:::
{DevOps Performance Levels: Benchmarks for 7 Key Deployment Metrics}
:::
1. Deployment Frequency
Understanding Deployment Frequency and Its Importance
Deployment frequency is a key indicator of the balance between speed and stability in your DevOps processes. It measures how often your team successfully releases code to production over a set period [1][6]. Think of it as the pulse of your delivery pipeline - frequent deployments indicate a more agile and responsive operation.
Why does this matter? Because it shows how quickly your team can innovate and adapt to market demands. For instance, elite DevOps teams are known to deploy nearly 1,000 times more often than lower-performing teams. Similarly, mature teams deploy up to 46 times more frequently than less mature ones [3]. A standout example is Amazon’s engineering teams, who deploy new code approximately every 11.6 seconds [3].
Deployment frequency defines the rhythm of your delivery pipeline - the pace at which innovation reaches users.- Growin [3]
Measuring Deployment Frequency Effectively
To get an accurate picture of your deployment frequency, use your CI/CD automation tools to track the finished_at property of successful production deployments [8][5]. Ensure your system logs only deployments marked as successful. For deeper insights, calculate weekly deployments per developer by dividing the total number of deployments by the number of developers [8].
Here’s an example of how this can work in practice: In 2023, Alexander Lystad, CTO of Visma, introduced a system where every production release required teams to register a Deployment issue
in Jira. This data was then fed into Tableau reports, making deployment activity visible across the organisation [4].
These methods help you not only track deployment frequency but also highlight areas for improvement.
Why Deployment Frequency Matters for DevOps Goals
Frequent deployments bring faster feedback loops, allowing teams to iterate quickly and respond to user needs [5][6]. Smaller, more incremental changes also reduce the risks tied to each release. For context, elite teams maintain a change failure rate of around 5%, while lower-performing teams can see failure rates soar to 40% [3]. By focusing on deployment frequency, organisations can strike a balance between speed and stability, ensuring they meet user expectations without compromising reliability.
Improving Deployment Frequency
If you want to increase deployment frequency, start by breaking down changes into smaller, manageable batches. Automating your pipeline is another critical step to eliminate manual bottlenecks [5][4][8]. Adopting trunk-based development can also help, as it avoids long-lived branches that delay integration [9][4].
Another effective approach is using feature flags. This technique separates deployment from release, letting you push code to production frequently while controlling user access with toggles [10][3]. This way, you can maintain a steady deployment rhythm without overwhelming end users.
2. Lead Time for Changes
Definition and Relevance to Deployment Performance
While deployment frequency tells you how often releases occur, lead time for changes focuses on how quickly your pipeline moves code from commit to production.
This metric measures the time it takes for code to go live after being committed, highlighting inefficiencies in your CI/CD processes and showing how quickly your team can adapt to changes.
Lead time for changes measures the average speed at which the DevOps team delivers code, from commitment to deployment. It indicates the team's capacity, the complexity of the code, and DevOps' overall ability to respond to changes in the environment.
– Atlassian[6]
How to Measure the Metric Effectively
To measure this metric accurately, you need to map each change to its unique Secure Hash Algorithm (SHA) identifier. Then, compare the commit timestamp with the deployment timestamp. The calculation is simple: subtract the commit time from the deployment time[1].
Alexander Lystad, CTO of Visma, shared how his organisation tracks this metric:
We are tracking delivery lead time, deployment frequency, change failure rate, mean time to restore, and availability across 65+ teams and growing.[4]
| Performance Level | Lead Time for Changes Benchmark |
|---|---|
| Elite | Less than 1 hour[9] |
| High | Between 1 day and 1 week[9] |
| Medium | Between 1 month and 6 months[9] |
| Low | More than 6 months[9] |
This level of tracking provides invaluable insights into your deployment speed and helps drive more responsive workflows.
Impact on DevOps Goals
Shorter lead times mean faster feedback loops, allowing developers to detect and fix issues quickly[7]. This not only speeds up the development process but also enhances code quality. Elite teams achieve lead times of under an hour, while lower-performing teams may take over six months to deploy a commit[9]. Additionally, teams with shorter lead times often report lower change failure rates, typically between 0–15%[7].
Strategies for Improvement and Optimisation
To reduce lead times, consider adopting practices like trunk-based development, breaking work into smaller incremental changes, automating tests, simplifying code reviews, and using feature flags for controlled rollouts. Value stream analytics can also help pinpoint areas where code is delayed, enabling targeted improvements to speed up your pipeline.
3. Change Failure Rate
Definition and Relevance to Deployment Performance
Tracking Change Failure Rate (CFR) is just as important as monitoring deployment frequency and lead time when aiming for a balance between speed and stability in DevOps. CFR measures the percentage of production deployments that lead to failures, rollbacks, or service issues [1]. While deployment frequency and lead time highlight velocity, CFR focuses on maintaining quality.
Change failure rate is a countermeasure to frequency and speed.– Atlassian [6]
This metric acts as a safeguard, ensuring that speed doesn't come at the expense of quality. A high CFR often signals issues like poor code quality or inadequate testing [2], whereas a low CFR reflects a well-optimised, automated deployment process.
How to Measure the Metric Effectively
CFR is calculated by dividing the number of deployments causing incidents by the total number of deployments during a specific timeframe [1]. To ensure accuracy, it's essential to systematically track incidents and map them to deployment IDs using bug trackers or incident management tools. This method provides reliable data for analysis across teams.
| Performance Level | Change Failure Rate (%) |
|---|---|
| Elite | 0% – 15% |
| High | 16% – 30% |
| Medium | 31% – 45% |
| Low | 46% – 60% |
One of the biggest challenges is defining what qualifies as a failure
consistently across teams [2]. Without a standard definition, the data becomes unreliable, making comparisons and trend analysis ineffective. Accurate CFR measurement is key to understanding its impact on overall deployment performance.
Impact on DevOps Goals
When CFR is measured correctly, its influence on resource usage, team morale, and organisational reputation becomes clear. A high CFR drains resources, lowers morale, and can harm the organisation's image [14]. Teams with rates above 40% often struggle with inadequate testing processes [15], while elite performers - those with rates between 0% and 15% - tend to achieve higher software delivery performance [14]. Frequent failures can also make teams hesitant to innovate, slowing the rollout of new features. Interestingly, teams with strong internal documentation are more than twice as likely to meet their reliability and stability goals [8].
Strategies for Improvement and Optimisation
To lower CFR, focus on improving automated testing and deploying smaller, more manageable changes. Expanding automated unit, integration, and regression tests within your CI/CD pipeline helps catch issues before they reach production [5]. A CFR above 40% often points to insufficient test automation [15].
Smaller, more frequent deployments make debugging easier [7]. When changes are incremental, problems are simpler to isolate and fix.
Feature flags are another useful tool, allowing you to quickly disable problematic code without rolling back an entire deployment [2]. Pairing this with robust monitoring and alerting systems reduces the time it takes to detect and address failed deployments.
Lastly, adopt a culture of blameless retrospectives after production failures. Instead of assigning blame, focus on refining processes and tools upstream [7]. This approach fosters psychological safety, which is linked to better performance across all DORA metrics [8].
4. Mean Time to Recovery
Definition and Relevance to Deployment Performance
Mean Time to Recovery (MTTR) represents the average time it takes to restore a service after a failure or interruption occurs [16]. As one of the core DORA metrics, it’s a key measure of system stability and an organisation's ability to respond effectively. While deployment frequency highlights speed, MTTR focuses on how well your team manages the inevitable hiccups in complex, fast-moving environments [7].
MTTR reflects your ability to respond to serious issues. As modern systems become more complex, more failures occur. It is no longer viable to wait until the deployment is perfect to avoid incidents.– Vlad Mozghovyi, Head of DevOps, MindK [20]
This mindset shift - from striving for perfection to prioritising rapid recovery - aligns with the realities of today’s distributed systems. Considering that unplanned downtime can cost businesses between £4,200 and £6,750 per minute [21], minimising recovery time is critical for maintaining operations and avoiding financial loss.
How to Measure the Metric Effectively
To calculate MTTR, divide the total downtime by the number of incidents over a specific period [17]. You can choose to start measuring from the moment the incident begins or when it’s detected; starting from the onset encourages better monitoring practices [19].
| Performance Category | Time to Restore Service (MTTR) |
|---|---|
| Elite Performers | Less than one hour |
| High Performers | Less than one day |
| Medium Performers | Between one day and one week |
| Low Performers | Between one week and one month |
Some organisations prefer using the median recovery time instead of the mean to minimise the impact of outliers [5].
This standardised approach to measuring recovery time is essential for identifying areas of improvement and enhancing deployment performance.
Impact on DevOps Goals
MTTR plays a crucial role in balancing speed and quality within DevOps workflows. While other metrics like deployment frequency and change failure rate focus on velocity and stability, MTTR measures how quickly teams can restore operations after an issue arises.
Teams with an MTTR under one hour - often considered elite - can take calculated risks with new features, knowing they can recover quickly if something goes wrong. Data shows that high-performing teams are twice as likely to exceed organisational performance goals compared to their lower-performing counterparts [13]. For instance, a 2021 case study by MindK highlighted how a US-based reputation tracking company drastically reduced its MTTR from weeks to just a few hours by modernising its legacy system with automation and containerisation. Despite the improvements in speed, the company maintained a change failure rate below 5% [20].
Strategies for Improvement and Optimisation
Reducing MTTR starts with proactive monitoring. Tools like Prometheus, Grafana, and Loki can identify anomalies before they escalate into major failures [16]. Pair these tools with automated alert systems that notify teams via SMS, email, or phone to cut down response times. Implementing automated rollbacks and feature flags also allows teams to quickly disable or revert problematic updates [18][13].
Additionally, maintaining a detailed knowledge base of past incidents can streamline future troubleshooting efforts. Blameless retrospectives after each incident encourage continuous learning and prevent recurring issues [7].
5. Deployment Speed
Definition and Relevance to Deployment Performance
Deployment speed refers to how efficiently your CI/CD pipeline moves code through its stages to production. While lead time for changes tracks the entire process from commit to deployment, deployment speed specifically focuses on the pace of each pipeline stage, helping identify bottlenecks and inefficiencies [5][8][13]. Faster deployment speeds create shorter feedback loops, allowing developers to detect and address defects much earlier [5][6].
Teams with shorter lead times tend to fix faults quickly because a resolution in the code won't get stuck in a long deployment pipeline.– Tony Kelly, DevOps Marketing Leader, Octopus Deploy [8]
Efficient pipelines allow teams to push fixes swiftly, ensuring production issues are resolved quickly while maintaining system stability. Building on the concept of lead times, deployment speed shines a spotlight on the effectiveness of your CI/CD pipeline stages.
How to Measure the Metric Effectively
To measure deployment speed, track timestamps at each stage of your CI/CD pipeline. Most CI/CD tools can automate this process, recording when code enters the pipeline and when it goes live [3][5].
Focus on both the overall pipeline duration and the time taken by individual stages. For example, if testing regularly takes hours while other stages complete in minutes, it’s clear where optimisation efforts should be directed.
Impact on DevOps Goals
Deployment speed plays a crucial role in delivering value quickly and maintaining a competitive edge. High-performing teams are twice as likely to meet or exceed organisational goals [13][3]. For instance, in June 2025, Onefootball’s engineering team transitioned to a Kubernetes environment with New Relic’s observability platform. This led to an 80% reduction in incidents and saved 40% of developer time previously spent on manual troubleshooting and slow deployment [2].
That said, speed must always be balanced with reliability. Metrics like Change Failure Rate ensure that rapid deployments don’t come at the expense of stability [3][5].
Strategies for Improvement and Optimisation
If you want to improve deployment speed without sacrificing quality, consider these approaches:
Break changes into smaller batches. Smaller updates are easier to test and carry lower deployment risks [5][8][4]. Amazon’s engineering teams exemplify this, deploying new code roughly every 11.6 seconds through advanced automation and continuous delivery practices [3].
Automate testing and streamline approvals. Automated workflows can significantly reduce delays. For example, GitHub halved its median cycle time in 2024 by introducing automated triggers and limiting branch lifespans [3][5][13].
Adopt trunk-based development. This approach simplifies merging and accelerates feedback on code quality [7][2][4]. Pair it with feature flags to separate deployment from release, enabling you to deploy code while keeping features inactive until verified. This strategy allows for quick recovery if issues arise, often within seconds [3][2][13].
The ability to receive fast feedback at each phase of development, coupled with the skill and authority to implement feedback, are hallmarks of high-performing teams.– Tom Hall, DevOps Advocate & Practitioner, Atlassian [7]
6. Deployment Success Rate
Definition and Relevance to Deployment Performance
Building on the importance of streamlined deployment processes, the deployment success rate sheds light on how reliable operations truly are.
This metric represents the percentage of deployments that make it to production without requiring immediate fixes, such as hotfixes, rollbacks, or service restoration [8] [22]. Essentially, it’s the opposite of the change failure rate (CFR), focusing on what goes well rather than what goes wrong. By balancing metrics like deployment frequency, it ensures that speed doesn’t come at the cost of quality [5] [6].
A high deployment success rate indicates strong engineering practices, effective automated testing, and high-quality code [22] [4]. Teams achieving this standard spend less time fixing production issues and more time rolling out new features that enhance customer experiences.
How to Measure the Metric Effectively
To calculate deployment success rate, divide the number of successful deployments by the total deployment attempts within a set timeframe, then multiply by 100 [5] [22]. For accurate tracking, integrate your CI/CD platform with incident management and monitoring tools to automatically record both deployment attempts and failures [8] [1].
Defining what counts as a failure
is crucial. Typically, failures include deployments causing production incidents, service degradation, or requiring manual intervention [1] [22]. Use unique identifiers, such as SHA IDs, to map production incidents back to their respective deployments for precise monitoring.
Impact on DevOps Goals
Elite DevOps teams maintain change failure rates between 0% and 15%, equating to deployment success rates of 85% to 100% [1] [6] [22]. On the other hand, lower-performing teams often see failure rates between 46% and 60%, meaning nearly half of their deployments encounter issues [1] [4]. A high deployment success rate demonstrates that quality is not being sacrificed for speed. Additionally, top-performing teams catch at least 90% of defects in pre-production environments, preventing issues from reaching production [22].
A low change failure rate is desirable because the more time a team spends addressing failures, the less time it has to deliver new features and customer value.– Shanika Wickramasinghe, Software Engineer, Splunk [22]
Strategies for Improvement and Optimisation
To improve deployment success rates, focus on automation, smaller batch sizes, feature flags, and learning from failures. Automate testing by integrating unit, integration, and regression tests into your CI/CD pipeline to catch issues early [5] [7]. Break changes into smaller, more manageable iterations to make defects easier to identify and fix [5] [7] [4]. Use feature flags to separate deployment from release, reducing risk [3]. Finally, hold blameless retrospectives to turn failures into opportunities for growth and continuous improvement [7] [3].
7. Error Rate and Production Stability
Definition and Relevance to Deployment Performance
While the deployment success rate focuses on how well individual releases perform, the error rate provides a broader picture of system health. It measures the percentage of failed requests out of the total requests, acting as a real-time gauge of system reliability under varying loads. Unlike the change failure rate, which highlights issues caused by deployments, the error rate monitors the ongoing stability of the production environment [9][11][12]. Keeping an eye on error rates allows teams to pinpoint specific transactions or services that struggle under pressure, helping them address problems before they escalate into full-blown outages [9].
DevOps performance metrics measure the efficiency and effectiveness of development and operations teams, helping organisations optimise software delivery.– Jonathan Singer, Checkmarx [11]
How to Measure the Metric Effectively
To measure the error rate, divide the number of failed requests by the total number of requests, then multiply the result by 100. This calculation gives a clear percentage that reflects system reliability. For a comprehensive view, integrate tools like version control systems, CI/CD pipelines, and incident management platforms to track the impact of deployments on error rates. Real-time monitoring tools such as Prometheus, Datadog, or New Relic can automate this process, sending alerts when error thresholds are breached [9][3][12].
Stress testing in pre-production environments that closely mimic live settings is another key practice. These tests can reveal potential error rate spikes before deployment [9]. High-performing DevOps teams aim to catch at least 90% of defects during these pre-production stages, ensuring smoother production performance [9].
Impact on DevOps Goals
A high error rate often translates to more customer support issues and lower user retention [9]. This metric complements velocity indicators like deployment frequency, ensuring that speed doesn't come at the expense of quality. Elite DevOps teams typically maintain change failure rates between 0% and 15%, while lower-performing teams may face rates as high as 40% [3][9][12].
Strategies for Improvement and Optimisation
Real-time monitoring is essential to maintaining a balance between rapid deployment and production stability. Set up alerting systems to quickly identify and resolve anomalies before they grow into larger problems [1][12]. Incorporate tools like SAST and DAST into your CI/CD pipeline to catch vulnerabilities that could increase error rates [11]. Automated rollback mechanisms are another safeguard - these can instantly revert changes if error rates exceed acceptable limits post-deployment [3][12].
Techniques like canary releases or blue-green deployments are also effective. By rolling out changes to a small segment of users first, teams can limit the impact of potential errors while gathering valuable data [12].
For organisations aiming to fine-tune their deployment processes, collaborating with Hokstad Consulting offers expert guidance and tailored solutions to strengthen DevOps practices and ensure production stability.
DORA Metrics Explained
How to Implement and Track These Metrics
To get started, begin by establishing baseline measurements for each metric over a period of several weeks. This initial data provides a snapshot of your current performance, offering a clear picture of where your team stands. Without this foundation, it’s nearly impossible to measure progress or justify any changes. These baseline metrics are essential for setting realistic improvement targets and tracking progress over time.
Once you’ve gathered this data, compare your performance against industry benchmarks. For example, elite teams deploy multiple times daily, achieve lead times of under an hour, have change failure rates between 0% and 15%, and restore services within an hour. On the other hand, lower-performing teams may deploy only a few times annually, face lead times exceeding six months, experience failure rates of 46%–60%, and take over a week to restore services. These benchmarks provide a valuable reference point for evaluating your team’s performance and identifying areas for improvement.
Here’s a summary of industry benchmarks across different performance levels:
| Performance Level | Deployment Frequency | Lead Time for Changes | Change Failure Rate | Time to Restore Service |
|---|---|---|---|---|
| Elite | Multiple times per day | Less than 1 hour | 0–15% | Less than 1 hour |
| High | Once per week to once per month | Between 1 day and 1 week | 16–30% | Less than 1 day |
| Medium | Once per month to every 6 months | Between 1 week and 1 month | 31–45% | Between 1 day and 1 week |
| Low | Fewer than once every 6 months | More than 6 months | 46–60% | More than 1 week |
To effectively track these metrics, integrate real-time monitoring tools with your version control, CI/CD pipelines, and incident management systems. Unified dashboards can provide instant visibility into trends, alerting teams to performance issues as they arise. These automated dashboards allow teams to act quickly, addressing potential problems before they escalate.
For organisations in the UK looking to improve deployment performance and cut costs, Hokstad Consulting offers tailored solutions. Their expertise in DevOps transformation and cloud cost optimisation can help set up effective monitoring systems, streamline deployment workflows, and reduce deployment costs by 30%–50%. Learn more at Hokstad Consulting.
Conclusion
These seven metrics together provide a clear picture of your deployment performance. Metrics like deployment frequency and lead time show how quickly value is delivered, while change failure rate and mean time to recovery reflect the reliability of your systems. Additional measures like deployment speed, success rate, and error rate shed light on efficiency and stability, offering a concrete way to evaluate return on investment (ROI).
The real power of metrics lies in driving informed decisions, not just collecting data. Take the Development Bank of Canada as an example. In 2025, they cut their pull request cycle time by 70% and achieved a tenfold ROI in just three months by integrating flow metrics into their pipelines. This allowed them to optimise their delivery workflow, using data insights to encourage continuous learning and foster psychological safety. Instead of focusing on avoiding mistakes, their approach prioritised rapid adaptation [3].
High-performing teams also demonstrate remarkable resilience, recovering from failures up to 96 times faster than less mature teams [3]. Elite organisations make tracking these metrics a daily habit, using them to identify trends and make small, consistent improvements. This proactive approach helps prevent major incidents and supports a DevOps culture that balances innovation with reliability.
To get started, establish your baseline metrics, compare them to industry benchmarks, and pinpoint areas for improvement. Whether you’re already deploying multiple times a day or working towards that goal, these metrics serve as a practical guide for progress. Regularly analysing them ensures continuous improvement and keeps your team moving forward.
For more expert advice, visit Hokstad Consulting.
FAQs
How can DevOps teams balance fast deployments with maintaining stability?
To achieve a balance between speed and stability in deployments, DevOps teams should keep a close eye on four crucial DORA metrics: deployment frequency, lead time for changes, change failure rate, and mean time to recovery (MTTR). These metrics act as a guide, helping teams spot when pushing for faster releases might risk system reliability. With this insight, teams can make smarter decisions, like fine-tuning automated tests or reducing batch sizes to maintain stability.
Adopting progressive delivery techniques is another effective approach. Methods such as feature flags, canary releases, and blue-green deployments allow teams to introduce small, reversible updates while keeping a close watch on success and error rates in real time. Real-time monitoring tools are especially valuable here, providing immediate feedback that enables teams to pause or roll back releases at the first hint of trouble, minimising user impact.
Hokstad Consulting assists organisations in adopting these practices by building automated CI/CD pipelines, setting up feature-flag frameworks, and implementing continuous monitoring systems. Their solutions are tailored to meet UK-specific compliance requirements and cost considerations, ensuring faster deployments without sacrificing reliability. The result? A smoother, more dependable experience for end users.
What are the best ways to reduce lead time for changes in DevOps?
Reducing lead time in DevOps means making your delivery pipeline faster and more efficient by cutting out unnecessary delays. A great starting point is to automate repetitive tasks such as code checks, builds, deployments, and testing. Automation not only reduces manual effort but also catches defects early, keeping things moving smoothly.
Another key strategy is adopting smaller, incremental changes through continuous integration. This approach minimises backlog delays and speeds up the process of verifying changes. When it comes to code reviews, keep them simple - combine lightweight peer reviews with automated tools to avoid slowing things down with excessive hand-offs.
To make your CI/CD infrastructure even more efficient, consider techniques like incremental builds, caching, and running pipelines in parallel. These methods can save valuable time. Lastly, monitor performance metrics in real time. This allows you to quickly detect and fix issues before they escalate and impact delivery.
By focusing on automation, smaller changes, and a well-optimised, observable pipeline, you can cut lead times and deliver results to your customers much faster. Hokstad Consulting can guide you in implementing these strategies to refine your DevOps workflow.
Why is it important to monitor the change failure rate in DevOps?
Keeping an eye on the change failure rate is essential because it reveals how often deployments result in problems or errors. This metric provides valuable insights into process weaknesses, helping teams minimise downtime and boost system reliability.
By monitoring this rate, organisations can fine-tune their workflows, increase the success of deployments, and roll out updates more efficiently. The result? A smoother experience for both the team behind the scenes and the end users relying on the system.