
If I want to know whether a database will cope at 2×, 3×, or 5× demand, I test growth in steps, track P95/P99 latency, throughput, errors, locks, and resource use, then fix the bottleneck before traffic hits production.
In plain English: this guide shows me how to check whether a database still performs well as data size, user concurrency, and system capacity grow. The core process is simple:
- define the business scenario first
- set numeric pass/fail limits
- build a test setup that matches production
- seed data at 1×, 2×, and 5× scale
- run stepped, burst, and long-duration tests
- read results by looking at latency, throughput, errors, CPU, memory, disk I/O, locks, and connection pools together
- make one change at a time
- compare performance against cost per 1,000 transactions (£)
A few points matter most:
- Scalability testing asks: what happens as load and capacity grow?
- Load testing asks: does it meet targets at expected traffic?
- Stress testing asks: where does it fail, and how does it recover?
- A test only counts if the setup is close to production: same DB version, same config, same storage type, same network path, and the same replication layout.
- Empty or tiny datasets give false comfort. I need production-sized data, warm caches, and repeatable snapshots.
- I should judge results with percentiles like P50, P95, and P99, not averages alone.
- Flat throughput with rising latency often points to contention, storage delay, or pool limits - not just lack of CPU.
- After tuning indexes, queries, caching, partitioning, or scaling, I rerun the same scenario to prove the change helped.
Here’s the short version: if I don’t set hard limits such as ≤ 150 ms P95 latency, ≤ 0.5% errors, or 2,000 concurrent connections without refusals, the test data won’t tell me much. If I do, I get a clear view of where performance stays steady, where it slows, and where it breaks.
| Test type | What I use it for | What I watch |
|---|---|---|
| Scalability testing | See how performance changes as load grows | Throughput, P95/P99, CPU, memory, cost |
| Load testing | Check target traffic against SLAs | Latency, throughput, error rate |
| Stress testing | Find failure point and recovery behaviour | Errors, recovery time, data safety |
So this article is not just about running a benchmark. It is about turning test results into a clear plan for capacity, fixes, and spend before the next traffic spike lands.
::: @figure 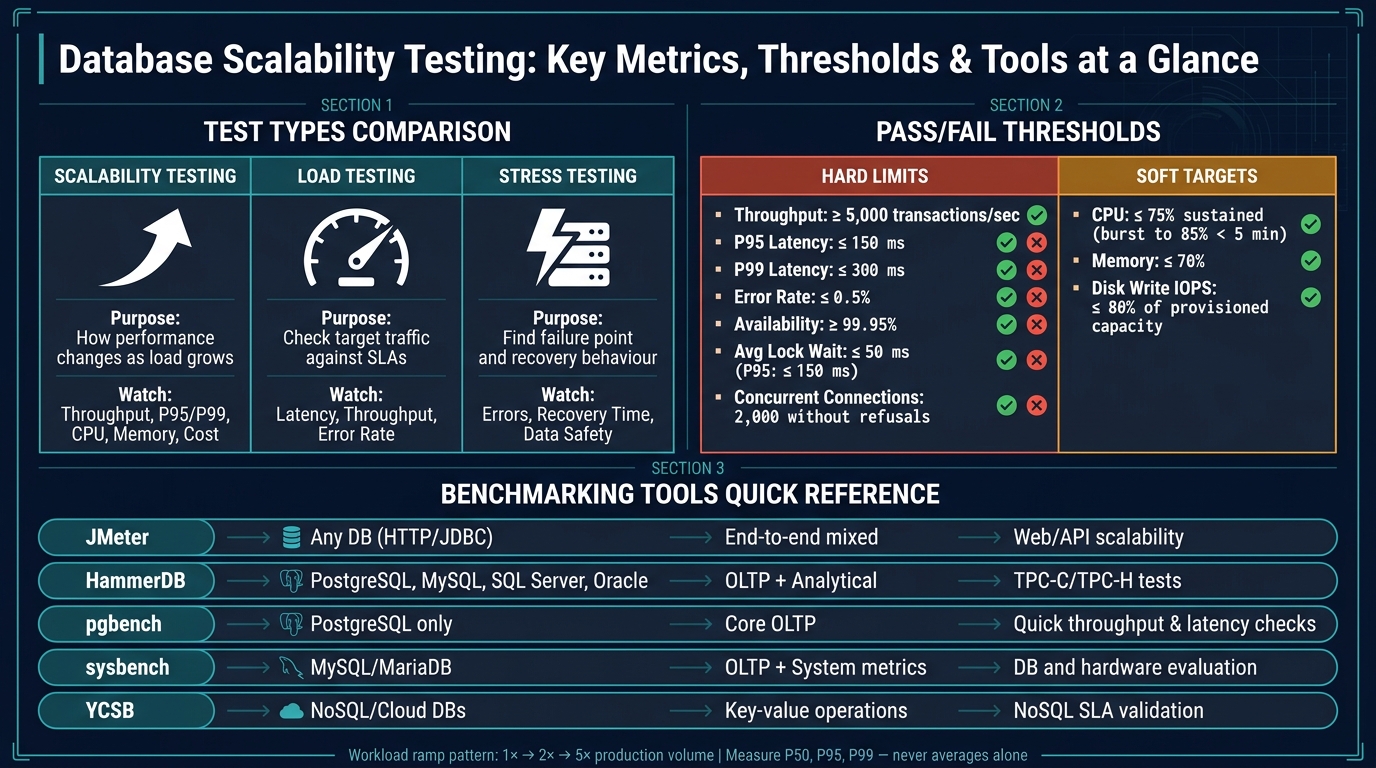 {Database Scalability Testing: Key Metrics, Thresholds & Tools at a Glance}
:::
{Database Scalability Testing: Key Metrics, Thresholds & Tools at a Glance}
:::
Database Performance Benchmarking: A Beginner's Guide
Set test goals and success criteria
Set measurable targets before you benchmark. If you don't, the numbers don't tell you much.
Start with the business event that carries the most risk. That might be a product launch, a month-end payroll run, or a regulatory reporting deadline. Each one creates a different kind of pressure, so name the scenario first. Then turn it into metrics you can test against. The goal is simple: tie business risk to database limits you can measure.
Define the key metrics together, not one by one:
- throughput
- P95 and P99 latency
- error rate
- concurrent connection limits
- lock-wait time
- CPU, memory, disk I/O, and network use
These metrics affect each other. More throughput usually means more CPU and disk pressure. Poor queries or weak indexing can push up P99 latency because of queueing and lock contention. Mark each threshold clearly as either a hard limit or a soft target.
Document each scenario's limits in plain terms.
Choose the workload and growth model
The workload type shapes the whole test. It affects the ramp pattern, the concurrency mix, and the pass thresholds. So this isn't just about what you're testing. It's also about how you set the test up.
A transactional (OLTP) workload needs tight low-latency targets and strong write throughput. An analytical (OLAP) workload can live with P95 latency measured in seconds, but it still needs to run long queries without getting in the way of transactional traffic. Batch workloads usually have looser per-query latency needs, but strict finish times. Mixed workloads matter too. In many mid-sized UK businesses, reporting queries share the same infrastructure as live transactional traffic, especially around month-end and year-end closes. That workload type sets the concurrency ramp, the read/write mix, and the thresholds that decide pass or fail.
Once you've classified the workload, define a growth model that reflects both organic growth and event-driven spikes. Check those assumptions with business stakeholders so the scenarios match actual commercial plans, not guesswork.
Use that workload profile to shape the concurrency ramp and tool choice.
Set pass or fail thresholds
Write thresholds as numeric criteria for each scenario, using en-GB dates and 24-hour time. For example: Scenario: Peak Black Friday checkout. Date: 16 August 2026. Time window: 14:00–15:00.
| Metric | Example Pass Threshold | Type |
|---|---|---|
| Throughput | ≥ 5,000 transactions per second | Hard limit |
| P95 latency | ≤ 150 ms | Hard limit |
| P99 latency | ≤ 300 ms | Hard limit |
| Error rate | ≤ 0.5% | Hard limit |
| Availability | ≥ 99.95% (≈ 21.9 minutes downtime per month) | Hard limit |
| CPU utilisation | ≤ 75% sustained; burst to 85% for < 5 minutes | Soft target |
| Memory utilisation | ≤ 70% | Soft target |
| Disk write IOPS | ≤ 80% of provisioned capacity | Soft target |
| Average lock wait | ≤ 50 ms; P95 lock wait ≤ 150 ms | Hard limit |
| Concurrent connections | Sustain 2,000 without connection refused errors | Hard limit |
A test passes only if every hard limit holds for the full test window. It fails if any hard limit is breached for more than the agreed grace period. In most cases, that's 30 seconds for CPU, and immediate failure for error rate and latency. Batch scenarios use a different rule. For example: All GL posting jobs must complete by 03:00 on 31 March 2027; P99 latency for posting queries must be ≤ 2 seconds.
Automate pass/fail in dashboards. Don't rely on manual judgement.
These thresholds set up the environment and dataset you build next.
Build a production-like test environment and dataset
Your thresholds and scenarios are only as good as the setup behind them. A benchmark on a 2-core development box tells you almost nothing about how the same workload will behave on a 16-core production server [1]. The aim is simple: get your test environment as close to production as you can, so the bottlenecks you spot are the ones that matter. Use the pass/fail limits you’ve already set to decide which production conditions need to be copied here.
Match infrastructure, storage, and network conditions
Use the same major and minor database version as production, along with the same key settings: shared_buffers, innodb_buffer_pool_size, connection limits, and planner options.
But the database engine is only part of the story. The biggest drivers of test results are usually CPU class, memory size, storage throughput, and network layout. Swap a general-purpose cloud instance for a compute-optimised one - even with the same vCPU count - and the database can behave very differently under parallel queries, encryption, and compression. Cut RAM from 64 GiB to 32 GiB and a workload that looked CPU-bound can suddenly become I/O-bound. Storage matters just as much. HDD, SATA SSD, NVMe SSD, and network-attached storage all bring very different latency once the system is under pressure.
Network conditions get missed all the time, and that’s a mistake. If production sends traffic across availability zones or over a VPN link to an on-premises data centre - common in UK hybrid setups - your test setup needs to do the same. A single-host connection might look tidy in a lab, but if production uses a cross-AZ path, that shortcut can hide latency, connection pool saturation, and replication lag.
Replication layout matters too. Mirror the same number of read replicas and the same synchronous or asynchronous replication settings. Then run a controlled failover while the system is under load. That’s how you see whether promotion time and reconnection errors push you past your pass thresholds.
Keep UK test environments in the same region and residency boundary as production, such as eu-west-2 for London workloads. If you want a production-like cloud setup without letting costs run away, specialist support such as Hokstad Consulting can help.
Seed realistic data and prepare warm-up conditions
Empty or undersized databases almost always look faster than full ones [2]. That’s why you need data at production scale, with the same distribution, skew, and referential integrity. If UK GDPR means you can’t use raw production data, take a production snapshot and anonymise PII while keeping those distributions and relationships intact. In plain terms, mask the data rather than swapping it out for random strings that don’t behave like the real thing.
Before you measure anything, warm the system up. Run a 10- to 30-minute warm-up using the same kind of concurrency you expect in production. Only start the measurement window after buffer caches, OS page caches, and just-in-time compilation have settled down.
You’ll also want the whole setup to be repeatable. Save snapshots at each growth stage - 1×, 2×, and 5× current production volume - so every run starts from the same point. Label each snapshot with the date and time in UK format, for example 16/08/2026 14:30, plus the schema version and workload profile. Automate restore steps with infrastructure-as-code, so you’re not introducing manual differences from one run to the next.
With a stable baseline in place, design the workloads that will expose bottlenecks.
Design workloads and choose the right tools
Turn your workload profile into test cases you can run. Start with production telemetry: query logs, slow query logs, and APM traces. That gives you the actual split between SELECT, INSERT, UPDATE, and DELETE operations. For OLTP systems, a checked starting point is about 60% simple SELECTs, 25% INSERT/UPDATE operations, and 15% complex JOINs [3], but your own logs should decide the final mix.
Then define five workload classes:
- read-heavy: 80–95% reads
- write-heavy: 80%+ writes
- mixed OLTP: balanced reads and writes, short transactions
- reporting: long analytical queries
- batch: bulk writes or large updates for minutes or hours
For each one, set the query mix, the usual transaction size in number of statements, the pause between requests, and the total run length. Each class should also have its own concurrency, hold time, and run length. A reporting test, for instance, shouldn’t be treated like a short OLTP burst. They behave differently, so test them differently.
Create test scenarios and concurrency ramps
Change one variable at a time. Keep the query mix, dataset, and think time fixed, then move through concurrency levels such as 50, 100, 200, and 400 concurrent clients. Watch what happens to throughput and latency at each stage [3][4]. Each flat spot tends to point to the next bottleneck.
Every workload class needs its own ramp and its own duration. Stepped ramps are only part of the picture, so run at least three other profiles as well.
A sustained plateau means holding, say, 200 concurrent users for 1–2 hours. This is where CPU saturation, lock contention, and background work like vacuum or index maintenance start to show up.
A burst test is for sharp spikes. Think of a UK ticket sale opening at 10:00: traffic jumps from 50 to 500+ connections, then drops back within minutes. That kind of run tests connection pool limits and autoscaling response.
An endurance test runs at a realistic average load for 8–24 hours. Overnight is often a good fit for UK teams. These longer runs can bring out memory leaks, index bloat, log growth, and clashes with background jobs [4][5].
Keep everything else the same across runs, and record the schema version, configuration, and tool version. If you skip that, comparing results later becomes guesswork.
Use these profiles to pick a tool that can replay the same mix and ramp pattern.
Select benchmarking tools for your database and team
Pick a tool based on the database engine, the layer you want to test, and how comfortable your team is with scripting. Here are the main options:
| Tool | Best for databases | Workload focus | Scripting approach | Typical use case |
|---|---|---|---|---|
| JMeter | Any (via HTTP/JDBC) | End-to-end, mixed | GUI + Groovy/Java | Web/API scalability with DB under load |
| HammerDB | PostgreSQL, MySQL, SQL Server, Oracle | OLTP + analytical | TCL scripts + GUI/CLI | Compare DB engines and configs via TPC-C/TPC-H-derived tests |
| pgbench | PostgreSQL only | Core OLTP | SQL/pgbench scripts, CLI | Quick PostgreSQL throughput and latency checks |
| sysbench | MySQL/MariaDB, generic | OLTP + system metrics | Lua scripts, CLI | Combined DB and hardware evaluation |
| YCSB | NoSQL/cloud DBs | Key-value operations | Config files + Java | Validate NoSQL scalability and SLAs |
Use pgbench or HammerDB for database-level benchmarks, and use JMeter for full application paths. That way, you can line up raw database metrics with the latency users feel on the front end.
If you run MySQL or MariaDB, sysbench’s built-in profiles - oltp_read_only, oltp_write_only, and oltp_read_write - [7][9] give you a fast starting point without the need for custom scripts.
For NoSQL or cloud-native databases, YCSB’s standard workloads A through F cover common patterns such as 50/50 read-write in Workload A and 100% reads in Workload C [8][6]. That makes it much easier to test against defined SLAs.
Record each run against the same scenario definition before moving to bottleneck analysis.
Run tests, analyse results, and fix bottlenecks
With the scenario set, begin each cycle with a baseline run at current production traffic. That gives you a clean point of comparison for throughput, latency, resource use, and cost per operation before you touch anything.
From there, increase load in steps of 50–100 concurrent users every 5–10 minutes. That pause matters. It gives connection pools and caches time to settle so the numbers you collect mean something. Once you reach the target load, keep it steady for at least 30–60 minutes so you can gather percentile-based latency data. Then rerun each scenario under the same conditions to check that the results line up.
Between rounds, make only one controlled change at a time. That might be an index addition, a config tweak, or a query rewrite. Log each change with a timestamp, such as 16/08/2026 14:30, the state of the environment, and exactly what changed. [11][14]
Read metrics and find the limiting factor
When the run settles, read the metrics together instead of one by one. The bottleneck usually shows up in how latency, throughput, and resource use move as a group.
Here’s what to look for:
- Rising p95/p99 with flat CPU usually points to storage latency or cache misses.
- Flat throughput at 40–50% CPU often points to thread contention or connection pool saturation.
- Sustained CPU above 85% for 60 seconds or more at target load points to a CPU bottleneck. [1][10][12][13]
For connection pools, utilisation above 90% is a clear warning sign. At that stage, timeouts and slowdowns become much more likely. [10]
Plot these figures as time-series charts across the full test window. That makes it far easier to spot the exact point where things start to slip. Then rely on percentile-based summaries like p50, p95, and p99 instead of averages. Average latency can look fine while the slowest 1% of requests are failing outright. [12][13]
Optimise indexes, queries, partitioning, caching, and scaling
Once you’ve found the limiting factor, deal with the highest-impact cause first. Think impact first, cost second.
Index changes are often the quickest win. Check execution plans for full table scans, then add composite or covering indexes that line up with your heaviest queries. For instance, a query that filters recent orders by customer can improve straight away with a (customer_id, created_at) composite index. After each change, rerun the same scenario and compare p95 latency and throughput with the last round.
If the pressure sits on a few hot tables, time-based partitioning can help. Monthly partitions for logs or time-series data mean each query touches a much smaller slice of data. For read-heavy workloads, caching stable data in Redis or a similar service can cut database load sharply. Just keep TTLs and invalidation tight enough to stop stale data creeping in, especially for stock levels or prices. [15]
When software-side fixes stop paying off, look at scaling options with cost in mind:
- Read replicas fit read-heavy workloads and add less complexity.
- Vertical scaling gives quick headroom, but larger instance types come with higher hourly costs in GBP.
- Horizontal scaling via sharding spreads load well, but it adds extra complexity around routing and consistency.
Use the test data to work out £ per 1,000 transactions for each setup. [16][17] For cost-aware benchmarking and cloud spend decisions, Hokstad Consulting supports UK organisations across public, private, hybrid, and managed hosting environments.
Conclusion: Turn benchmark results into a repeatable scaling plan
Once the fixes hold up under test, turn the whole process into a repeatable playbook. Repeatable testing helps protect production.
Write down your scenarios, success criteria, and remediation steps in a scalability test playbook that any team member can use. Tie the main tests to release milestones, running them before major releases and again at set traffic growth points. Then feed the results into capacity planning: turn p95 latency targets and throughput limits into resource forecasts and budget estimates in pounds sterling, with UK demand patterns in mind, including seasonal retail peaks.
Review the playbook from time to time as the system changes, and treat scalability testing as a standing part of engineering work rather than a one-off task before a major launch.
FAQs
How often should I run scalability tests?
Make scalability testing part of your regular routine. The exact schedule should match the type of assessment:
- Run smoke tests on every pull request
- Run load tests on nightly builds or in staging
- Run stress tests weekly or before release
- Schedule soak tests weekly or quarterly
- Review performance monthly
- Test disaster recovery quarterly
Your testing plan shouldn't stay fixed forever. Reassess it as business needs change.
What is the biggest mistake in database scalability testing?
The biggest mistake is relying only on average latency instead of looking at consistency and percentile values such as p95 and p99. An average can smooth over sharp spikes, even when those spikes are the very thing users feel.
Other common pitfalls include a poorly defined testing strategy, test environments that don't match production, and failing to automate performance testing in CI/CD pipelines.
When should I scale vertically, horizontally, or use read replicas?
It depends on your workload, performance goals, and growth patterns.
- Scale vertically when demand is steady and predictable, and partitioning isn’t feasible.
- Scale horizontally when you need to handle unpredictable traffic, fast growth, or high availability.
- Use read replicas when reads make up 80% or more of the workload.