
I use complexity routing to cut LLM costs without letting task success or response times slip. The rule: send each request to the lowest-cost model that meets your targets - not simply the model with the cheapest call.
In the article’s hypothetical example, routing cuts monthly spending from £4,000 to £2,300 - a 42.5% saving before any delay penalty. That saving only counts if the answers still pass your checks.
Here’s what I measure and control:
- Model choice: Match routine, general and premium tiers to tested task performance, uncertainty and risk.
- Routing method: Choose a model upfront, or try a cheaper one first and escalate if validation fails.
- Total cost: Count classification, generation, checks, tools, retries and escalation - not just the first call.
- Success and speed: Test thresholds on held-out tasks against fixed-model baselines.
- Production limits: Set budgets, timeouts and rollback rules, then review results as traffic, prices and models change.
My starting point is one low-risk, high-volume workflow. I expand only when cost per successful task falls and quality stays within agreed limits.
Auto Routing Fully Explained | TrueFoundry AI Gateway | Cut LLM Costs by Routing Based On Complexity
Build the Model Routing Pipeline
With routing modes defined, build the measurement pipeline that will set your thresholds. Benchmark three model tiers on labelled, production-like requests to measure cost per successful task.
Define what success means for each workload. Record current input, cached-input and output prices in GBP, alongside the pricing date and any exchange-rate assumption. Also record context-window limits, rate limits, structured-output support, tool-use capabilities, latency, success rate and malformed-output rate.
Set timeout, escalation and monitoring rules before routing live traffic. These measurements give you a baseline for tuning thresholds.
Identify Signals of Task Complexity
Assess task type, context length, reasoning steps, ambiguity, tool requirements and past failure rates. Treat permission and policy constraints as routing signals too.
Token count tells you how much content a request contains, not how difficult it is. Confidence can also stay high when an answer is wrong. Combine observable signals with measured success on similar tasks, and keep those signals for auditing. Only include signals that improve predicted success or expected cost.
Define Routine, General and Premium Tiers
Define tiers by measured task performance, not model size. The routine tier handles predictable, well-structured work. The general tier handles a broader range of language tasks and moderate ambiguity. The premium tier handles difficult reasoning and tasks where failure carries a high cost.
Escalate uncertain or unfamiliar requests by default. Sensitive decisions and high-impact tool actions need explicit policy overrides, deterministic checks and, where appropriate, human approval. A stronger model is no substitute for checking totals, permissions or policy compliance.
Choose Direct Routing or Cascading
Add a lightweight classifier or trained success predictor once you have enough labelled outcomes, then calibrate it on held-out tasks. Measure failed cheap routes separately from unnecessary premium routes: the consequences differ.
Choose based on the cheapest reliable check: prediction before generation or validation afterwards. Use the comparison below to assess which approach gives the lower failure cost.
| Strategy | Cost | Latency | Implementation effort | Failure handling | Suitable workloads |
|---|---|---|---|---|---|
| Heuristic direct routing | Low decision overhead; one model call | Low and predictable | Low; task, context and risk rules | Conservative rules and deterministic validation | Repetitive extraction, classification and FAQ responses |
| Classifier-based direct routing | Classifier inference plus selected model call | Low with a lightweight classifier | Medium to high; labels, calibration and retraining | Route uncertain cases upward or apply fallback | Varied workloads with sufficient labelled outcomes |
| Validated cascading | Cheap attempt, validation and any escalation | Higher on escalation; includes all stages | Medium to high; validators, retries and escalation logic | Escalate failed, malformed or low-quality answers | Code tests, schema validation, retrieval checks and constrained workflows |
Validate format and substance before returning an answer or executing an action. Check for missing fields, policy violations, calculation errors and other failures. Then retry, escalate or request clarification within defined limits.
For every routed request, log classifier and validator costs, retries, the escalation reason, total latency and the final success label. Feed user corrections and human overrides back into evaluation.
Use the cheaper policy only where its measured success rate clears the target. Predict before generation when routing is reliable; validate after generation when checks are stronger than prediction.
Tune Routing Thresholds for Cost and Success
::: @figure 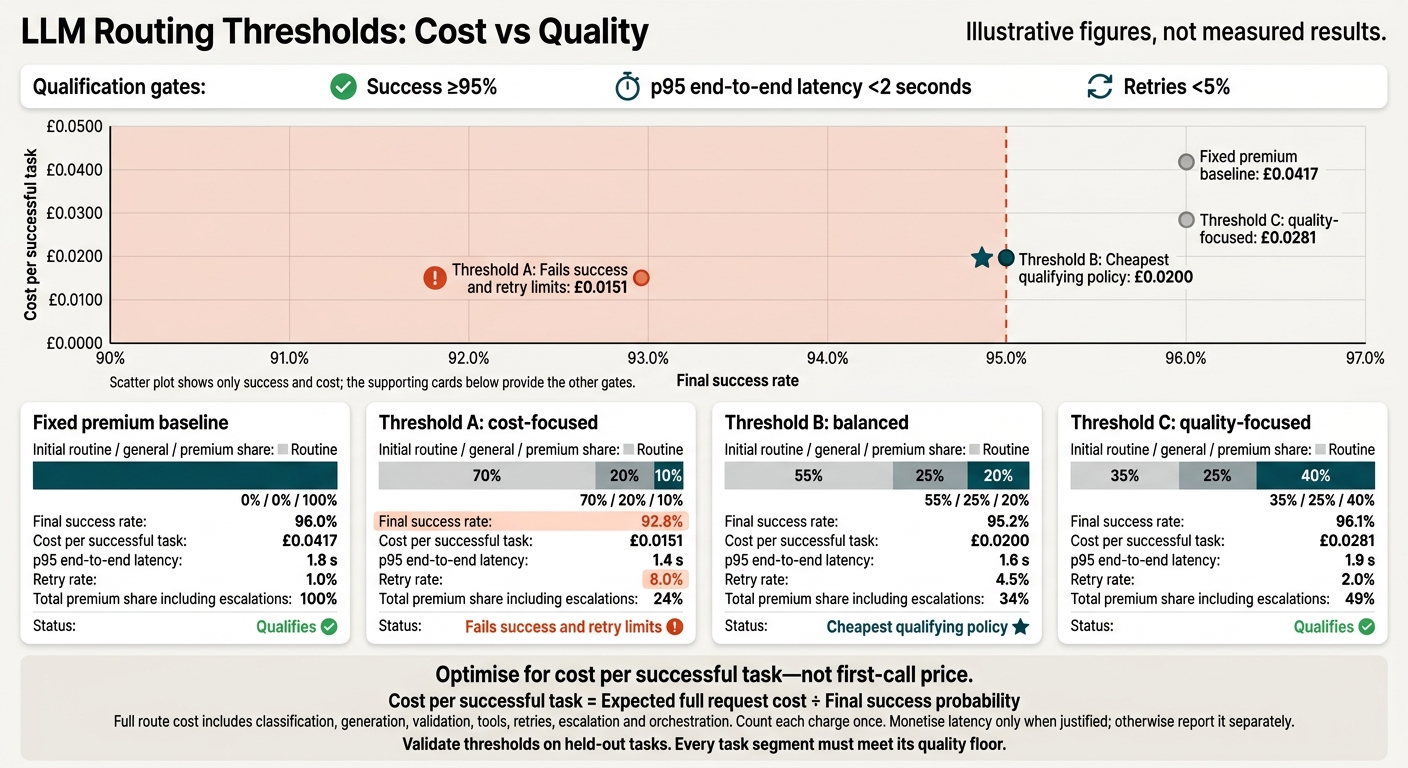 {LLM Routing Thresholds: Cost vs Quality}
:::
Turn measured tier performance into routing thresholds that minimise cost per successful task while meeting success and latency limits. Alternatively, maximise success within a fixed budget.
Estimate success for each task segment and complexity band. Use complexity as the routing signal, with (Q_s) and (Q_p) representing routine and premium success probabilities. Then calculate the traffic-weighted success rate across segments.
Calculate the Full Cost per Request
Let (C_s) and (C_p) be routine and premium invocation costs, (C_c) classification cost, (C_r) expected retry, validation and escalation cost, and (C_o) orchestration cost. For direct routing between two tiers:
[ \mathbb{E}[C]=C_c+P(s)C_s+P(p)C_p+\mathbb{E}[C_r]+C_o+L ]
For cascades, weight invocation costs by their conditional probabilities. Include the general-tier invocation cost, (C_g), weighted by its conditional probability too.
Count uncached-input, cached-input and output tokens, validators and tools, charging each item only once. Input, cached-input, output and built-in tool usage can each have different rates.[5][6] Include (L) only when latency has a clear monetary value. Otherwise, report latency separately.
Divide expected full cost by the final success probability, (Q_{\text{final}}):
[ \text{Cost per successful task}=\frac{\mathbb{E}[C]}{Q_{\text{final}}} ]
Use the expected-cost equation to rank candidate thresholds before testing them on representative tasks.
Find Break-Even Routing Thresholds
Let (V) be the monetary value of one successful task. Route to premium when the extra expected value of success exceeds the extra full cost:
[ V[Q_p(x)-Q_s(x)]>\Delta C_{\text{full}}(x) ]
Here, (\Delta C_{\text{full}}(x)) is the additional full cost of premium routing for the same request, (x).
Compare complete execution paths, not first-call prices. For cascades, use measured retry and escalation rates, validator false-acceptance and false-rejection rates, and premium success conditional on escalation. Overall success rates can overstate premium performance on hard cases. If you cannot reliably assign a value in pounds, use explicit success and latency limits instead.
Hypothetical monthly calculation: At 100,000 requests, a £0.040 premium-only call costs £4,000. Routine-first routing costs £100 for classification, £400 for initial calls, £1,200 for 30% escalation and £600 for retries and validators: £2,300. Cash saving versus the premium baseline: £1,700, or 42.5%. Report the 250 ms p95 latency separately; only add the supplied £0.002-per-request delay penalty if business measurements justify it. That would add £200 and reduce the saving to £1,500. The calculation should also show whether the 30% premium usage includes both direct premium routes and escalations; otherwise premium consumption and savings will be overstated.
Validate break-even thresholds on holdout data before using them in production.
Test Thresholds on Representative Tasks
Test a range of thresholds on evaluation data, then validate the chosen policy on a holdout set. Report sample sizes and uncertainty intervals for each segment, including validator errors and escalation outcomes. Every segment must meet its quality floor.
Choose the cheapest policy that meets your success and latency limits, measured by cost per successful task. On the cost–quality frontier, no qualifying policy offers equal or better success at a lower cost.
Illustrative figures, not measured results: With limits of at least 95% success, p95 latency below 2 seconds and retries below 5%, Threshold B is the cheapest qualifying row. Costs below divide full request cost by final success rate.
Policy Initial routine / general / premium share Final success rate Cost per successful task p95 end-to-end latency Retry rate Total premium share including escalations Fixed premium baseline 0% / 0% / 100% 96.0% £0.0417 1.8 s 1.0% 100% Threshold A: cost-focused 70% / 20% / 10% 92.8% £0.0151 1.4 s 8.0% 24% Threshold B: balanced 55% / 25% / 20% 95.2% £0.0200 1.6 s 4.5% 34% Threshold C: quality-focused 35% / 25% / 40% 96.1% £0.0281 1.9 s 2.0% 49%
Use the selected threshold as the baseline for production validation and risk controls.
Verify Savings and Manage Production Risks
Once you’ve chosen a threshold, test it under production-style controls before sending more traffic through it.
Compare Routing Policies with Fixed-Model Baselines
Compare the candidate threshold against fixed-model baselines on the same workload. Check that savings hold after retries, validation and abandonment.
Test fixed low-cost and fixed premium baselines alongside direct routing and classifier-plus-cascade policies on a versioned workload. Keep prompts, validation rules, retry limits and human-review rules unchanged. Include failed, timed-out and abandoned requests in the denominator.
Define success using business acceptance checks, automated tests, structured-output validation and reviewed samples. Record the test period, traffic volume, model mix and, where possible, confidence intervals. This lets you check the chosen policy under conditions close to production.[2][8]
Report the measures below for each policy. Quality is a pass/fail gate: lower spending does not make up for a quality breach.
| Measure | What to report |
|---|---|
| Task success | Completed tasks ÷ eligible requests, split by risk level |
| Total cost | GBP spend on classification, generation, validation, retries, escalation, human review and hosting or platform charges |
| Cost per request | Total workflow cost ÷ eligible requests |
| Cost per successful task | Total workflow cost ÷ successfully completed tasks |
| Latency | p50 and p95 end-to-end time, including routing, queueing, validation, retries and fallback; report classifier time, generation time and time to first token separately where relevant |
| Retries and escalations | Requests retried or escalated ÷ eligible requests, plus total additional calls |
| Errors and abandonment | Errors, timeouts and abandonments ÷ eligible requests |
Calculate cash savings against the fixed baseline as (baseline cost − routed cost) ÷ baseline cost.[2][1][8] A routed policy may cost less per request but more per successful task if it fails more often. Report latency and abandonment separately.
Only use the winning policy once its savings hold within the limits you’ll apply in production.
Set Spending Limits, Timeouts and Rollback Rules
Treat these limits as guardrails around the routing threshold, rather than separate controls.
Define an uncertainty band around the threshold. Send high-confidence routine tasks to the lower-cost tier, borderline cases to a stronger model or cascade, and high-risk or low-confidence cases to a premium model or authorised reviewer.
Set per-request token and GBP ceilings, daily and monthly budgets, concurrency limits and provider-rate safeguards. Retry only transient failures or recoverable validation errors, using back-off and idempotency protection. Before sending traffic, check provider health, error rates, queue depth, rate-limit responses and model-specific latency.
Log the trace ID, confidence score, selected route, prompt and model versions, costs, timestamps and final outcome. Measure classifier time, queue time, time to first token, generation time, validation time and total end-to-end time, including p50, p95 and p99 values. Start with shadow traffic, then move to a small canary.
Set rollback triggers before launch: for example, a success drop above 2 percentage points, p95 latency up 25%, timeout or abandonment above 1%, or spend 20% above forecast.
Use rolling-window alerts for volatile metrics, but act immediately on severe safety, spending or availability failures. Keep a tested fixed-model fallback.[3][7][10][11][12][13]
Monitor Drift and Update Cost Estimates
Routing thresholds can lose their fit as traffic, prices and model behaviour change. Recheck the costs and savings regularly.
Track outcomes by task type, complexity band, prompt and output length, customer segment, geography, risk level, model and routing decision. Sample apparent successes and failures to spot validator errors. Use human overrides, complaints and rework to update measured success rates.
Re-evaluate thresholds when traffic mix, prompts, context length, models, prices, rate limits, cache-hit rates or retry behaviour change. Recheck classifier cost and latency too. For private or hybrid hosting, include compute, depreciation, electricity, support, utilisation, idle capacity and additional capacity costs.
Log each threshold change, the supporting evidence, the approver and the rollback plan.[1][4][9][11]
Conclusion: Reduce Cost per Successful Task
After validation, use one clear rule: optimise for cost per successful task, not call price. Measure the full route cost, then tune thresholds using representative held-out tasks. Accept savings only if quality and p95 latency stay within agreed limits.[14][8]
Start live use with one low-risk, high-volume workflow. Set a fixed success definition and evaluation set before changing thresholds. Keep validation and monitoring in place as you expand: a successful pilot supports that workflow, not every task.[14][8]
For help designing and implementing a routing policy, Hokstad Consulting offers AI strategy and custom agent implementation support. Assess any routing change against measured task outcomes and cost per successful task.
FAQs
How much evaluation data do I need to set routing thresholds?
Start with 20 to 50 representative tasks, including failed runs, to set a baseline for cost and completion quality. Track success rates and retry frequencies, then use the run traces to calculate the median and 95th-percentile counts for your requirements.
Test your chosen thresholds across a larger set of tasks. Monitor the results and adjust the thresholds to balance performance against costs in £.
How do I calculate savings when retries increase latency?
Compare cost per successful task, not just speed. Add up model charges, tool fees, compute costs and human correction costs for every attempt - including failures. Then divide the total by the number of tasks successfully completed and accepted.
Retries add cost and delay, which can hurt the user experience. A more capable model may cost less overall if it needs fewer retries and avoids the extra work they create.
When does classifier overhead outweigh routing savings?
Classifier overhead outweighs routing savings when the costs of classification, retries, fallback runs and added end-to-end latency exceed what you save by avoiding the more expensive model.
That total includes classifier compute and token spend, plus any corrections or human escalation needed before an outcome is accepted. In practice, as success rates drop, the cheaper path needs more recovery work - and those extra costs eat into the savings.