Workflow monitoring mistakes can quickly inflate costs and reduce efficiency. Key problems include ignoring monitoring during setup, collecting excessive data, neglecting workflow performance metrics, focusing on irrelevant data, and overwhelming teams with poorly tuned alerts. These errors lead to wasted resources, longer downtimes, and unnecessary expenses.
Key Takeaways:
- Start monitoring early: Integrate monitoring into CI/CD pipelines from the beginning.
- Prioritise relevant data: Avoid over-collection; focus on metrics affecting customers and business outcomes.
- Track workflow performance: Monitor pipeline bottlenecks, not just infrastructure health.
- Refine alerts: Reduce false positives and focus on actionable notifications.
- Control costs: Use filtering, down-sampling, and automation to manage data and expenses.
Fixing these issues improves reliability while keeping costs under control. Implement practical strategies like setting clear monitoring goals, using cost-efficient patterns, and automating cost controls for better results.
::: @figure 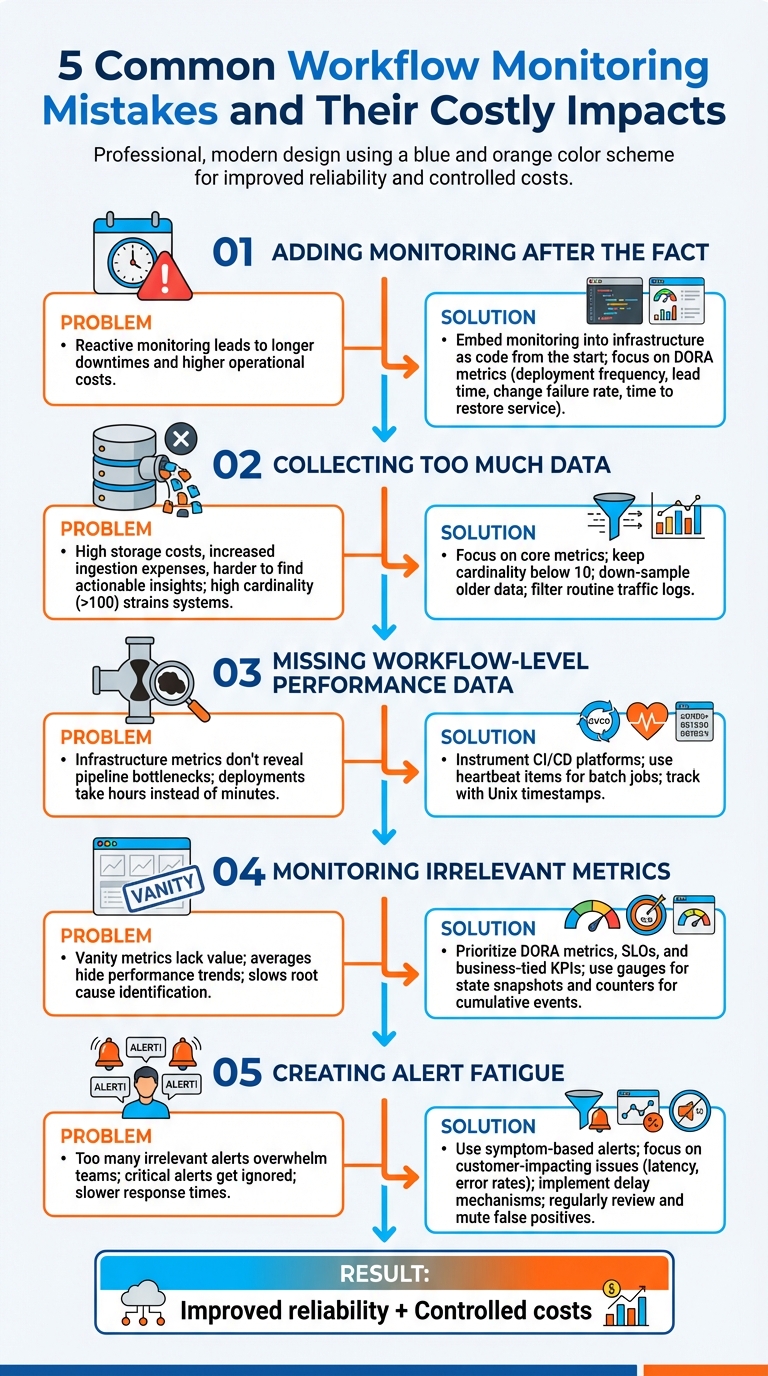 {5 Common Workflow Monitoring Mistakes and Their Solutions}
:::
{5 Common Workflow Monitoring Mistakes and Their Solutions}
:::
Common Workflow Monitoring Mistakes and Their Costs
Mistake 1: Adding Monitoring After the Fact
When monitoring isn't built into CI/CD workflows from the beginning, you’re essentially flying blind until something goes wrong. This reactive strategy often results in longer downtimes and higher operational costs over time compared to catching issues early [2].
The fix? Start by embedding monitoring into your infrastructure as code right from the start. Make observability a core part of your deployment pipelines rather than an afterthought. Focus on metrics that align with DORA standards - like deployment frequency, lead time for changes, change failure rate, and time to restore service. These metrics provide insights that actually matter for improving delivery performance.
Now, let’s explore how collecting too much data can create its own set of problems.
Mistake 2: Collecting Too Much Data
Gathering every possible metric and log without prioritising what’s important is a costly mistake. It eats up storage, drives up ingestion and bandwidth expenses, and makes it harder to find actionable insights during incidents [2][8]. High cardinality labels - like user IDs or IP addresses - can also strain systems such as Prometheus, leading to inflated RAM, CPU, and disk usage when cardinality exceeds 100 [7].
To avoid this, focus on core metrics that directly impact customer experience and business outcomes [2]. Adjust your logging strategy based on the environment: use less verbose logs during development and testing, and only increase verbosity in production as needed [5]. Down-sample older data, aggregating it into hourly views for long-term analysis, and filter out routine traffic logs during ingestion [4][5]. Keeping most metrics below a cardinality of 10 can also help manage resource usage more efficiently [7].
Mistake 3: Missing Workflow-Level Performance Data
Even with proactive monitoring, ignoring workflow-level performance data can leave you in the dark. Monitoring infrastructure metrics alone doesn’t tell you where bottlenecks in your pipeline are slowing things down. For instance, you might know your servers are running fine, but not why deployments are taking hours instead of minutes.
To address this, instrument your CI/CD platforms to track pipeline performance directly. For batch jobs or offline processes, send dummy heartbeat
items through the system to measure propagation times and detect delays [7]. Use Unix timestamps for event tracking instead of time since
calculations to avoid errors if update logic gets stuck [7]. Regularly review trends to spot patterns - are specific stages consistently slow? Do failures tend to occur at certain times or after particular changes?
Mistake 4: Monitoring Irrelevant Metrics
Focusing on vanity metrics may make dashboards look impressive, but they often lack real value. Monitoring individual components without considering how they interact can make it harder to identify root causes and slow down issue resolution [2]. Similarly, relying on averages instead of more nuanced insights, like trimmed means or anomaly detection, can hide important performance trends [1].
Instead, prioritise DORA metrics, SLOs, and KPIs tied to business goals. Define Service Level Objectives (SLOs) with input from technical teams to ensure they’re realistic - misaligned SLOs can lead to frequent SLA breaches and damage customer trust [2]. Use gauges for state snapshots (e.g., in-progress requests) and counters for cumulative events, but avoid taking the rate of a gauge [7]. Focus on metrics that indicate whether customers can use your service effectively, not just whether the infrastructure is running smoothly.
Now, let’s look at how poorly tuned alerts can exacerbate these issues.
Mistake 5: Creating Alert Fatigue with Poor Tuning
Too many irrelevant or unactionable alerts can overwhelm teams, leading to slower responses or, worse, critical alerts being ignored [1].
If alarms frequently sound without actionable cause, trust in the alerting system diminishes, risking slower response times or overlooked genuine alerts.- AWS DevOps Guidance [1]
To combat this, shift to symptom-based alerts that focus on customer-impacting issues like latency, error rates, and transaction failures [9]. Avoid alerting for every minor fluctuation - use delay mechanisms and set thresholds to prevent triggering alerts for temporary issues that autoscaling can handle [9]. Every alert should serve a clear purpose and lead to a specific action. Regularly review alert history to identify and mute false positives. Also, implement no dogs barking
checks to ensure the absence of expected alerts doesn’t go unnoticed, as this could signal a failure in the monitoring system itself [1].
Principles for Cost-Effective Workflow Monitoring
Set Clear Monitoring Goals
Before diving into data collection, it's crucial to define clear success metrics. Start by identifying which workflows are critical - those that directly impact customers - and which are less urgent and can handle occasional disruptions [6]. This approach ensures you're focusing resources where they matter most.
Collaborate with both business and technical teams to set realistic Service Level Objectives (SLOs). When SLOs are developed in isolation, they often miss the mark - either they're overly ambitious, leading to constant failures, or too relaxed, compromising the customer experience [2]. A well-defined health model for each workflow is key. This model should outline what constitutes healthy, degraded, and unhealthy states, ensuring alerts are triggered only when there's a significant issue [6]. These steps help streamline data collection and focus efforts effectively.
Use Cost-Efficient Monitoring Patterns
Monitoring costs can quickly escalate if you're not selective about the data you collect. Start by filtering data at the source. Use agents to exclude unnecessary metrics before they reach costly storage systems. Sampling telemetry data and setting short-term interactive retention periods (e.g., 31–90 days) can also help reduce expenses, while archiving older data for long-term storage [10]. For example, basic debugging or auditing log tables in platforms like Azure can significantly lower ingestion costs [10].
To further optimise, downsample minute-level metrics to hourly aggregates after the first month [5]. If your data usage is high and predictable, consider switching to commitment tiers, which offer discounts on ingestion rates [10]. For less critical workflows, reduce polling frequency - for instance, changing from 60-second to 120-second intervals cuts ingestion volume in half [11]. These targeted strategies help maintain visibility while keeping costs under control.
Automate Monitoring Cost Controls
Once you've established clear goals and efficient data strategies, automation becomes essential for maintaining cost savings over time. Manual cost management simply isn't sustainable. Use Infrastructure as Code (IaC) to enforce cost-efficient monitoring policies across all environments. This could include default retention periods, mandatory log sampling, and tagging resources for better tracking [10]. Set budget alerts at key thresholds - 90% (ideal spend), 100% (target budget), and 110% (over-budget) - to stay ahead of potential cost overruns [4].
Daily ingestion caps are another useful tool, but pair them with alerts at 90% capacity to avoid losing visibility unexpectedly [10]. Machine learning tools can also help by detecting unusual spikes in spending in real-time, allowing for immediate action. Automating the deletion of unused or misconfigured resources, such as orphaned CloudWatch alarms or forgotten diagnostic settings, can prevent unnecessary charges. Assign a specific owner to each cost item to ensure accountability and ongoing optimisation [4].
Implementing Monitoring Improvements in the UK
Start with High-Impact Fixes
Begin by focusing on workflows that most affect UK customers and lead to significant costs. Pay special attention to public beta and live production services where monitoring gaps can directly impact users [12]. Prioritise critical processes such as payment systems, user authentication, or customer-facing APIs - especially those tied to revenue or sensitive data handling.
For instance, the Home Office managed to reduce its cloud expenditure by 40% in July 2021 by bringing together technical architects, commercial experts, and technical accountants to identify potential savings [13]. This collaborative approach ensures monitoring improvements target the most pressing business needs.
Once these priority areas are identified, implement changes step-by-step.
Roll Out Changes in Phases
After addressing high-impact areas, adopt a phased rollout approach to ensure steady progress. During the Alpha phase, define key metrics and monitoring requirements before moving to public beta [12]. Test configurations thoroughly in non-production environments before deploying them to live systems. Centralising logs and metrics into a single analytical platform helps maintain a clear, unified view of system health across your entire stack [5][4]. This approach avoids fragmentation that can occur when teams manage monitoring independently. Additionally, shutting down non-production environments outside UK working hours can help cut idle resource costs [13].
UK-Specific Factors to Consider
Tailor your monitoring strategy to meet the operational and regulatory needs unique to the UK. For example, organisations must use local data storage solutions to comply with data residency regulations, especially in the public sector or when handling sensitive customer information [6].
Review your out-of-hours alerting strategy regularly to minimise unnecessary disruptions during the night, which can lead to higher costs and staff fatigue. Keep alert messages concise and actionable for team members who may be woken at 3 a.m., and where possible, implement automated responses to reduce the need for human intervention [12].
Finally, ensure on-call staff have access to local copies of operations manuals so they can respond effectively during critical outages [12]. These measures not only strengthen workflow performance but also complement earlier strategies to control monitoring costs effectively.
Need help optimizing your cloud costs?
Get expert advice on how to reduce your cloud expenses without sacrificing performance.
Conclusion: Reducing Monitoring Costs
Key Takeaways
Keeping workflow monitoring affordable doesn’t have to be a challenge. Relying solely on reactive monitoring - where action is only taken after incidents occur - can quickly inflate costs. On the other hand, proactive monitoring helps identify trends early, addressing potential problems before they escalate into costly disruptions or user-impacting issues [2][3].
To manage costs effectively, control data volume by using tiered logging and extending metric intervals [11][10]. Well-optimised alerts also play a crucial role, reducing unnecessary notifications and ensuring teams focus on legitimate issues [1]. As Kyle Benson, Product Manager for Cloud Ops at Google, aptly puts it:
If it matters, you should measure it![11]
The trick lies in focusing on metrics that truly matter, rather than attempting to measure everything.
These strategies can lead to immediate improvements in both cost management and system reliability.
Next Steps for Better Monitoring
To put these principles into action, start by reviewing your current monitoring setup. Look for opportunities to simplify and streamline. For example, consider shifting high-cardinality metrics to raw logs and assess whether custom metrics are essential, or if free system-level metrics suffice for non-critical tasks [11]. Assigning a Directly Responsible Individual (DRI) for each cost item ensures accountability and better oversight [4].
Set up multi-threshold alerts at levels like 90%, 100%, and 110% to enable timely responses before issues grow out of control [4]. For expert advice, Hokstad Consulting (https://hokstadconsulting.com) offers tailored solutions to optimise DevOps, cloud infrastructure, and hosting costs - helping to cut expenses while enhancing deployment efficiency.
Mastering AWS Step Functions: Cost Analysis and Optimization Techniques with Ben Smith
FAQs
How can I effectively add workflow monitoring to my CI/CD pipelines?
To weave workflow monitoring seamlessly into your CI/CD pipelines, focus on these essential practices:
Keep an eye on every stage of the pipeline by embedding hooks into the build, test, and deployment phases. This allows you to pinpoint and address issues at their origin without delay.
Use a single monitoring tool that consolidates data from both your applications and infrastructure. Configure it to track logs, metrics, and performance directly from your CI/CD runners.
Identify key metrics such as build times, deployment frequency, and failure rates. If your pipelines run in the cloud, include metrics like CPU usage, memory consumption, and network activity.
Establish baselines and alerts to define normal performance levels and receive real-time notifications for any unusual activity. Focus on actionable alerts to avoid being overwhelmed by irrelevant notifications.
Automate the setup by integrating monitoring configurations into your infrastructure-as-code scripts. This ensures every new environment is consistently equipped with monitoring tools.
By following these steps, you can enhance the reliability of your deployments, minimise errors, and ensure smoother workflows. For businesses in the UK looking for tailored, cost-efficient monitoring solutions, Hokstad Consulting offers expertise to meet your needs.
What are the best practices for managing data collection to reduce unnecessary costs?
Efficient data collection plays a key role in keeping workflow monitoring costs under control. Start by setting clear objectives and focusing on gathering only the metrics that align with your business goals. Collecting unnecessary data not only increases storage and processing costs but also complicates analysis. Implement a standardised naming system for metrics and tags, and automate tagging processes to connect usage with specific teams or projects. Introducing data-retention policies, such as archiving only critical data after a defined period, can also help reduce long-term storage expenses.
Build cost-conscious controls into your monitoring strategy. Real-time alerts and automated dashboards can quickly flag unusual data spikes, while routine audits help identify and eliminate redundant or inactive data streams. Cloud tools are particularly useful for setting budgets, enforcing data caps, and retaining only the information essential for operational reporting.
To go a step further, embed data governance into your DevOps workflows. Assign clear ownership for metric management, enforce tagging and retention rules with automated tools, and leverage AI-driven anomaly detection to catch unexpected cost surges early. By implementing these measures, UK organisations can efficiently monitor workflows while keeping hidden costs at bay.
How can I prioritise metrics that impact customer experience and business goals?
To effectively prioritise metrics, concentrate on those that have a direct impact on the customer experience and align closely with your main business goals, such as boosting revenue, lowering churn, or achieving uptime targets. Start by identifying key performance indicators (KPIs) that reflect these objectives - examples include page-load times, transaction success rates, error rates, availability, and mean time to recovery (MTTR). These metrics serve as essential markers for balancing technical performance with user satisfaction.
Once you've identified the relevant metrics, rank them based on how they influence business outcomes. Begin with broader metrics, like revenue per visit or cost per transaction, and complement them with technical indicators to uncover the reasons behind any performance changes. Avoid gathering unnecessary or repetitive data - focus on metrics that offer actionable insights. Ensure consistency by standardising definitions and thresholds across teams, and use a centralised dashboard to track real-time performance against your agreed service level objectives (SLOs).
It's important to regularly revisit and adjust your metrics to keep them aligned with shifting customer expectations and business priorities. Hokstad Consulting can assist in creating a customised monitoring framework, refining KPIs, and setting up automated alerts to enhance service quality while keeping costs under control.