
Kubernetes Cluster Autoscaler can save you money by scaling nodes based on workload needs. But misconfigurations can lead to wasted resources or performance issues. Here’s how to optimise costs effectively:
- Set accurate resource requests: Avoid overestimating (wastes money) or underestimating (causes scheduling issues). Use tools like Vertical Pod Autoscaler (VPA) or Goldilocks for insights.
- Fine-tune scale-up/scale-down settings: Adjust thresholds and cooldown times. For example, increase the scale-down threshold to remove idle nodes faster or extend cooldowns to avoid frequent scaling.
- Manage node groups: Set appropriate minimum/maximum limits and use consistent node capacities to simplify scheduling.
- Leverage expanders and zone balancing: Use strategies like
least-waste
or prioritise cheaper resources (e.g., Spot Instances) while ensuring even distribution across availability zones. - Avoid autoscaler conflicts: Align Horizontal and Vertical Pod Autoscaler settings to prevent inefficiencies.
- Use scheduled and predictive scaling: Plan scaling during predictable demand surges or lulls to reduce costs during off-peak hours.
- Monitor and audit logs: Regularly review autoscaler logs to identify inefficiencies and misconfigurations.
Set Accurate Resource Requests and Limits
Why Resource Accuracy Matters
When it comes to managing Kubernetes clusters, resource requests play a pivotal role. The Cluster Autoscaler makes scaling decisions based on these requests - not on the actual resource usage. If you overestimate your application's needs, the autoscaler will spin up extra nodes that might not even be necessary. This results in slack
capacity - essentially, you're paying for infrastructure that sits idle.
Accurate resource requests also ensure efficient bin packing, which is crucial for cost management. As noted in the Amazon EKS documentation:
If a container's requests are too high there will be unused capacity which is a large factor in total cluster costs [5].
On the flip side, underestimating requests can be just as problematic. If your pods are assigned fewer resources than they need, they may face CPU throttling or even be terminated due to Out-Of-Memory (OOM) errors. Worse, pods might get stuck in a Pending
state if the cluster lacks the resources to schedule them. The goal is to set requests as close as possible to actual usage, leaving just enough headroom for stability.
For memory, it’s recommended to set requests and limits to the same value to avoid instability [9][6]. For CPU, however, use a more flexible approach: set the request to the minimum your application requires and allow for a generous limit to accommodate bursts in demand [9].
If you're working with Google Kubernetes Engine (GKE), their benchmarks can guide your setup. A cluster is considered overprovisioned if CPU and memory utilisation averages between 7% and 20% over a 30-day span. On the other hand, a cluster is underprovisioned if CPU and memory usage consistently exceed 80% every hour for the same period [6]. These thresholds are a good starting point to check if your resource requests align with actual needs.
Once you've set initial requests, monitoring tools can help you fine-tune them further.
Use Monitoring Tools to Determine Resource Needs
To ensure your resource requests reflect actual usage, turn to monitoring tools. The Vertical Pod Autoscaler (VPA) is a great option. When set to Recommendation
or Off
mode, it analyses historical usage patterns without disrupting your pods [9][5]. The VPA offers insights into CPU and memory usage through three key fields:
- Target: The ideal resource request.
- LowerBound: The minimum acceptable threshold.
- UpperBound: The maximum acceptable threshold [9].
Another helpful tool is Goldilocks, which provides a clear visualisation of resource gaps. Andy Suderman, the creator of Goldilocks, highlights the importance of setting resource requests and limits:
One of my biggest pet peeves when managing Kubernetes is when there are workloads with no resource requests and limits [7].
With these tools, you can start conservatively - set requests slightly below average usage - and refine them as you gather more data. Regular adjustments based on monitoring insights will help strike the right balance between performance and cost.
However, there’s one crucial exception: avoid using VPA for DaemonSet pods. Doing so can lead to unreliable resource predictions for new nodes, which may disrupt the Cluster Autoscaler’s efficiency [3][4].
Kubernetes Cost Optimization: Resource Efficiency Master Guide
Configure Scale-Up and Scale-Down Behaviour
::: @figure 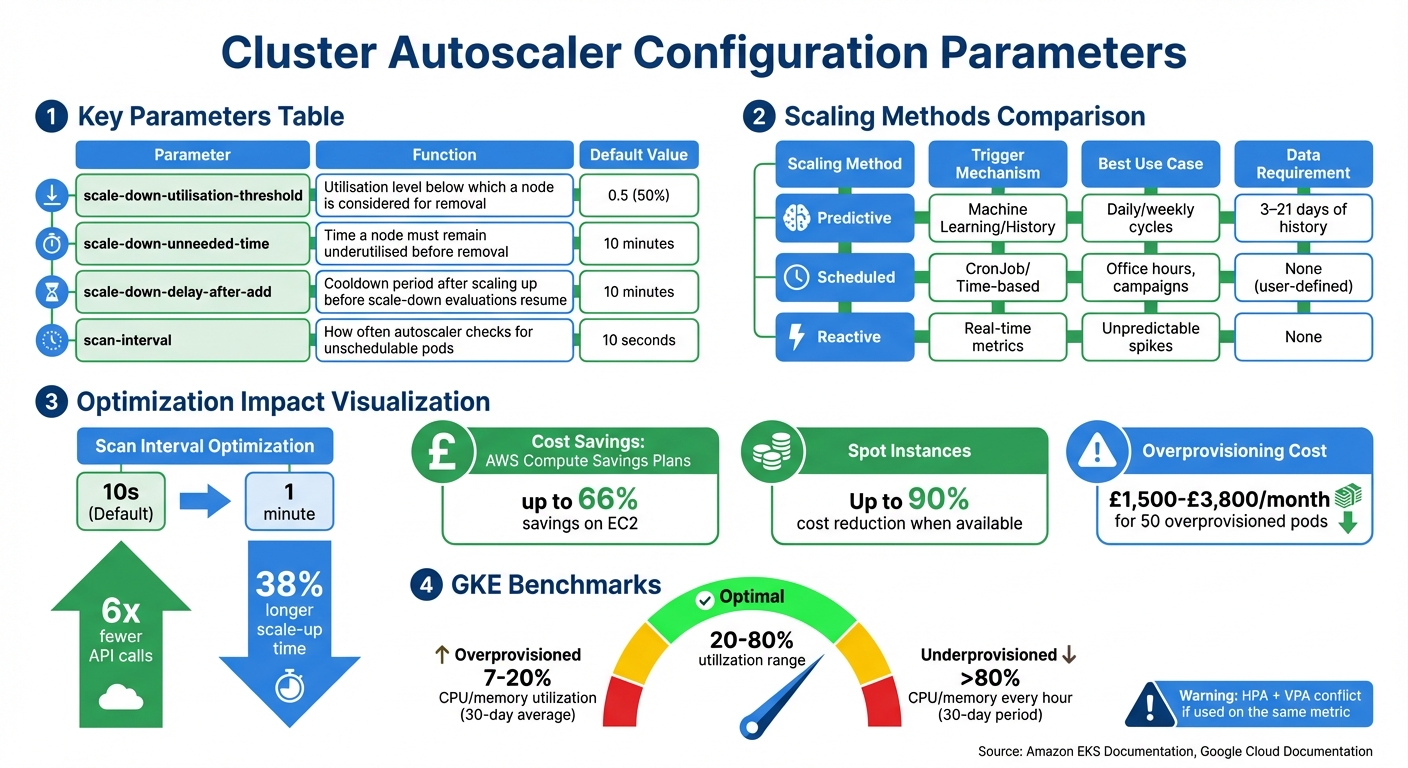 {Kubernetes Cluster Autoscaler Configuration Parameters and Optimization Strategies}
:::
{Kubernetes Cluster Autoscaler Configuration Parameters and Optimization Strategies}
:::
Configure Scale-Up Delays
The scan interval of the Cluster Autoscaler determines how often it checks the cluster for unschedulable pods. By default, this interval is set to 10 seconds[2], but such frequent checks can result in a high number of API calls to Kubernetes and your cloud provider.
For example, on AWS, launching an EC2 instance typically takes about 2 minutes. Increasing the scan interval from 10 seconds to 1 minute reduces API calls by six times, with only a minor trade-off - a roughly 38% increase in the overall time it takes to scale up[1].
If your application demands immediate capacity, overprovisioning can be a practical solution. This method involves deploying low-priority pause pods
to create a buffer of spare capacity in the cluster. When high-priority pods need to run, they preempt these pause pods while the autoscaler works in the background to add new nodes. For applications that rely on AntiAffinity rules to maintain high availability, you might want to overprovision by adding as many extra nodes as there are availability zones in your node group[1].
In cases where nodes take a long time to initialise - such as when GPU drivers need to be installed - startup taints can be applied to mark these nodes as not ready. This prevents the autoscaler from triggering additional scale-ups while the node is still preparing[10].
Once scale-up settings are optimised, you can focus on fine-tuning scale-down parameters to balance cost efficiency with performance.
Adjust Scale-Down Thresholds
Configuring scale-down thresholds is just as important as optimising scale-up settings, especially when it comes to managing costs by reducing idle capacity. The autoscaler identifies nodes for removal based on their scale-down utilisation threshold, which defaults to 0.5. This means nodes using less than 50% of their requested CPU and memory capacity are eligible for removal[2]. Raising this threshold to 0.6 or 0.7 can make the autoscaler more aggressive in removing idle nodes, improving cost efficiency. However, a higher threshold increases the likelihood of pod evictions and service interruptions[11]. For batch or non-production environments, this trade-off might be acceptable, but for production systems with strict latency requirements, a lower threshold helps maintain a buffer of available resources.
The scale-down unneeded time setting, which defaults to 10 minutes, ensures that a node remains underutilised for a specific period before being removed[2]. This prevents thrashing
, where nodes are repeatedly removed and recreated due to short-term demand spikes. For workloads that involve costly operations, such as machine learning tasks, extending this interval can prevent premature node termination during temporary dips in usage.
| Parameter | Function | Default Value |
|---|---|---|
scale-down-utilisation-threshold |
Utilisation level below which a node is considered for removal | 0.5 (50%)[2] |
scale-down-unneeded-time |
Time a node must remain underutilised before removal | 10 minutes[2] |
scale-down-delay-after-add |
Cooldown period after scaling up before scale-down evaluations resume | 10 minutes[2] |
When using aggressive scale-down thresholds, it’s crucial to configure Pod Disruption Budgets (PDBs). These ensure that a minimum number of replicas remain available during node drainage. For workloads that are expensive to restart or highly critical, you can use the annotation cluster-autoscaler.kubernetes.io/safe-to-evict=false to prevent these nodes from being scaled down[2][5].
Manage Node Groups Effectively
Managing node groups well can significantly influence cloud costs by cutting down on idle resources and ensuring scaling happens smoothly and predictably.
Set Minimum and Maximum Node Limits
The Cluster Autoscaler works within the minimum and maximum limits set in your cloud provider's Auto Scaling Group, never scaling beyond these boundaries. Setting these limits correctly is key to balancing cost savings with reliable operations.
Be cautious about setting the minimum node count too high. If the minimum exceeds what your workload needs during quieter periods, you’ll end up paying for underused nodes. To optimise costs, set the minimum node count to match off-peak requirements. For regular business hours, adjust the desired count to handle the expected workload. In non-production environments, consider allowing node groups to scale down to zero during idle times to eliminate unnecessary costs.
On the other hand, ensure your maximum node limit stays within your cloud provider’s quotas. If you exceed these quotas, the autoscaler might keep trying to provision nodes that can't be created, leading to unnecessary API calls and delays. To avoid disruptions, maintain at least one manually managed node pool outside the Cluster Autoscaler’s control. This ensures critical components like CoreDNS continue running smoothly.
Once your node limits are set to match demand, focus on keeping node capacities uniform to streamline scheduling and further reduce costs.
Maintain Consistent Node Capacities
Uniform node capacities make scheduling easier and prevent resource wastage. The Cluster Autoscaler assumes that all nodes in a group share identical scheduling properties such as CPU, memory, and GPU capacity. When mixed instance policies are used, the autoscaler schedules pods based on the first instance type listed. If subsequent instances in the group have larger capacities, resources may go unused; if smaller, pods might fail to schedule.
Each Node in a Node Group \[must have\] identical scheduling properties, such as Labels, Taints, and Resources.- Amazon EKS Documentation
To avoid these problems, select instance types with matching CPU-to-memory ratios. For example, M4, M5, M5a, and M5n instances typically share similar configurations, making them safe to mix within a single node group. Consolidating workloads into fewer, larger node groups with consistent capacities simplifies scalability and reduces the effort required to manage multiple small groups. For GPU-heavy tasks, isolate these workloads using taints and tolerations instead of creating numerous small node groups. This approach ensures efficiency and keeps management straightforward.
Use Expander Strategies and Availability Zone Balancing
Picking the right expander strategy and ensuring nodes are evenly spread across availability zones can save resources, lower data transfer costs, and improve system reliability.
Choose the Right Expander Strategy
The Cluster Autoscaler relies on expander strategies to decide which node group to scale when multiple groups can accommodate pending pods. The least-waste strategy is often the go-to choice for cost-conscious setups. It prioritises scaling the node group that will leave the least amount of unused CPU and memory after the scale-up, reducing resource fragmentation [2].
The strategy --expander=least-waste is a good general purpose default... it could help further cost-optimize the node groups by scaling the group which would be best utilized after the scaling activity.- Amazon EKS Documentation [2]
For those looking to save even more, the priority expander allows you to favour cheaper capacity types. By configuring a ConfigMap named cluster-autoscaler-priority-expander, you can assign higher priorities to Spot or Reserved node groups over On-Demand groups. If the highest-priority group can't scale within the default 15-minute provision window, the autoscaler will automatically try the next group. This method can cut costs by up to 90% when Spot capacity is available [5]. Pairing this strategy with balanced node distribution enhances cost efficiency even further.
Balance Scaling Across Availability Zones
Enabling balance-similar-node-groups=true ensures the Cluster Autoscaler keeps nodes evenly distributed across availability zones. This setup is especially crucial for stateful applications using zonal storage like Amazon EBS volumes, which are tied to a single zone. Without proper balancing, pods requiring zonal storage might remain unscheduled.
By spreading nodes evenly, you can cut down on cross-zone data transfer costs and ensure resources are available where they're needed. A good practice is to overprovision nodes to match the number of availability zones in your Auto Scaling Group, ensuring access to zonal resources. To make this work effectively, node groups across zones should have identical scheduling properties, including labels, taints, and resource configurations.
When combined, these expander strategies and zone balancing techniques form a solid foundation for keeping costs in check while maintaining optimal performance.
Need help optimizing your cloud costs?
Get expert advice on how to reduce your cloud expenses without sacrificing performance.
Avoid Conflicts Between Autoscalers
When multiple autoscalers operate at the same time, they can clash, driving up costs and negatively affecting performance. Coordinating these systems effectively is a key part of keeping cloud expenses in check. Here's how to synchronise autoscaler operations without sacrificing efficiency or overspending.
Understand Conflicts Between HPA and VPA
One frequent issue occurs when the Horizontal Pod Autoscaler (HPA) and Vertical Pod Autoscaler (VPA) focus on the same resource metrics, such as CPU or memory usage. This overlap can lead to a feedback loop where adjustments from one autoscaler disrupt the other, resulting in inefficient resource allocation.
The net benefit of any autotuning or adjustment by a VPA may be reversed or undone by an unharmonised HPA when the two systems duel to assert conflicting homeostasis against common observations such as CPU or memory usage.- StormForge [13]
The problem becomes worse when VPA operates in Auto
mode, as it triggers pod restarts, interfering with HPA's efforts to stabilise the number of replicas. For example, if HPA increases replicas while VPA simultaneously raises resource requests, the Cluster Autoscaler may end up overprovisioning nodes. This misalignment can lead to significant waste - up to £1,500 to £3,800 per month for a cluster with 50 overprovisioned pods [12].
These challenges underline the importance of aligning autoscaler strategies.
Align Autoscaler Policies
To avoid conflicts, assign distinct responsibilities to each autoscaler. Ensure that HPA and VPA do not target the same metrics, and configure VPA to operate in Recommendation
or Audit
mode. This way, VPA can provide resource-sizing suggestions without causing disruptive pod restarts. For instance, you could set HPA to manage replicas based on CPU, while VPA focuses on offering memory-related recommendations.
You should run the VPA in auditing mode so it does not automatically make changes and restart your pods.- Amazon EKS Best Practices Guide [5]
Additionally, carefully configure Pod Disruption Budgets (PDBs) to prevent them from interfering with the Cluster Autoscaler's ability to consolidate nodes. For example, if you have six pods and need at least four running, set minAvailable to four. This approach keeps pod performance stable while avoiding unnecessary node provisioning, ultimately helping to reduce costs.
Implement Scheduled and Predictive Scaling
Workloads often follow predictable patterns. Instead of reacting to these changes as they happen, planning for them can help cut costs during off-peak times while ensuring enough capacity is available when demand increases. These strategies work alongside autoscaler adjustments to align resources with expected demand.
Use Cron-Based Scaling
Scheduled scaling lets your cluster adjust its capacity based on time rather than waiting for a surge in activity. This is particularly useful for businesses with consistent operating hours or predictable traffic patterns. For instance, a retailer might scale down overnight and ramp up in the morning, avoiding unnecessary resource use during quieter hours.
A scheduled autoscaler is useful if your traffic has a predictable ebb and flow - for example, if you are a regional retailer, or if your software is for employees whose working hours are limited to a specific part of the day.– Google Cloud Documentation [14]
To set up scheduled scaling, Kubernetes CronJobs can be used to export desired replica counts to a custom metric, using tools like Cloud Monitoring or Prometheus. Then, configure your Horizontal Pod Autoscaler (HPA) to rely on the higher value between this scheduled metric and real-time CPU usage. Set minReplicas to 1 in your HPA configuration to allow workloads to scale down completely during quiet times. However, if you’ve committed to reserved instances or similar discounts, avoid scaling below that minimum. Instead, consider using the spare capacity for tasks like batch processing.
Use Historical Data for Predictive Scaling
Predictive scaling goes beyond time-based schedules by analysing historical trends to forecast demand. Using machine learning, predictive autoscaling examines at least three days - and up to three weeks - of CPU usage history [15]. This approach blends past trends with current usage to prepare your cluster for expected surges, helping to manage costs by scaling resources ahead of time.
To make this work effectively, set an initialisation period that aligns with your application’s boot time, ensuring instances are ready when demand hits. Before rolling predictive scaling into production, monitor the predicted size
versus the actual size
over a week to confirm it can handle demand without overloading [15]. Most cloud providers offer predictive scaling features at no extra charge, though you’ll still pay for the compute resources provisioned.
| Scaling Method | Trigger Mechanism | Best Use Case | Data Requirement |
|---|---|---|---|
| Predictive | Machine Learning/History | Daily/weekly cycles | 3–21 days of history |
| Scheduled | CronJob/Time-based | Office hours, campaigns | None (user-defined) |
| Reactive | Real-time metrics | Unpredictable spikes | None |
It’s also a good idea to set up alerts to notify you if the scheduled metric stream is inactive for more than five minutes. This ensures your CronJobs are functioning as expected [14]. Hokstad Consulting suggests combining these scaling methods to align resources with demand, improving performance while keeping costs in check.
Monitor and Audit Cluster Autoscaler Logs
Keeping an eye on and regularly reviewing autoscaler logs is key to ensuring your scaling policies deliver the cost savings and performance improvements you expect. These logs provide a detailed account of why your cluster scales up or down - or why it doesn’t when you think it should. Without regular audits, you risk losing visibility, overlooking opportunities to save money, and missing ways to boost efficiency. The Cluster Autoscaler bases its decisions on resource requests, node usage, and various constraints, all of which leave a trail in the logs.
Monitor Key Metrics
One of the most important metrics to track is node utilisation, which measures the ratio of requested resources to total capacity. This metric is a cornerstone of scaling decisions, and you can refer to earlier sections for default utilisation and timing parameters.
Pay close attention to unschedulable pods - these are often the main reason for scale-up events [2]. Keep an eye out for rapid cycles of scaling up and down, as these can signal unstable policies [8]. Additionally, monitor the Cluster Autoscaler’s resource consumption. In clusters with over 1,000 nodes, it may use more than 1GB of memory, as it stores the entire cluster state in RAM [2].
By combining these metrics with log analysis, you can identify areas where thresholds might need adjustment to enhance efficiency.
Analyse Logs to Tune Thresholds
Auditing logs can uncover specific issues that may be blocking cost-saving opportunities. For example, look for pods marked with cluster-autoscaler.kubernetes.io/safe-to-evict=false or those constrained by restrictive Pod Disruption Budgets. These settings can prevent the autoscaler from consolidating underutilised nodes [2][5]. If you notice nodes staying idle but nearing threshold limits, you might want to increase the scale-down-utilization-threshold to encourage more aggressive downsizing [2].
Check the cluster-autoscaler-status ConfigMap to get real-time insights into which nodes are flagged as candidates for scaling down [16]. If nodes are being terminated too quickly after brief traffic drops, adjusting the scale-down-unneeded-time can help reduce unnecessary thrashing [2]. On the other hand, if logs reveal avoidable scale-outs - particularly with hardware like GPUs, where device plugins can take several minutes to advertise resources after a node joins - you may need to recalibrate your scale-up timing expectations [2].
For even deeper insights, enable provider-specific logging to capture JSON-formatted scaling events [17]. Pay special attention to noScaleUp and noScaleDown events, as these can reveal issues like quota limitations, IP address exhaustion, or other factors preventing necessary scaling actions [17].
Hokstad Consulting advises setting up alerts for scaling failures and conducting weekly log reviews to spot patterns that could indicate misconfigured thresholds or resource requests. Consistent log audits help fine-tune scaling policies, ensuring they align with your cost-saving and performance goals.
Conclusion
Fine-tuning the Cluster Autoscaler is an ongoing process that requires careful adjustments to configurations. Accurate resource requests and limits are at the heart of effective scaling. Overestimating these requests can lead to paying for unused capacity, while underestimating them risks scheduling issues and degraded performance.
A smart mix of Spot, Reserved, and On-Demand instances can significantly cut costs. For example, AWS Compute Savings Plans offer savings of up to 66% on EC2 costs [5]. Adjusting parameters like scale-down-utilisation-threshold (set to 50% [5][2]) and scale-down-unneeded-time (configured to 10 minutes [5][2]) allows for quicker removal of underutilised nodes, improving efficiency.
As Saulius Mašnauskas from Cast AI points out:
The tighter your Kubernetes scaling mechanisms are configured, the lower the waste and costs of running your application [18].
This highlights the importance of aligning Horizontal Pod Autoscaler settings with Cluster Autoscaler policies. Avoid conflicts with tools like the Vertical Pod Autoscaler and ensure Pod Disruption Budgets don’t block necessary scale-downs. Regular monitoring with tools such as Prometheus or Kubecost can help identify patterns and refine thresholds, preventing costly inefficiencies.
Cost-saving opportunities also arise from optimising resource provisioning. Strategies like scheduled scaling during off-peak hours, prioritising cheaper node groups with expanders, or using pause pods to create overprovisioning buffers can all contribute to reduced expenses. The key is consistent adjustments, as Amazon EKS Best Practices advises:
Continually adjusting an application's resource requirements is more important than getting them right the first time [5].
Hokstad Consulting offers tailored cloud cost engineering and DevOps services to help you implement these strategies. By refining your Kubernetes infrastructure, you can achieve efficient scaling while keeping cloud expenses in check.
FAQs
How can I optimise Kubernetes resource requests to reduce cloud costs?
To keep cloud expenses in check, it's crucial to fine-tune resource requests and limits for your Kubernetes pods. This helps the scheduler allocate just the right amount of resources, avoiding over-provisioning while ensuring your applications perform as expected. Use monitoring tools like Prometheus or Grafana to track actual usage and make adjustments based on real-time metrics.
Another effective strategy is setting up the Horizontal Pod Autoscaler (HPA). This tool dynamically adjusts resources according to demand. By defining accurate utilisation thresholds, you can scale your pods efficiently, reducing waste and keeping costs under control. These approaches ensure resources are allocated based on actual requirements, balancing cost efficiency with reliable performance.
How can I ensure balanced node distribution across availability zones in a Kubernetes cluster?
To ensure your Kubernetes cluster remains resilient and fault-tolerant, it’s crucial to distribute nodes evenly across availability zones (AZs). This can be achieved by configuring the Cluster Autoscaler to manage workloads effectively across the zones. With the right constraints and policies in place, the autoscaler helps prevent overloading in any single zone, keeping your cluster balanced and better prepared for potential disruptions.
A few best practices can make a big difference here. First, enable the autoscaler to dynamically adjust node counts according to workload demands. This helps avoid both underutilisation and bottlenecks in specific zones. Additionally, leveraging affinity and anti-affinity rules ensures workloads are intelligently placed. Combine these with cloud provider tools, like zone-aware autoscaling, to maintain a well-distributed setup that also keeps costs in check.
How can I avoid conflicts between the Horizontal Pod Autoscaler and Vertical Pod Autoscaler in Kubernetes?
To ensure smooth operation between the Horizontal Pod Autoscaler (HPA) and Vertical Pod Autoscaler (VPA), it’s crucial to configure their policies thoughtfully. These tools can sometimes overlap in how they adjust resources, so defining clear roles for each is essential.
For instance, you might assign the HPA to handle scaling based on workload demand, such as CPU or memory usage, while the VPA takes care of fine-tuning resource requests and limits for individual pods. It’s a good practice to avoid enabling both autoscalers on the same set of pods, as this can lead to conflicting adjustments.
By clearly separating their responsibilities and understanding how each tool functions, you can optimise scaling efforts effectively, minimising resource contention and avoiding unnecessary costs.