
Cloud networking costs are often confusing, with charges spread across multiple dimensions like egress fees, data transfers, and managed services. For UK businesses, additional challenges include currency conversion fees and compliance with UK GDPR. Networking typically accounts for 10–20% of total cloud spend, but this can rise to over 30% in data-heavy setups. Understanding key terms like egress, ingress, and availability zones is crucial for managing these costs effectively.
Key Takeaways:
- Egress Costs: Data leaving the cloud is charged, while ingress (data entering) is generally free. Rates can range from $0.09/GB to $0.12/GB for internet egress.
- Cross-Zone Traffic: Transfers between availability zones cost $0.01/GB per direction, which can add up in microservices-heavy systems.
- Private Connectivity: Options like AWS Direct Connect can reduce egress costs but come with fixed fees, making them suitable for high-volume transfers.
- Managed Services: Tools like load balancers and NAT gateways add hourly and per-GB processing fees, increasing overall networking costs.
- Regional Pricing: Costs vary by location. For example, UK egress rates are higher compared to some European providers like Scaleway or OVHcloud.
To reduce costs:
- Use VPC Gateway Endpoints to avoid NAT Gateway processing fees.
- Enable zonal affinity in Kubernetes to minimise cross-zone traffic.
- Consider CDNs to lower origin egress costs.
Cloud networking charges are complex but manageable with proper planning and cost awareness.
Core Components of Cloud Networking Costs
Data Transfer Costs: Egress vs Ingress
Cloud networking costs aren’t evenly balanced. While ingress (data uploads) is free, egress (data downloads) comes with a price tag. This approach encourages users to upload their data but makes retrieving it costly, effectively discouraging customers from switching providers.
For applications that serve external users - like websites, APIs, or media platforms - egress costs are unavoidable and ongoing. For example, AWS charges $0.09 per GB, Azure $0.087 per GB, and Google Cloud Platform’s Premium Tier $0.12 per GB for standard internet egress [7]. These fees typically make up 6–12% of a standard cloud bill, but the percentage can skyrocket in data-intensive setups [7].
Cloud providers price egress high because once your application is running, switching clouds means re-architecting everything. The cost of moving is higher than the cost of staying.[8]
Let’s take a closer look at how costs stack up when data moves across regional or provider boundaries.
Intra-Region, Inter-Region, and Inter-Cloud Transfer Costs
The cost of data transfer depends on where the data is headed. Moving data within the same Availability Zone (AZ) is often free when using private IPs. However, costs begin to climb when data crosses into other AZs, regions, or even providers.
| Boundary | Description | Typical Cost |
|---|---|---|
| Intra-Zone | Within the same AZ (private IPs) | Usually £0.00 |
| Cross-AZ | Between AZs in the same region | ~$0.01/GB per direction |
| Inter-Region (same continent) | e.g., London to Frankfurt | $0.01–$0.02/GB |
| Internet Egress | To end-users or the public internet | $0.05–$0.12/GB |
For businesses using microservices architectures, even the seemingly small $0.01 per GB each way for cross-AZ transfers can add up quickly, inflating monthly bills. When transferring data between providers, such as from AWS to GCP, the charges are even higher, as these are billed at full internet egress rates. Being aware of these boundaries is crucial for managing costs effectively, particularly in the UK market. It also influences decisions on connectivity options.
Public Internet vs Private Connectivity
If your business handles high egress volumes regularly, private connectivity might save you money in the long run. Services like AWS Direct Connect, Azure ExpressRoute, and Google Cloud Interconnect offer dedicated physical connections. These can lower egress rates from $0.09/GB to around $0.02/GB [7]. However, they come with a fixed port fee, which only becomes cost-effective if you’re transferring more than 5–10 TB per month [1].
Data transfer pricing on AWS is not going to get simpler. As architectures get more distributed... the networking line on your bill will only get bigger and harder to ignore.- Aman Soni, Product Manager, Economize [10]
For UK businesses that rely on low-latency or high-volume data transfers, private connectivity can also offer better performance compared to the public internet, which often operates on a best-effort basis.
Networking in the Cloud Fundamentals: Data Transfer Pricing
Egress Fees and Data Transfer Path Costs
::: @figure 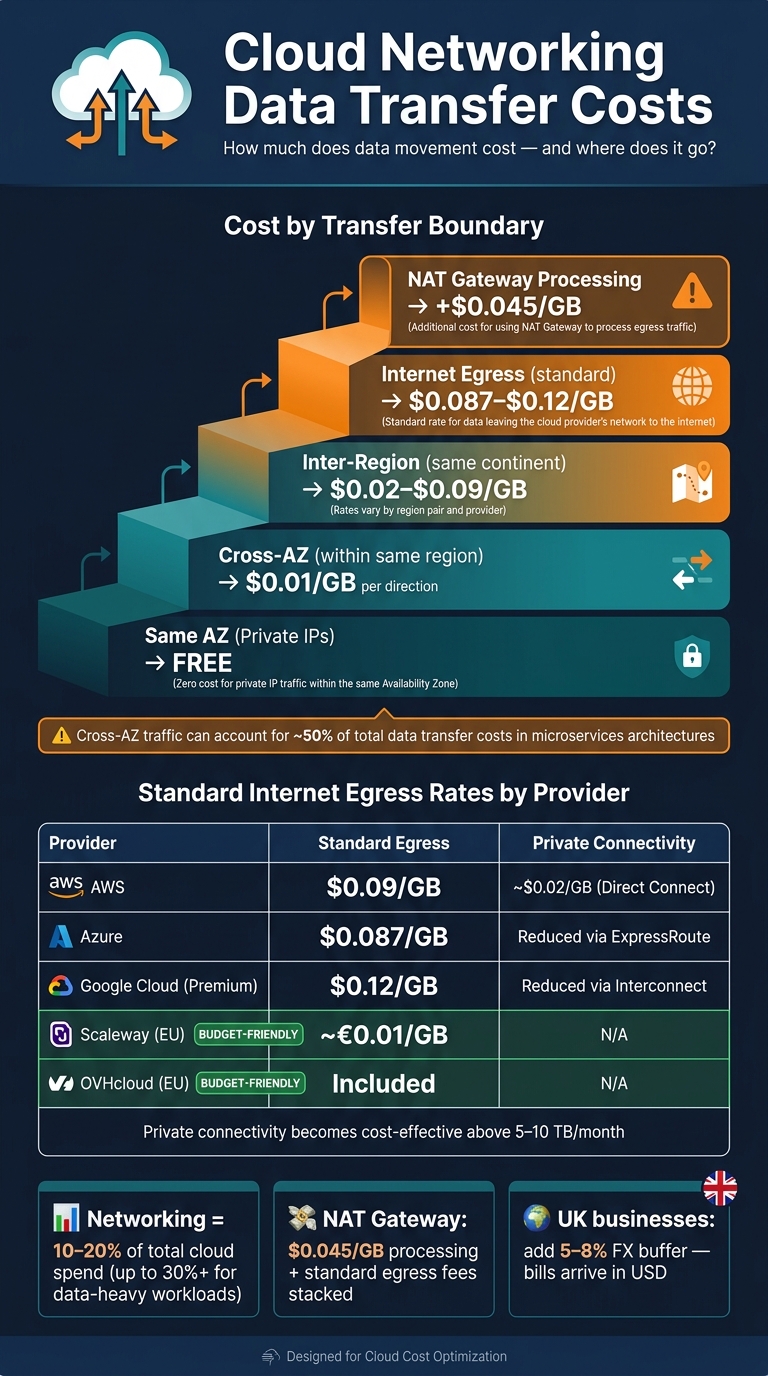 {Cloud Networking Data Transfer Costs: A Complete Pricing Breakdown}
:::
{Cloud Networking Data Transfer Costs: A Complete Pricing Breakdown}
:::
Types of Egress Fees
Egress fees aren't just one flat charge - they're a collection of costs that vary depending on where your data is heading. These fees increase with every additional transfer boundary your data crosses.
The primary categories include:
- Internet egress: When data exits to the public internet.
- Inter-region transfer: When data moves between geographic regions.
- Cross-AZ transfer: When data is transferred between Availability Zones within the same region.
- Private connectivity charges: Costs tied to VPN tunnels or dedicated links like AWS Direct Connect or Azure ExpressRoute.
These fees can add up quickly. For example, data leaving a private subnet via a NAT Gateway incurs both an internet egress fee and an additional $0.045/GB processing charge [13]. Often, these compounded costs only become apparent when the cloud bill arrives.
Egress fees aren't a technical detail. They're a pricing model designed to work in the background until the first surprising invoice arrives.- Thomas Ens, lowcloud [14]
Egress charges typically account for 15–20% of total cloud spending [8], but for data-heavy workloads, this percentage can climb significantly. Let’s explore how these fees are structured based on the data's transfer path.
How Data Transfer Paths Affect Costs
The route your data takes through a cloud provider's network directly impacts the charges you face. The basic principle is simple: each boundary crossed adds a cost.
| Transfer Path | Typical Cost (USD) |
|---|---|
| Same AZ (private IPs) | Free |
| Cross-AZ (within same region) | $0.01/GB per direction |
| Inter-region (same continent) | $0.02–$0.09/GB |
| Internet egress (first tier) | $0.087–$0.12/GB |
| NAT Gateway processing | $0.045/GB |
While cross-AZ traffic seems relatively inexpensive at $0.01/GB per direction, it can make up around 50% of total data transfer costs [13].
As one engineer noted:
The cross-AZ charge of $0.01/GB per direction sounds small. It compounds.- Muskan, Cloud Engineer, DEV Community [13]
Another layer to consider is the added cost of managed services. For example, on AWS, using a Transit Gateway instead of direct VPC peering introduces a $0.02/GB processing charge, even if the traffic stays within the same region [7]. These processing fees stack on top of standard egress rates, meaning the actual cost per GB can be much higher than it appears at first glance.
Reading Egress Fees in Vendor Pricing Tables
Cloud provider pricing tables can be tricky to navigate. Most rates are listed in USD, so UK businesses need to account for the GBP/USD exchange rate. For instance, Azure uses London closing spot rates from the previous month to convert prices [4]. This means that even if your data usage stays steady, fluctuations in exchange rates can increase your bill.
A few key points to keep in mind when reviewing these tables:
- Tiered pricing: Rates per GB decrease as monthly usage increases, but the top-tier rate applies only to the initial usage tier.
- Decimal GB vs GiB: Billing is often calculated in decimal GB, while systems report usage in GiB. This creates a roughly 7% difference in reported figures [9].
- Per direction costs: Ensure you check if rates apply for both directions. For example, cross-AZ charges are billed for data leaving Zone A and entering Zone B, effectively doubling the cost of a round trip.
Understanding these nuances is essential for managing cloud costs effectively, especially for businesses in the UK looking to optimise their spending.
Managed Networking and CDN Pricing Models
Pricing for Load Balancers, NAT Gateways, and VPNs
An AWS Application Load Balancer (ALB) costs $0.0225 per hour, translating to roughly £16.50 per month when idle. On top of this, there are data processing fees. To manage costs, you can use a single ALB with path-based or host-based routing rules to handle multiple services, which helps reduce expenses [2].
For NAT Gateways, there's a $0.045 per GB processing fee. If a single NAT Gateway processes 5 TB of data monthly, the cost comes to about $257 [2]. However, routing internal traffic through free VPC Gateway Endpoints instead of using a NAT Gateway eliminates these processing fees entirely.
VPNs are charged hourly for each active tunnel at around $0.05 per hour, plus standard egress rates. For organisations in the UK transferring over 10 TB of data monthly, a dedicated connection like AWS Direct Connect may be a smarter choice. At approximately $0.02 per GB for egress, it’s far cheaper than routing all traffic through a VPN, which costs about $0.09 per GB [6].
When combined, these costs highlight how crucial it is to design your network setup strategically to avoid unnecessary expenses.
CDN Pricing: Data Transfer, Requests, and Add-Ons
Content Delivery Networks (CDNs) add another layer of complexity to networking costs, with expenses generally split into three categories: data transfer out, request fees, and optional add-ons. For UK-based businesses, most traffic falls under Zone 1 pricing, covering regions like Europe, North America, and the Middle East.
Egress rates are tiered. For example:
- Azure CDN Standard charges $0.081 per GB for the first 10 TB of traffic in Zone 1, dropping to $0.075 per GB for the next 40 TB [15].
- Google Cloud CDN charges $0.08 per GiB for the first 10 TiB, with rates falling to $0.02 per GiB for usage beyond 1,000 TiB [16].
Request fees also add to the bill. Google Cloud charges $0.0075 per 10,000 HTTP/HTTPS requests [16], while Azure Front Door Standard applies the same rate for requests within Europe [18].
Optional add-ons like Web Application Firewalls (WAF), custom routing rules, and real-time log delivery can further increase costs [15]. AWS CloudFront simplifies budgeting with flat-rate plans. For instance, the Pro
tier costs $15 per month and includes 50 TB of data transfer [17].
One cost-saving measure is that data transfer from S3 to CloudFront is free within the same AWS account. Additionally, CloudFront’s egress rates are often cheaper than direct S3-to-internet transfers at scale [6]. By using a CDN, you can improve performance while potentially reducing overall data transfer costs.
These various charges can quickly add up, making it essential to monitor every cost component to manage your cloud budget effectively.
How Managed Networking Services Add to Overall Costs
The real challenge with managed networking services isn’t any single fee - it’s how all the charges combine. As CloudToolStack explains:
Cloud networking costs are the silent budget killer. Unlike compute and storage... networking charges are scattered across dozens of billing dimensions that interact in non-obvious ways.[2]
For example, a single request might incur multiple fees: hourly and data processing charges for a load balancer, $0.045 per GB for NAT Gateway processing, cross-AZ transfer fees at $0.01 per GB each way, and standard internet egress. These costs often don’t appear as a single consolidated charge, making them harder to track.
However, there are ways to reduce networking expenses. Measures like enabling zonal affinity on Network Load Balancers, deploying VPC Endpoints, and consolidating load balancers can cut costs by 20% to 40% [2].
For UK businesses, it’s worth noting that most charges are listed in USD. With typical bank conversion fees of about 1.5%, adding a 5–8% foreign exchange buffer to GBP budgets can help account for currency fluctuations [3].
Regional Pricing Differences and What They Mean for UK Businesses
How Pricing Varies by Region
The location of your workload has a direct impact on costs. AWS explains it this way:
Resource pricing varies by region due to differences in local expenses such as land, fibre, electricity, and taxes.[21]
One of the biggest cost differences comes from egress fees. In the UK, standard internet egress costs around $0.09/GB on AWS and $0.087/GB on Azure. In contrast, European providers like Scaleway charge as little as €0.01/GB, while OVHcloud and Hetzner include egress as part of their standard offerings. For a workload that sends out 5 TB of data monthly, this pricing gap could mean spending €4,600/year on AWS versus nothing on OVHcloud [19].
Costs rise significantly when data crosses continents. Azure's Global VNET Peering rates highlight these differences:
| Destination Zone | Example Route | Rate (per GB, USD) |
|---|---|---|
| Zone 1 (US, Europe, UK) | UK → US East | $0.035 |
| Zone 2 (Asia, Australia, India) | UK → Singapore | $0.09 |
| Zone 3 (Brazil, South Africa, UAE) | UK → São Paulo | $0.16 |
| (Source: Microsoft Azure [4]. Rates are in USD.) |
As Michał Puchała from Cirran points out: Egress is the biggest single line item separating hyperscalers from European providers.
[19]
These pricing variations make it clear why location strategy matters, especially as we explore placement decisions next.
Choosing UK and EU Regions to Manage Costs
Understanding regional pricing differences is essential for making informed decisions about where to place workloads. For UK businesses, regions like AWS eu-west-2 (London) or Azure UK South often meet both latency and data residency needs. Azure UK South can pair with UK West (Cardiff) for disaster recovery while keeping data within UK borders. On the other hand, AWS often pairs its London region with Dublin, which could involve EU data transfers unless restricted with Service Control Policies [3].
Data residency isn't just about compliance; it also impacts architecture and costs. For example, the AWS European Sovereign Cloud, set to launch in 2026, offers a physically and logically separate infrastructure. However, this separation may introduce 5–40ms of additional latency and change egress patterns compared to standard AWS regions [20].
For non-production workloads like development or testing, hosting in regions such as US East (N. Virginia) can reduce compute costs, provided regulatory requirements allow it. The key is to categorise workloads carefully and choose regions based on a balance of compliance and cost efficiency.
Cross-Region Traffic: Cost and Latency Trade-Offs
Regional pricing differences are only part of the equation; cross-region traffic adds another layer of cost and performance considerations. Transferring data between regions incurs additional fees, which can quickly grow in distributed systems. Here's how typical costs and latency break down for UK-based workloads:
| Transfer Type | Estimated Cost (GBP/GB) | Latency |
|---|---|---|
| Intra-region (same zone) | Free (internal IP) | <1ms |
| Cross-AZ (same region) | ~£0.008–£0.01 | <2ms |
| Inter-region (same continent) | ~£0.016 | 20–40ms |
| Inter-continental | ~£0.064–£0.12 | 100ms+ |
UK-Specific Cost and Latency for Cross-Region Data Transfers
For businesses with users in Asia-Pacific, Azure charges $0.05–$0.08/GB for cross-continent transfers [7]. Google Cloud Platform (GCP) offers a Standard
network tier, which routes traffic over the public internet at $0.085/GB, compared to $0.12/GB on its Premium
tier. The Standard tier is ideal for workloads where cost outweighs the need for top-tier routing performance [7].
As seen with egress fees, colocating compute and storage in the same region can significantly reduce costs. For instance, if a processing VM in Europe accesses a storage bucket in the US, you pay inter-region egress for every read. Moving the VM to the same region as the bucket eliminates that fee entirely [12]. For global audiences, using a CDN can cut origin egress costs by 50–70% by delivering cached content from edge locations closer to users [7]. This approach is often a more economical alternative to duplicating infrastructure across multiple regions.
Analysing and Governing Cloud Networking Costs
How to Break Down Your Cloud Networking Bill
Cloud bills often group networking charges under vague headings like Compute
or Other
, making it tricky to pinpoint where your money is going. The best way to uncover these hidden costs is to export raw billing data instead of relying on summarised dashboards. Raw billing exports provide a detailed breakdown of charges such as internet egress, NAT Gateway processing, cross-AZ transfers, and CDN origin egress - categories that are often obscured in high-level summaries [5][7].
To make sense of your bill, divide it into specific traffic boundaries. Each boundary has its own rate and ways to optimise costs:
| Cost Driver | Typical Metric | UK/London Rate (Approx.) | Optimisation Strategy |
|---|---|---|---|
| Internet Egress | £ per GB | £0.07–£0.09 | Use a CDN (e.g., CloudFront) |
| NAT Processing | £ per GB | £0.035 | Switch to VPC Gateway Endpoints |
| Cross-AZ Traffic | £ per GB | £0.008 | Implement topology-aware routing |
| Public IPv4 | £ per hour | £0.004 | Opt for IPv6 or private IPs |
| Load Balancer | £ per hour | £0.018 | Consolidate using path-based routing |
For instance, the NAT Gateway charges $0.045 per GB for processing, on top of standard egress fees [2][7]. By using VPC Gateway Endpoints for services like S3 and DynamoDB, you can eliminate these processing fees entirely [2]. Additionally, organisations in the UK should account for a roughly 1.5% currency conversion fee when dealing with USD-based bills [3].
Networking costs are not usually the largest line item in a cloud bill. They are often the most addressable one, because the root cause is almost always configuration, not scale.- Muskan [13]
Armed with detailed billing data, you can forecast costs more accurately and take steps to manage them effectively.
Modelling Cost Scenarios Before Making Changes
Before implementing architectural changes - such as introducing a CDN, consolidating regions, or shifting to private connectivity - it's a good idea to model the potential cost impact. The trick is to avoid treating networking as a single lump sum. Break it down into separate components: internet egress, cross-zone traffic, cross-region transfers, CDN origin egress, and NAT/private endpoints [5].
For example, if you're considering replacing a NAT Gateway with AWS PrivateLink, compare their costs. PrivateLink charges $0.01/hour per AZ plus $0.01/GB, while a NAT Gateway costs $0.045/hour and $0.045/GB processed. For low data volumes, PrivateLink often becomes the cheaper option quickly [11]. Similarly, for simpler setups with two to five VPCs, VPC Peering (around $10 for 500 GB/month) is far less expensive than Transit Gateway (approximately $83 for the same volume, including attachment fees) [11].
Also, consider how routing changes might affect costs. For instance, retries or cache misses can increase expenses. Using data compression methods like gzip or Brotli can reduce data transfer volumes by 60–80%, directly lowering egress charges [22][7].
By modelling these scenarios, you can incorporate cost considerations into your planning and avoid unpleasant surprises.
Building Cost Awareness into DevOps Practices
Once you've modelled potential costs, it's time to integrate cost awareness into your DevOps workflows to keep expenses under control. Networking costs rarely skyrocket overnight; instead, they tend to creep up due to small, repeated charges that can go unnoticed. The best way to avoid this is to tag networking resources and enable cost allocation tags for data transfer items. This allows teams to attribute spending to specific services or environments [2].
Networking charges rarely look dramatic on a whiteboard, but they pile up through NAT Gateway data processing, cross-AZ traffic, unnecessary interface endpoints, centralised inspection hairpinning, and public IPv4 usage.- Austin Davies [23]
For Kubernetes environments, enabling topology-aware routing with the annotation service.kubernetes.io/topology-mode: auto ensures traffic stays within the same Availability Zone. This can cut inter-AZ fees by 60–80% [13][25]. Additionally, setting up automated budget alerts for networking costs helps teams catch anomalies early.
A notable example is KnowBe4, which reduced its AWS costs by 27% in 2026, saving over $1.2 million. This was achieved through application-aware traffic optimisation, including egress shaping, without compromising customer-facing latency [8].
For UK organisations managing complex cloud environments, consulting specialists like Hokstad Consulting can help streamline the process. They focus on reducing costs by 30–50% through detailed billing audits, architecture reviews, and embedding cost-conscious practices into DevOps workflows.
Conclusion: Key Takeaways for Cloud Networking Cost Control
Managing cloud networking costs isn’t about finding a single solution - it’s about addressing multiple factors. This guide has highlighted key areas like internet egress, cross-zone traffic, cross-region transfers, CDN origin egress, and NAT processing. Each of these comes with its own pricing structure and opportunities for cost reduction.
Some changes can be implemented surprisingly fast. For example, enabling VPC Gateway Endpoints for services like S3 and DynamoDB can eliminate NAT Gateway fees in as little as 30 minutes. Similarly, turning on topology-aware routing in Kubernetes can cut down on inter-AZ charges, while using gzip or zstd compression for API responses can significantly reduce data transfer volumes.
A cost-optimized network answer... is almost always the answer that removes a charged hop from the packet path, not the one that adds a feature.- ExamLab [24]
For UK businesses, there are a few additional considerations. Since most major cloud providers bill in USD, it’s wise to include a 5–8% foreign exchange buffer when planning GBP budgets [3]. Networking fees can often account for 18% of total cloud spending [26], and this figure can climb even higher in data-heavy setups.
FAQs
What counts as billable egress in my cloud setup?
In cloud networking, billable egress refers to the costs incurred when data moves out of a cloud provider’s network. These charges apply to several scenarios, including:
- Internet egress: When data is sent to users or services outside the cloud network.
- Cross-zone traffic: Transfers between different availability zones within the same region.
- Cross-region replication: Data movement between regions, often for disaster recovery or synchronisation purposes.
- Origin-to-CDN: Traffic flowing from your origin server to a content delivery network (CDN).
- NAT/private endpoints: Charges for data routed through NAT gateways or private endpoints.
These costs can add up quickly, so understanding where and how data moves is essential for managing expenses.
How can I quickly reduce cross-AZ traffic costs?
To cut down on cross-Availability Zone (AZ) traffic costs, start by using VPC flow logs and load balancer metrics to pinpoint internal east-west traffic. This type of traffic often stems from microservice communication or database replication.
To address this, you can:
- Place frequently communicating (
chatty
) services within the same zone. - Enable zonal affinity for your load balancers.
- Turn off cross-zone load balancing, but ensure targets are evenly distributed across zones.
For expert guidance, Hokstad Consulting offers support in identifying and reducing these often-overlooked expenses.
When does private connectivity become cheaper than internet egress?
Private connectivity options like AWS Interface Endpoints can offer cost savings compared to standard internet egress, provided the lower per-GB fees outweigh the fixed hourly charges. For instance, while NAT Gateways typically charge about £0.035 per GB, Interface Endpoints can slash per-GB costs by as much as 78%. However, because these endpoints include both hourly and per-GB charges, it's crucial to model traffic volumes carefully to determine the break-even point.