
If I had to sum it up in one line: cloud-native CI/CD for microservices works best when each service ships on its own path, deployments stay in Git, rollout risk stays small, and spend is tracked in £ per service per environment.
I’d set the bar early: aim for under 1 hour from commit to production, a 0–15% change failure rate, and 90% of failed deployments fixed or rolled back within 30 minutes. To get there, I’d keep the setup simple: one CI pipeline per service, image tags tied to the Git SHA, GitOps for deployment, canary or blue-green only where they fit, and monthly cost checks before CI bills drift.
Here’s the short version:
- Give each microservice its own pipeline so one code change doesn’t trigger the whole stack.
- Run tests and security checks before publishing images.
- Use Git as the source of truth for dev, staging, and production deployments.
- Pick rollout methods by service risk, not by trend.
- Scale runners on demand and fix caching before buying more build capacity.
- Track spend in pounds by service and environment from day one.
- Watch DORA metrics per service, not as one estate-wide number.
- Block bad releases with policy such as no
:latest, no unsigned images, and no unapproved registries.
A short side-by-side view helps:
| Area | What I’d do |
|---|---|
| CI setup | One pipeline per service |
| Image tagging | Use Git SHA, not latest
|
| Deployment model | GitOps with Argo CD or Flux |
| Release method | Canary, blue-green, or feature flags based on service risk |
| Runner scaling | Ephemeral Kubernetes runners with autoscaling |
| Cost control | Track £ per service per environment |
| Health checks | DORA metrics, build time, app latency, errors |
| Policy | Enforce signed images and approved registries |
My take: this is less about tools and more about control. If I keep delivery paths separate, rollout methods small, and cost visible from the start, microservices stay easier to ship and easier to run.
Implementing Cloud Native CI/CD by Nikhil Barthwal #AgileIndia 2025
Need help optimizing your cloud costs?
Get expert advice on how to reduce your cloud expenses without sacrificing performance.
Step 1: Design CI workflows around independent microservices
Set up one CI pipeline for each service. That means every service gets its own workflow and its own trigger. So if someone changes the payments service, the pipeline should only build and test the payments service - not the rest of the stack.
This keeps feedback fast. It also means your CI spend stays tied to the service that changed, which makes costs much easier to track.
Once that operating model is in place, the next move is to standardise one CI path per service so every change goes through the same checks.
Build a standard CI pipeline for each service
Each service pipeline should follow the same stage order, even when the commands change by language or runtime. A sensible flow looks like this:
- Code checkout
- Dependency installation
- Unit tests
- Component and contract tests
- Static analysis
- Container image build
- Vulnerability scan
- Push to a registry
That order gives teams a steady path from code change to shippable image.
Image tagging needs extra care. Never use latest as a production tag. Instead, tag every image with the Git commit SHA. Add a semantic version only when you need release numbering.
This same stage order then becomes the reusable pattern for every service pipeline.
Use reusable templates across GitHub Actions, Azure Pipelines or Jenkins
Copying pipeline logic from one service to another sounds harmless at first, but it creates more upkeep over time. A better approach is to use reusable workflows, templates, or shared libraries to keep build, test, scan, and publish steps in one place.
Then pass in service-level variables such as the language, image name, and registry path. Same guardrails, less duplication.
Add security gates early in the build stage
Run SAST, dependency scanning, and container scanning before the image is published. If a scan finds a critical issue, fail the build. For lower-severity issues, log them so the team can fix them without blocking every change.
Once each service has a locked-down CI path, the next step is to control deployment through Git and progressive delivery.
Step 2: Set up cloud-native CD with GitOps and progressive delivery
::: @figure 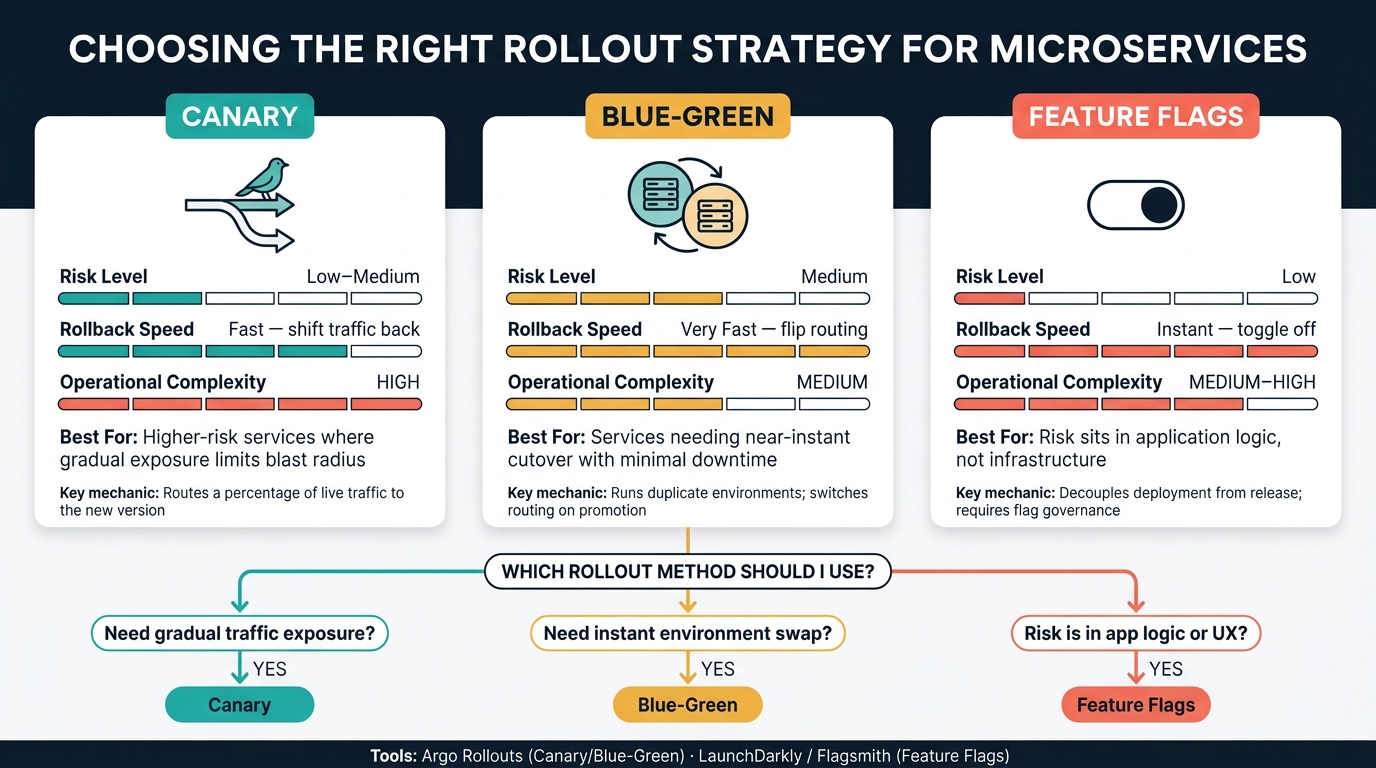 {Cloud-Native CI/CD for Microservices: Rollout Strategies Compared}
:::
{Cloud-Native CI/CD for Microservices: Rollout Strategies Compared}
:::
Once CI is producing verified images for each service, shift deployment control into Git. In this setup, GitOps becomes the default deployment model: Git defines the desired state, and a controller keeps each cluster aligned with it.
Use Git as the source of truth for deployments
CI builds and pushes the image, then updates the manifest or Helm values in Git. Argo CD or Flux picks up that change and reconciles the cluster to match the commit. Promotion, approval, and target environment all stay in Git through pull requests and protected branches.
That gives you a clear release trail in the commit history, including the author, timestamp, and exact diff. If someone asks, “What changed, and when?”, the answer is right there.
Use separate Git paths for dev, staging, and prod, then promote changes by merging pull requests. Rollback is just as clean: revert the commit, and the controller moves the cluster back to the previous state on its own.
At that point, release risk is handled less by pipeline logic and more by the rollout method you choose.
Choose canary, blue-green or feature-flag rollouts
Not every service needs the same release model. The right fit depends on the risk tied to that service, how fast you need to recover from a bad release, and what your team can actually run day to day.
| Strategy | Risk Level | Rollback Speed | Operational Complexity |
|---|---|---|---|
| Canary | Low–medium | Fast (shift traffic back) | High - needs traffic splitting and version-aware monitoring |
| Blue-green | Medium | Very fast (flip routing) | Medium - duplicate environments, synchronised data |
| Feature flags | Low | Instant (toggle off) | Medium–high - flag governance and code paths |
A simple rule of thumb works well here:
- Use canary for higher-risk services
- Use blue-green when you need near-instant cutover
- Use feature flags when the risk sits in application logic
Tools such as Argo Rollouts implement canary and blue-green strategies natively in Kubernetes[2][3]. That lets teams define traffic weights and automated promotion steps straight in Git-managed manifests.
Use service mesh controls only where traffic shaping is needed
A service mesh such as Istio or Linkerd helps when you need percentage-based traffic splits between service versions, fine-grained routing rules, or steady mutual TLS across a large estate.
But there’s a trade-off. A mesh adds a control plane, sidecar proxies on every pod, and extra day-to-day work. For smaller teams, or for services with simple release patterns, ingress-controller-based routing or application-level feature flags are often enough.
So don’t add a mesh just because it sounds like the “proper” cloud-native move. Add it when traffic shaping or mTLS justifies the extra control-plane cost.
Those routing and runtime choices shape how far the pipeline can scale without burning cloud spend.
Step 3: Scale the pipeline and control cloud costs
Once delivery runs through GitOps, the next pinch point is usually runner capacity and cost. As more services come online, teams need to keep queue times down without letting cloud spend drift upward.
Scale runners, caches and deployment logic without over-provisioning
Use ephemeral Kubernetes runners that start on demand and shut down after each job. Run them as ephemeral Kubernetes workloads, not as persistent servers.[4][7][9]
Autoscaling should react to queue length and job priority, not fixed node counts. A simple way to manage this is to set an SLO, such as 95% of builds starting within 2 minutes, then tune autoscaling to hit that mark at the lowest cost. Spot or pre-emptible instances make sense for non-critical workloads, while production release pipelines should stay on standard instances.[4]
Before adding more runners, look at caching. Shared dependency caches for Maven, npm or pip, paired with Docker layer caching in a central registry, can cut build times by 30–60%. That has a direct effect on per-minute CI charges.[4][5][6] If cache hit rates are low, fix cache keys or step ordering first. There's no point paying for more parallelism if the pipeline is doing the same work again and again.
For deployment logic, shared Helm charts or Kustomize overlays help keep packaging aligned across services. Each microservice only needs a small overlay for its own settings, while common items such as resource limits, probes and security contexts live in a centrally maintained chart. That cuts duplication and reduces configuration drift.[9] It also makes cost attribution easier, because deployment patterns stay consistent.
Track CI/CD cost per service and environment
Tag every pipeline job, Kubernetes namespace and cloud resource with service_name and environment identifiers. Then roll up spend per microservice in your cloud provider's cost explorer or FinOps dashboard. That gives you monthly spend per service and environment in £.[4][6]
Artefact retention is often one of the easiest wins. Setting non-critical build outputs to 14–30 days, instead of leaving long default retention in place, is often a five-minute config change that can make a clear dent in storage bills.[5] GitHub Actions also charges separately for artefact and cache storage, so costs can stack up fast across many services and environments.[8][10]
It also helps to review cost per run next to defect yield. If a long integration stage uses oversized instances but rarely finds issues that unit or contract tests miss, it deserves a closer look. Swapping oversized machine types for smaller ones, where success rates stay the same, is a simple saving. Revisit this at least monthly, and check weekly when new services or test suites are added.[4][6]
Where Hokstad Consulting can help
Hokstad Consulting helps teams tag spend by service and environment, tune autoscaling and caching, and cut CI/CD waste.
With scaling under control, the next step is to monitor release health, security and compliance.
Step 4: Monitor, secure and improve the pipeline over time
Monitor delivery health across builds and releases
After you've dealt with runner scale and cost controls, the next job is simple: make delivery health visible in production.
The four DORA metrics give you the clearest view here: deployment frequency, lead time for changes, change failure rate, and failed deployment recovery time.[11][1] Track them per service and per environment, not just as one rolled-up number. Otherwise, one shaky microservice can hide a bigger pattern across the estate.
Use one Grafana dashboard for each service. Include build duration, deployment frequency, change failure rate, and app latency, errors, and CPU saturation scraped by Prometheus.[15] Every incident should link back to the exact commit, image tag, and deployment timestamp. Then benchmark each service against those targets.
Those signals should feed straight into your release policy and compliance checks. If a service slips, you want to see it fast and act on it fast.
Review security and compliance at every release stage
Once delivery health is in view, apply the same discipline at release time.
Run Trivy or Grype in CI. Fail builds on critical findings. Sign images with Cosign. Ban hard-coded secrets and use audited secret storage.
Use Kyverno or OPA/Gatekeeper to block unsigned images, :latest tags, and unapproved registries before workloads reach the cluster.[12][13][14][16] Set production namespaces to enforce mode, not audit mode.
Security thresholds need regular review, not a one-off check at setup. A threshold that felt fine in staging can be far too loose in production once services start handling more sensitive data or higher traffic.
Conclusion: A practical rollout path for UK microservices teams
Roll this out in order: targets, per-service CI, GitOps CD, progressive delivery, then monitoring and policy.
For UK microservices teams, success looks like faster releases, lower failure rates, quicker recovery, and cloud spend tracked and controlled in £ per service, per environment, every month.
FAQs
When should a team use GitOps?
A team should use GitOps when it needs a reliable, secure and transparent way to manage Kubernetes deployments, with Git as the single source of truth for infrastructure and application configuration.
It works especially well when the goal is to automate state reconciliation and stop configuration drift before it turns into a headache. It also helps with auditability and compliance, since every change lives in version control and can be tracked, reviewed and rolled back.
GitOps also makes day-to-day deployment work easier across multi-cluster or multi-environment setups. And if the team uses release methods like blue-green or canary deployments, GitOps gives them a clear and controlled way to manage those changes.
Do all microservices need canary releases?
No. Canary releases help when you want a controlled rollout, close monitoring, and a clear rollback path if something goes wrong. But they’re not something every microservice needs.
In Kubernetes CI/CD workflows, a canary release sends a small portion of traffic to a new version before rolling it out more broadly. That gives teams a chance to spot issues early without putting all users on the new build at once.
That said, other rollout methods can make more sense. Blue-green deployments, for example, may be a better fit based on risk level, system needs, and the resources you have available.
How do you measure CI/CD cost per service?
Measure CI/CD cost per service by combining granular resource tracking with observability. That gives you a clearer view of where money is going and which parts of your pipeline are driving spend.
Use resource tagging to group cloud spend by project, service, or team. Once those tags are in place, you can map infrastructure costs back to specific microservices instead of treating cloud spend as one big shared bill.
Tools like Kubecost can split this down by namespace, service, or pod. Prometheus and Grafana can then track CPU and memory usage, build durations, and queue times, so you’re not just seeing cost in isolation. You’re seeing what’s causing it.
If you want to set this up without a lot of trial and error, Hokstad Consulting can help implement automated cost tracking for clearer visibility of cloud spend.