A cloud move should go ahead only if the numbers work over 36 to 60 months and the risks are clear. If I were judging it, I’d look at four things first: TCO, ROI, net benefit, and payback period.
Here’s the short version:
- I’d set a clear scope first, so I know exactly which apps, data, and services I’m judging
- I’d build a current cost baseline in £, including hardware, licences, support, data centre spend, and staff time
- I’d estimate cloud run costs plus one-off migration costs, such as tooling, testing, training, and dual running
- I’d compare best-case, expected, and worst-case numbers, not just one forecast
- I’d turn non-cash gains, such as less downtime or faster releases, into £ values where possible
- I’d only move ahead if the case holds up beyond year one, because costs often rise at the start and savings may take 12 to 24 months to show
A simple way to think about it: compare what you spend now with what you’d spend after the move, add the migration bill, then ask, “When do we get the money back, and is the risk worth it?”
This article walks through that process in three steps: set the baseline, model cloud and migration costs, then measure gains and make the decision.
::: @figure 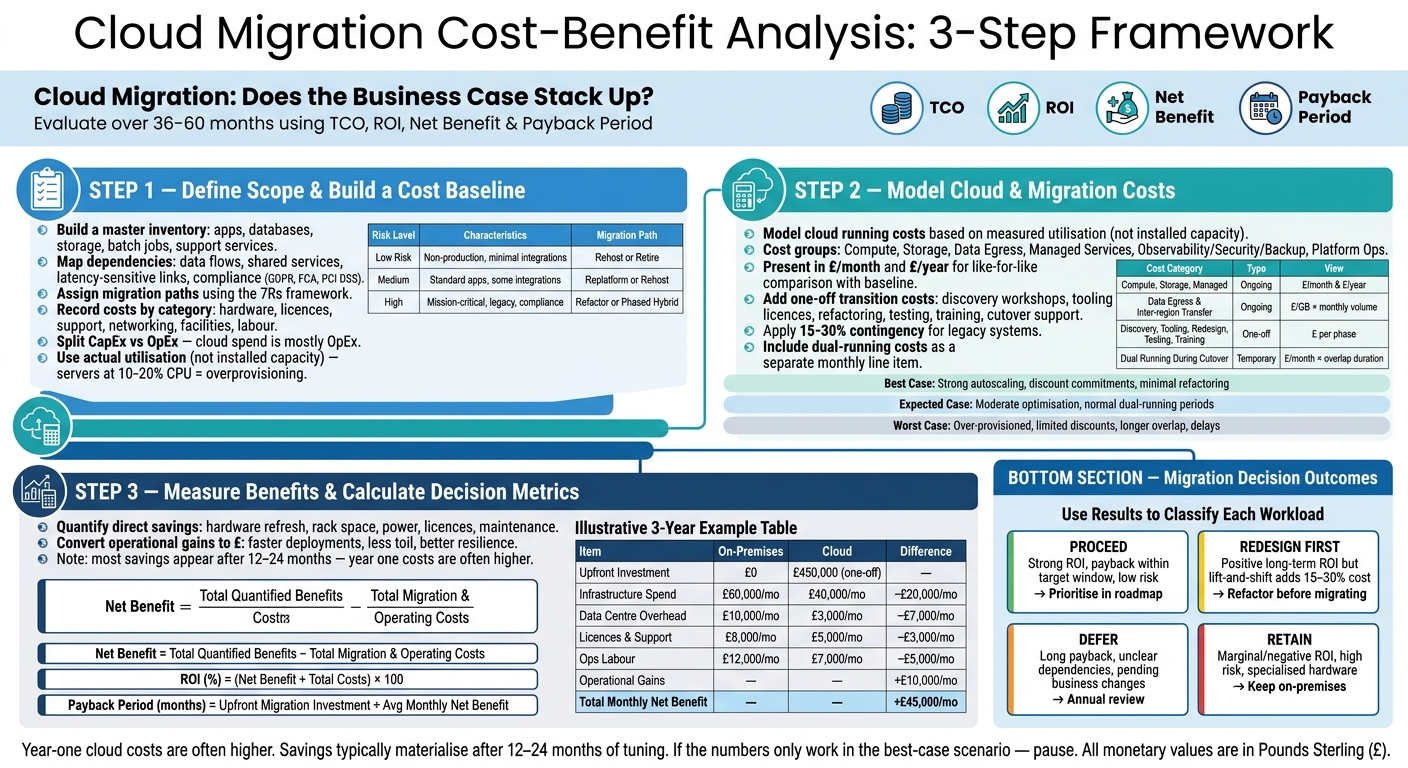 {Cloud Migration Cost-Benefit Analysis: 3-Step Framework}
:::
{Cloud Migration Cost-Benefit Analysis: 3-Step Framework}
:::
On-Prem to Cloud Migration Costs and Savings (Is it Worth It?)
2. Step 1: Define migration scope and establish a current baseline
A poor baseline makes the business case shaky. This is the starting point that gives your TCO and payback figures weight.
List workloads, dependencies, and migration paths
Begin with the workloads most likely to shape cost and risk. Build a master inventory that includes every application, database, storage volume, batch job, and support service in scope. For each item, record the business owner, technical owner, environment (production, test, development), technology stack, and current hosting location.
Then sanity-check that list against your CMDB, monitoring tools, and invoice and contract records. Why? Because legacy systems and shadow IT often slip through the cracks when teams rely on manual inventories alone.
Once the inventory is done, map dependencies. Note which systems exchange data, which share parts such as authentication services or databases, and which depend on third-party APIs or payment gateways. Mark any latency-sensitive links, data residency duties, GDPR requirements, or rules such as FCA or PCI DSS obligations. These points affect both migration effort and day-to-day cloud spend.
Next, assign a migration path to each workload using the 7Rs framework: rehost, relocate, replatform, refactor, repurchase, retire, or retain.
| Risk Level | Characteristics | Likely Migration Path |
|---|---|---|
| Low risk | Non-production, minimal integrations | Rehost or retire |
| Medium criticality | Standard three-tier apps, some integrations | Replatform or rehost |
| High criticality | Mission-critical, legacy systems, strict compliance needs | Refactor or phased hybrid approach |
Starting with lower-risk workloads helps the team learn as they go and makes cost models less guesswork-heavy before moving onto business-critical systems. All of this feeds straight into the TCO, ROI, and payback calculations later on.
Record current-state costs in clear categories
Gather every cost tied to your current infrastructure and sort it into plain categories: hardware, software licences, support and maintenance contracts, networking, facilities such as rack space, power and cooling, backup and disaster recovery, and internal labour for infrastructure operations, database administration, and application support.
Use monthly and annual views so the numbers line up with how cloud costs will be modelled later. Split capital expenditure (CapEx) from operational expenditure (OpEx). CapEx covers items like hardware bought and depreciated over time. OpEx covers things like support contracts and staffing. Since cloud spend is mostly OpEx, the comparison needs to be like-for-like.
Also record hardware refresh cycles, remaining asset life, and any locked-in contracts with termination penalties. Those details can shift migration timing and change the payback period more than people expect.
Lastly, record actual utilisation, not just installed capacity. A server running at 10–20% average CPU utilisation is a classic sign of overprovisioning. Cloud cost models should be based on right-sized resources, not the full on-premises footprint. Otherwise, you end up moving old waste into a new platform.
These numbers become the baseline for the cloud cost model in the next step.
3. Step 2: Estimate future cloud costs and migration effort
Step 1 gave you the baseline. Step 2 turns that into two things: what the cloud is likely to cost and how much work it will take to get there.
Use the Step 1 baseline to estimate what you’ll pay in the cloud, along with the effort and spend tied to migration.
Model cloud running costs and transition costs
Start with cloud running costs. Use measured utilisation and the service mix you expect to run, not the amount of installed capacity sitting on-premises. That means looking at average and peak CPU, storage usage, and egress volume, then mapping those numbers to cloud services.
Break the model into clear cost groups:
- Compute: virtual machines, containers, or serverless
- Storage: block, object, and file, including snapshot charges
- Data egress and inter-region transfer
- Managed services: such as databases and message queues
- Observability, security, and backup
- Platform operations: including CI/CD and infrastructure-as-code tooling
Present the figures in £ per month and £ per year so finance teams can compare them side by side with the on-premises baseline.
Model data egress from actual traffic patterns. It can swing the business case more than teams expect.
Then add the one-off transition costs. These include discovery and assessment workshops, migration tooling licences, redesign and refactoring work, functional and performance testing, staff training, and cutover support. For labour-heavy items, estimate effort in person-days. Where legacy systems are involved, apply a 15–30% contingency where it makes sense. Also include dual-running costs for the overlap period when on-premises and cloud are live at the same time. Show that as a separate monthly line item in the migration timeline.
| Cost Category | Type | Example View |
|---|---|---|
| Compute, storage, managed services | Ongoing | £ per month / £ per year |
| Data egress and inter-region transfer | Ongoing | £ per GB × monthly volume |
| Observability, security, backup | Ongoing | £ per month / £ per year |
| Discovery, tooling, redesign, testing, training | One-off | £ per phase |
| Dual running during cutover | Temporary | £ per month × overlap duration |
Build best-case, expected, and worst-case scenarios
Next, build three scenarios. Vary the assumptions that carry the most risk: utilisation efficiency, egress volumes, licensing constraints, support needs during stabilisation, and refactoring complexity.
The best-case scenario assumes strong autoscaling, discount commitments, and minimal refactoring. The expected case sticks closer to current utilisation patterns, with moderate optimisation and dual-running periods based on normal project experience. The worst case assumes over-provisioned instances, limited discounts, more engineering effort, and a longer overlap period because of delays or compliance testing.
After that, run a sensitivity analysis on the variables most likely to move the numbers. For example, increase monthly egress by 25%, or extend dual running from three to six months, then measure the effect on total annual cost and payback period. This shows, very fast, which assumptions create the biggest financial risk.
Set a clear decision rule as well. For instance, proceed only if expected annual cloud cost stays below £X and payback lands within Y months.
These scenarios feed the TCO, ROI, net benefit and payback calculations in Step 3.
4. Step 3: Measure benefits and calculate decision metrics
Once you've modelled the costs, the next job is to show what those costs actually buy. Use the Step 2 cost model to put benefits into £ and compare each option on a like-for-like basis.
Measure direct savings and operational gains
Direct savings are the costs you avoid or cut. That might mean hardware refreshes, rack space, power, licences, and maintenance. For each line item, measure the benefit against the current-state cost it changes. In practice, that means recording the baseline cost, the expected post-migration cost, and the gap between them in £ per year.
Operational gains matter as well. Faster deployments, less toil, and better resilience can all be turned into £ figures by using labour rates and revenue at risk. That helps keep technical gains visible in the financial model instead of letting them disappear into vague claims. If a gain can't be priced with much confidence, note it as a qualitative benefit and keep the estimate cautious.
There’s also a timing issue here. Lift-and-shift can push costs up before optimisation starts to pay off, and most savings tend to show up after 12–24 months. Make that clear when you present the numbers, so no one mistakes year one for the steady state.
Calculate TCO, ROI, net benefit, and payback period
Now turn the benefit model into the same financial measures used in the baseline.
Net benefit = total quantified benefits over the period − total migration and operating costs.
ROI (%) = (net benefit ÷ total costs) × 100.
Payback period (months) = total upfront migration investment ÷ average monthly net benefit after stabilisation.
Use the table below to give stakeholders one clear view. These figures are illustrative and based on a three-year example. [2]
| Item | Current state (on-prem) | Future state (cloud) | Difference |
|---|---|---|---|
| Upfront investment | £0 (baseline) | £450,000 (one-off) | N/A |
| Ongoing infrastructure spend | £60,000/month | £40,000/month | −£20,000/month |
| Data centre overhead | £10,000/month | £3,000/month | −£7,000/month |
| Licences and support contracts | £8,000/month | £5,000/month | −£3,000/month |
| Ops labour (maintenance) | £12,000/month | £7,000/month | −£5,000/month |
| Operational gains (est.) | - | £10,000/month equiv. | +£10,000/month |
| Total monthly net benefit | - | - | +£45,000/month |
Add a short explanation under the table that spells out the main assumptions, especially where operational improvements have been converted into £ terms. It also helps to show a best case, expected case, and worst case, then carry that range into the final migration decision.
5. Conclusion: Turn the analysis into a migration decision
Use the results to choose the right move for each workload.
Year-one cloud costs are often higher. Migration overheads and parallel running tend to push spend up at the start, and cost savings usually show up after 12–24 months of tuning. If the numbers only work in the best-case scenario, pause.
Use the results to decide what to do next
Use the ROI, payback, and risk findings from Step 3 to sort each workload. Timing risk can change the picture fast, which is why each workload needs its own decision rule.
| Classification | Typical criteria | Action |
|---|---|---|
| Proceed | Strong ROI, payback within the target window, low dependency and change risk | Prioritise in the migration roadmap |
| Redesign first | Positive long-term ROI, but lift-and-shift would push costs up by 15–30% [1] | Refactor or replatform before migrating |
| Defer | Long payback, unclear dependencies, or major business changes still pending | Schedule a review, often once a year |
| Retain | Marginal or negative ROI, high risk that can't be reduced, or dependency on specialised hardware | Keep on-premises with a lifecycle plan |
Then use that classification to shape the migration roadmap.
FAQs
How long should a cloud migration business case cover?
Base your forecasting and planning on 12 to 18 months of past billing data. That gives you a much clearer view of seasonal shifts, growth trends, and one-off events that might otherwise throw off your financial projections.
Your business case shouldn't be static, either. It needs to stay current as your organisation's cloud usage changes. Use scenario-based models to account for future events like product launches or architecture changes.
Which cloud costs are easiest to underestimate?
The costs most teams underestimate are recurring running costs.
People usually account for compute and storage. But data egress fees often slip through the cracks, and they can climb fast as usage grows.
It’s not just infrastructure, either. Day-to-day needs like monitoring, security patching, technical support, and cleaning up untagged or idle resources are easy to miss when you first look at the numbers.
Then there are the costs that show up after migration. Auto-scaling can increase spend in ways teams didn’t plan for, and resource governance can bring extra overhead too.
When does cloud migration start to pay back?
Cloud migration often starts to pay off by cutting total costs by around 20% over three years.
That said, those savings don’t just happen on their own. They depend on careful planning and a full Total Cost of Ownership review that looks at both the upfront migration spend and the running costs that come after.
Set clear performance targets, measure spend against your pre-migration baseline, and move in phases to help bring those savings through.