Managing cloud costs is challenging, with companies wasting 30–35% of budgets on unused or overprovisioned resources. Automated tools can reduce expenses by up to 70%, but selecting the right one depends on your needs. This guide compares seven popular platforms: Flexera, CloudHealth, Cloudability, Finout, Vantage, CloudZero, and Harness. Here's a quick breakdown:
- Flexera: Best for hybrid IT setups; strong multi-cloud and Kubernetes integration but has a steep learning curve.
- CloudHealth: Ideal for enterprise governance; supports multi-cloud but requires extensive setup.
- Cloudability: Suited for financial governance; excellent chargeback models but costly for smaller teams.
- Finout: Great for SaaS businesses; offers virtual tagging but limited ecosystem.
- Vantage: Focused on SaaS teams; supports AI stacks but relies on third-party tools.
- CloudZero: Designed for engineering teams; excels in unit economics but AWS-focused.
- Harness: Tailored for DevOps; integrates with CI/CD pipelines but less detailed reporting.
Quick Comparison:
| Tool | Best For | Key Feature | Pricing Starting At |
|---|---|---|---|
| Flexera | Hybrid IT setups | Comprehensive multi-cloud view | £750/month |
| CloudHealth | Enterprise governance | Policy-driven control | £750/month |
| Cloudability | Financial governance | Advanced chargeback models | £2,250/month |
| Finout | SaaS/shared costs | Virtual tagging | ~1% of cloud spend |
| Vantage | SaaS teams | FinOps as Code | Free trial available |
| CloudZero | Engineering teams | Unit economics insights | Tiered pricing |
| Harness | DevOps teams | AutoStopping & CI/CD integration | Free for small spend |
Each tool has strengths and limitations. The right choice depends on your cloud setup, team focus, and budget priorities.
::: @figure 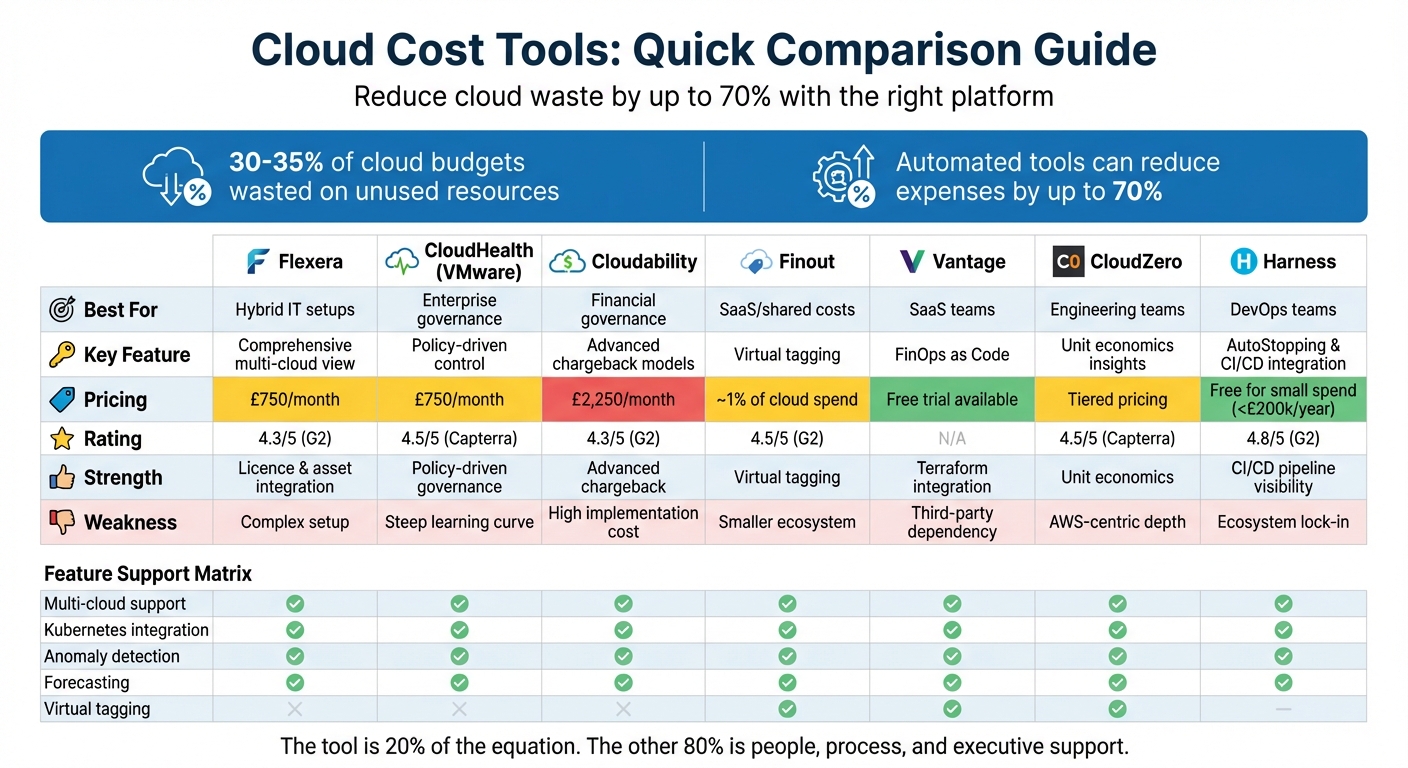 {Cloud Cost Management Tools Comparison: Features, Pricing and Best Use Cases}
:::
{Cloud Cost Management Tools Comparison: Features, Pricing and Best Use Cases}
:::
Top 10 Cloud Cost Management Tools in 2023
Need help optimizing your cloud costs?
Get expert advice on how to reduce your cloud expenses without sacrificing performance.
1. Flexera
Flexera is tailored for organisations navigating complex multi-cloud environments. It consolidates billing data from major providers like AWS, Microsoft Azure, Google Cloud, and Oracle Cloud into a single, normalised view, giving teams a cohesive picture of their cloud expenses[6][7]. Beyond public clouds, Flexera also integrates on-premises and SaaS spending, providing a comprehensive look at hybrid IT costs.
Multi-cloud support
One of Flexera's standout features is its ability to work seamlessly with region-specific providers. Using automated, tag-based allocation, the platform attributes 100% of spending to specific business units or projects[6][7]. This ensures every expense is clearly linked to its source.
JayKay Selvaraj, Senior Manager at Coupa Software, shared:
Flexera helped us get insights on our cloud spend and be more efficient by reducing waste[6].
Anomaly detection
Flexera employs advanced tools like Bollinger Bands with a 10-sample moving average and the Prophet machine learning model to identify cost anomalies. These tools consider trends and seasonality, sending alerts for unusual spikes via email, Slack, or SNS[12][13]. To avoid false positives in volatile environments, the platform also offers a z-score threshold for anomaly detection[13].
Forecasting capabilities
Flexera uses historical data to predict future spending trends. In December 2025, it introduced carbon forecasting, helping organisations align their budgets with sustainability goals[8][12].
Kubernetes integration
For teams using Kubernetes, Flexera integrates billing data from OpenCost and Kubecost, offering clear visibility into container-related costs[8]. The Kubecost Exporter supports both AMD64 and ARM64 architectures[8]. Users can categorise costs with up to 10 grouping dimensions in the Tabular View and create Rule-Based Dimensions for custom allocations[12][8].
Reporting customisation
Flexera's reporting tools are highly adaptable. Features like Rule-Based Dimensions allow for automated cost allocation, while Billing Centres assign expenses to specific business units[8]. Data can also be organised using Tag Dimensions. The platform supports role-based access control (RBAC), ensuring secure access to budgets and billing adjustments. Reports can be exported in CSV or Excel (XLSX) formats, and API integration allows for seamless connectivity with third-party billing, service management, and asset management systems.
Pricing model
Flexera offers a flexible pricing structure, charging either a percentage of cloud spending or a CI-based fee. Enterprise plans start at around £750 per month, with costs scaling upwards based on usage[9][10][11]. The CI-based pricing averages about £0.006 per CI per month (approximately $0.008), and the FinOps module adds a 20% surcharge to CMDB costs[10][11]. The platform has strong user feedback, with a 5/5 rating on Capterra and 4.5/5 on G2. However, some users mention a steep learning curve and a complex setup process as initial challenges[10].
Next, we’ll explore CloudHealth (VMware) to see how it measures up.
2. CloudHealth (VMware)
CloudHealth, now part of the VMware Aria suite and marketed as VMware Aria Cost powered by CloudHealth, supports over 22,000 organisations [16]. Designed for managing complex multi-cloud environments, it integrates with AWS, Azure, GCP, Oracle Cloud, Alibaba Cloud, and VMware Cloud. For hybrid cloud setups, it also connects with on-premises data centres through vSphere integration [26,30]. Its advanced analytics are key to helping organisations optimise cloud spending in these intricate environments.
Multi-cloud support
Using its Perspectives engine, CloudHealth organises assets and costs based on business logic, such as team, project, or department, across various cloud providers [27,30]. Historical asset data is retained even after changes or deletions, which is particularly helpful for audits and analysing total cost of ownership [14]. For instance, one customer reported an increase in visibility from 10% to 100% [14].
Anomaly detection
CloudHealth employs machine learning to identify unusual spending patterns by region, account, or service. It accounts for seasonal variations and incorporates user feedback to minimise false positives. Its impact analysis dashboard allows teams to evaluate the significance of detected anomalies [26,31,34].
Forecasting capabilities
The platform forecasts costs up to 36 months ahead, using up to 12 months of historical data. The forecasting engine considers seasonal trends, periodicity, and past usage patterns. Visual tools compare budgeted, actual, and forecast figures, aiding decisions on reservations and savings plans [32,34]. These forecasting features also extend to detailed cost mapping for containerised workloads.
Kubernetes integration
For containerised workloads, CloudHealth offers visibility at both the service and cluster levels. This allows teams to track resource usage within clusters and allocate costs to specific users or teams [6,29].
Reporting customisation
CloudHealth’s FlexReports enable on-demand analysis of billing data across various parameters, while the Perspectives feature provides dynamic infrastructure views organised by business groups. Custom Line Items allow businesses to add recurring or one-time charges and credits. Additionally, the Intelligent Assist feature uses generative AI to help FinOps teams create detailed reports via natural language queries. Programmatic management and data extraction are supported through GraphQL and REST APIs [26,31,33].
Pricing model
CloudHealth offers a competitive pricing structure. For AWS spend up to £75,000, there’s a flat fee; above this, the charge is around 3% of monthly spend. The platform usually requires a minimum monthly fee of approximately £750. For AWS spend exceeding £75,000, fixed annual fees range from £31,428 (12 months) to £94,284 (36 months). While CloudHealth is recognised as a Leader
in the 2024 Gartner Magic Quadrant for Cloud Financial Management Tools [16], some users note that its steep learning curve may require dedicated staff or extensive training to maximise its reporting capabilities [15].
The next section evaluates Cloudability.
3. Cloudability
Cloudability, now part of IBM's cloud management portfolio, is designed for organisations spending over £7.5 million monthly on cloud services [10]. Recognised as a Leader in the 2025 Gartner® Magic Quadrant™ for Cloud Financial Management Tools [20], the platform focuses on financial governance across AWS, Azure, and GCP, earning a 4.3/5 rating on Capterra [10].
Multi-cloud support
Like Flexera and CloudHealth, Cloudability simplifies cost insights with its distinct interface. It provides a unified view across major cloud providers [18][19]. Its Views
feature allows teams to filter reports by department while controlling data access based on user roles [20]. Features like Business Mapping and Cost Sharing help align cloud expenses with an organisation's structure [21].
Anomaly detection
The platform’s automated anomaly detection system flags unexpected spending spikes. It monitors patterns and alerts teams when costs exceed predicted thresholds [17].
Forecasting capabilities
Cloudability’s forecasting engine leverages watsonx AI models, trained on extensive historical spending data [17][18]. Users can choose models that best suit their needs and fine-tune inputs for more accurate predictions. The tool provides month-to-date analysis and estimates when budgets might be exceeded. Forecasts are available across all linked cloud providers and can be mapped to specific accounts, services, or organisational structures using the Views feature [17].
Kubernetes integration
For containerised workloads, Cloudability offers container-aware views and cost allocation [10][20]. However, some users have noted that the container agent focuses more on reporting than offering detailed rightsizing recommendations [10].
Reporting customisation
The platform supports unlimited custom dashboards, tailored to individual products, departments, or roles. These dashboards allow resource-level reporting across cloud services and update in near real time [20]. One G2 user highlighted:
The feature that allows viewing Azure consumption by different areas, departments, and applications is extremely valuable, aiding in operational awareness and strategic planning.[10]
Cloudability’s True Cost Explorer provides a clear visualisation of complex billing data, pinpointing key cost drivers across multi-cloud environments. Integrations with tools like Jira, Datadog, and PagerDuty add operational and observability context to cost data [20].
Pricing model
Cloudability operates on a custom pricing model, requiring direct contact with the sales team [19]. Prices reportedly start at around £2,250 per month, scaling with the number of connected accounts and data volume [10]. A free trial, lasting between 14 and 28 days, is available. However, some users have mentioned that while the financial analysis is robust, the visualisation features could be more advanced [17][10].
Next, we compare Finout.
4. Finout
Finout is a FinOps platform designed for enterprise-level cloud cost management, supporting AWS, GCP, Azure, and Oracle Cloud Infrastructure [22][23][24]. At its core is the patented MegaBill Data Layer, which consolidates billing data from multiple cloud providers, Kubernetes, and SaaS tools like Snowflake, Databricks, and Datadog into a single, actionable view [23]. This unified approach aims to simplify cloud cost management. Companies using Finout have reported impressive results, including achieving up to 98% cost allocation accuracy and cutting cloud costs by 43%. Additionally, engineering teams have saved 50% of the time they previously spent managing costs [29].
Multi-cloud support
Finout’s MegaBill delivers a consolidated view of all cloud expenses, complete with advanced filters for deeper insights. The Data Explorer feature allows users to create custom, multi-dimensional reports tailored to their specific needs [27]. By standardising cost terminology across providers, Finout ensures consistency in financial reporting [26]. Reports can also be customised using different accounting methods, such as Unblended, Amortised, Net Amortised, Blended, and FairShare costs. The FairShare method is especially useful for addressing misaligned discounts in environments where multiple teams share resources [26].
Anomaly detection
The platform’s AI-driven anomaly detection keeps an eye on historical MegaBill data, flagging unexpected spending spikes. Alerts are sent through Slack or email and include Kubernetes-specific anomalies, ensuring teams can respond quickly to irregularities [27][29][31].
Forecasting capabilities
Finout provides daily spending forecasts, complete with scalable budgets and confidence intervals [29][30]. This helps organisations predict spending trends and adjust resource allocation before costs spiral out of control.
Kubernetes integration
Finout offers in-depth Kubernetes cost tracking, breaking down expenses by namespaces, labels, and pods [31]. It integrates Kubernetes metrics from tools like Prometheus or Datadog with real cloud billing data, creating a single cost centre for better oversight [33]. The CostGuard feature identifies overprovisioned resources and includes a dynamic calculator to simulate the financial impact of optimising CPU and memory usage [31]. Vijay Kurra, Senior Manager of Cloud DevFinOps at Tenable, shared his experience:
I highly recommend Finout to any organization seeking to optimize their cloud resource management and drive cost efficiency in dynamic Kubernetes environments.[24]
Finout also detects idle costs at the node and namespace levels, helping organisations eliminate waste [31][33]. It supports Kubernetes environments across AWS EKS, Google Cloud GKE, and Azure AKS [32].
Reporting customisation
Finout’s Virtual Tagging (VTags) system allows users to group and label costs across technologies and cloud providers without modifying original resources or code. Dashboards can be built using a drag-and-drop interface with widgets for metrics like cost, usage, budget, unit economics, and anomalies. These dashboards can then be shared as automated reports via Slack, email, or Microsoft Teams, ensuring relevant data reaches the right teams. Role-based access control adds an extra layer of security, restricting who can view or edit specific reports [25][27][28][30].
Jan Wiberg, a Cloud Architect, praised the platform’s efficiency:
Our investment in Finout paid off quickly - we covered its cost within days and achieved a 150% ROI within the first week![29]
These customisation features complement Finout’s pricing structure.
Pricing model
Finout uses a flexible pricing model based on a percentage of overall cloud spend, typically around 1% [29][30]. Unlike some competitors, it doesn’t charge fees based on savings. Additionally, Finout offers affordable cost history retention, with over six months of data available for free or at a minimal cost [30]. However, some users have noted that integration with tools like GitHub, GitLab, and Jenkins could be improved [30].
Next, we compare Vantage.
5. Vantage
Vantage is a cloud cost management platform designed to streamline multi-cloud environments. It integrates with over 25 platforms, including AWS, Azure, GCP, Oracle Cloud, and specialised tools like Kubernetes, Snowflake, Datadog, and OpenAI [5][2][35]. By consolidating billing data from these sources into a single dashboard, it eliminates the need for manual data handling [36]. Nick Van Wiggeren, CTO at PlanetScale, highlighted the platform's impact:
Doing all our cost reporting manually was taking too much time and wasn't sustainable. Every month felt like starting from scratch.[37]
Multi-cloud support
Vantage stands out for its compatibility with modern AI stacks, supporting providers like Anthropic and OpenAI [34][2]. Its Virtual Tagging feature enables FinOps teams to categorise and allocate costs retrospectively across complex organisational structures, avoiding the need for engineering teams to retag resources manually [36]. The platform also standardises billing data across providers, allowing cross-cloud cost analysis without switching between dashboards.
Anomaly detection
The platform features real-time anomaly detection, flagging unusual spending patterns and sending alerts through Slack, Microsoft Teams, or email [5][35].
Forecasting capabilities
Vantage offers two levels of forecasting: Baseline Forecasts for all users and Dynamic Forecasts for enterprise customers [39]. Baseline Forecasts use time-series models to factor in seasonality and irregular spikes, while Dynamic Forecasts incorporate business metrics like API usage or subscriber growth to project costs as the business scales. These forecasts are service-specific, providing upper and lower cost bands alongside a median projection. Updates occur daily, with forecasts generated in under 10 minutes once a Cost Report is saved [39].
Kubernetes integration
Through its dedicated Kubernetes (K8s) Agent, Vantage provides detailed metrics, breaking down compute costs by namespace and label. This helps identify inefficiencies like pod waste and idle cluster costs, while offering automated recommendations for rightsizing [34]. Supported Kubernetes environments include AWS EKS, Google Cloud GKE, and Azure AKS. A customer from Block shared:
The biggest thing we've solved \[with Vantage\] is being able to put data into the hands of the teams that are responsible for it.[34]
Reporting customisation
Vantage enables flexible reporting with multi-dimensional filters, allowing users to group reports by provider, account, service, category, subcategory, and resource ID. Operators like contains
, starts with
, and flexible match
make it easier to normalise inconsistent tagging (e.g., aligning teamA
, team-a
, and Team A
) - a key feature for older systems. Users can adjust the X-axis to dimensions such as Service
, Region
, or Tag Key
for side-by-side comparisons and drill down into specific resource costs. Reports can be organised into folders by team or business unit and shared automatically via Slack or Microsoft Teams. For UK-based enterprises, the platform supports region-specific grouping (e.g., EU-West-2) and includes a Taxes
toggle to manage VAT visibility in financial reports [38]. This level of customisation offers a solid foundation for comparing cost visualisation approaches across platforms.
Pricing model
Vantage is marketed as a transparent and affordable alternative to competitors with restrictive pricing structures [2]. It provides a free trial for cloud cost tracking, with a setup process that takes hours instead of days [5][2]. The platform is also SOC 1 Type 2 and SOC 2 Type 2 compliant, ensuring top-tier security and governance [36].
Next, we’ll explore CloudZero and how its features compare to Vantage.
6. CloudZero
CloudZero zeroes in on unit economics, helping businesses track costs per customer, feature, or product. Its emphasis on accurate cost allocation aligns with the themes of detailed tracking and custom reporting highlighted throughout this guide. Using its AnyCost™ framework, the platform consolidates billing data from AWS, Azure, GCP, Oracle Cloud, and over 50 specialised services - like Snowflake, Datadog, and MongoDB - into a single, accessible dashboard. A standout feature is its ability to allocate 100% of multi-cloud spend, including shared and untagged resources, through a code-driven method called CostFormation®.
Anomaly detection
CloudZero employs AI-powered anomaly detection to monitor hourly spend data. By comparing the last 36 hours against 12 months of historical data, it flags unusual spending patterns without the need for manual threshold adjustments. Real-time alerts are sent via Slack, email, or Jira, ensuring immediate action. Peter Agelasto, Co-founder and CPO at Starchive, shared his experience with the system:
I click 'Review anomaly,' I jump in, and my first reaction is, 'Holy cow, we're up 1,600% of our normal costs!' Had we not been alerted, I wouldn't have caught this.[43]
To date, CloudZero has identified over 5,558 anomalies across its users, helping to address more than £16 billion in annualised anomalous spending [43].
Kubernetes integration
For teams working with Kubernetes, CloudZero delivers precise cost allocation by combining container usage data with cloud provider billing. Costs can be broken down at an hourly level by pod, cluster, or namespace. The platform supports AWS EKS, Google Cloud GKE, and Azure AKS, providing 10–15% more accurate Kubernetes cost data alongside other cloud expenses [42].
Reporting customisation
CloudZero's custom reporting capabilities rely on Dimensions and Views, which are created using its CostFormation Definition Language. This approach organises spending by business context - like team, feature, or customer - without requiring manual tagging. Stuart Davidson, Platform Engineering Lead at Skyscanner, highlighted the tool's impact:
Within two weeks, we found enough savings to pay for a year of license. It was that good - that intuitive.[41]
The platform includes two years of historical hourly data as standard, with an option to extend to five years. On average, users save 22% in their first year, with many reporting a 33% boost in efficiency thanks to improved cost visibility [4].
Pricing model
CloudZero offers a tiered pricing model designed to be predictable, avoiding monthly overages or fees based on a percentage of spend. Subscriptions include unlimited user seats, encouraging company-wide adoption of FinOps practices. A 14-day free trial is available for eligible accounts. The platform's capabilities earned it recognition as a Visionary in the 2025 Gartner Magic Quadrant for Cloud Financial Management Tools [40].
Next, we'll take a closer look at Harness and its approach to managing cloud costs.
7. Harness

Harness provides hourly cost insights for AWS, Azure, and Google Cloud Platform by bringing multi-cloud spending data into a single dashboard [44]. Its focus is on delivering actionable cost visibility to DevOps teams for daily operations, rather than limiting insights to monthly reviews for CFOs.
Multi-cloud support
Harness simplifies cost tracking by unifying data from AWS, Azure, and GCP into one dashboard. It uses the FOCUS v1.1 standard for multi-cloud reporting [44], making it easier for teams to compare spending patterns and resource usage without the headache of dealing with different billing formats.
Anomaly detection
Harness employs the Prophet Model to analyse 42 days of historical data, identifying anomalies as Low, Medium (changes of £1,000 or 50%), or Critical (increases of £5,000 or 100%+) [48]. Chris Camire, Senior Manager of Technical Services, shared the impact of Cloud AutoStopping, which shuts down idle clients:
Right away we were saving $15,000 to $20,000 a month, and in only six months, we saw our first savings topping $100,000 a month.[45]
For businesses with seasonal spending trends, advanced models use 16 months of data to account for long-term patterns [48]. The platform also reruns anomaly detection for the past three days to handle delayed cost updates from cloud providers [48].
Forecasting capabilities
Harness uses historical data and recurring spending patterns to forecast future costs [47]. It supports real-time, hierarchical budget forecasting to help teams stay within their limits [45]. Users can set Minimum Cost Impact
thresholds - based on pounds or percentages - to filter out minor changes and focus on major cost spikes. Additionally, the Anomaly Persistence
setting adjusts a resource's baseline automatically if a cost increase is intentional and consistent [48].
Kubernetes integration
Harness provides detailed visibility for container environments, breaking down costs by namespace, workload, node, and pod [47]. Its Cluster Orchestrator manages spot instances and node autoscaling for AWS EKS, Google Cloud GKE, and Azure AKS [76,77]. This allows teams to track shared cluster costs accurately and supports Split Cost Allocation Data (SCAD) for container-level resources. For instance, United Airlines used Harness CCM to optimise cloud spending and improve FinOps practices [45]. The detailed cost data feeds into customisable reports, enhancing cost management across teams.
Reporting customisation
Harness offers Cost Perspectives, which group resources by team, application, or project without requiring extensive tagging [44]. Users can create, schedule, and manage reports with tailored data columns, timeframes, and levels of detail. The AI-powered Harness AIDA even allows natural language queries [45]. Jay Patel, Director of Platform Engineering-DevOps, highlighted the benefits of automation:
With the Harness Cloud Asset Governance feature, we are now automating cost governance, driving half of the savings from the part that we thought was already well-governed.[45]
The Enterprise plan expands data visibility to five years (compared to 30 days in the free tier) and allows for up to 2,000 folders to organise customised Perspectives [78,83]. These features support Harness' flexible pricing model, detailed below.
Pricing model
Harness offers a Free Forever
plan for organisations spending less than £200,000 annually on cloud services. This includes visibility for two Kubernetes clusters and 30 days of historical data [46]. For organisations exceeding £200,000 in annual cloud spend, the Enterprise tier provides unlimited Kubernetes clusters and five years of data visibility [46]. The Enterprise plan uses a modular SKU structure, including Cloud Cost Insights, Commitment Orchestrator, AutoStopping, and Cluster Orchestrator. AutoStopping alone can cut non-production cloud costs by up to 70%, while combining AutoStopping, Spot Orchestration, and Commitment Orchestrator can save up to 90% [74,77].
| Feature | Free Forever | Enterprise Plan |
|---|---|---|
| Cloud Spend Limit | Up to £200,000/year | Unlimited |
| Kubernetes Clusters | 2 clusters | Unlimited |
| AutoStopping Rules | 10 rules | Unlimited |
| Data Visibility | 30 days | 5 years |
| Pricing Structure | Free | Modular SKUs |
Next, we'll explore the strengths and limitations of these cloud cost management tools.
Advantages and Disadvantages
Here’s a breakdown of the main strengths and challenges of different cloud cost management platforms, based on their features and focus areas.
Cloud cost management tools come in all shapes and sizes, varying in complexity, focus, and pricing. Established enterprise platforms like Flexera, CloudHealth, and Cloudability excel in governance, offering features like policy-driven controls and audit-ready chargeback models. However, their intricate setups can be overwhelming for smaller teams [49][50]. On the other hand, modern tools such as CloudZero, Finout, and Vantage are designed with developers in mind, focusing on features like virtual tagging and cost-to-code connections. While these tools prioritise user experience, their multi-cloud capabilities may not be as extensive as those of enterprise platforms [49][50].
As previously mentioned, using the right cost management tool can lead to savings of 40–70% [1]. This makes selecting the right platform a crucial decision. For example, Cloudability is known for its top-tier chargeback capabilities but comes with a higher price tag, making it an option for enterprise budgets [49]. Meanwhile, Harness caters to DevOps teams, integrating seamlessly with CI/CD pipelines, though its reporting options are not as detailed as those offered by specialised platforms [50].
CloudZero is particularly noteworthy for its ability to link costs to business metrics, such as cost per customer or feature, without requiring manual tagging. It boasts a 4.5/5 rating on Capterra, though its most detailed insights are geared towards AWS despite supporting multiple clouds [49]. Finout tackles the issue of tag drift
with virtual tagging that automatically manages shared and untagged resources. However, as a newer player, its ecosystem and historical data visualisation tools are still evolving [49][50]. Vantage offers a straightforward interface and Terraform-based FinOps as Code
capabilities, making it a great fit for SaaS teams, although it relies on third-party integrations for some data sources [2][3].
For teams working heavily with Kubernetes, both Harness and CloudZero provide detailed visibility into container-level costs. Harness has earned a 4.8/5 rating on G2, while CloudHealth, with its policy-driven governance, holds a 4.5/5 rating. However, CloudHealth’s interface complexity and high costs may deter smaller businesses [1][50]. Flexera combines cost allocation with licence optimisation, making it a strong choice for hybrid IT environments, though its heavy interface and long setup times are often cited as drawbacks [49][50].
| Tool | Best For | Key Strength | Key Weakness | Rating |
|---|---|---|---|---|
| Flexera One | Hybrid IT/Governance | Licence & asset integration | Complex setup | 4.3/5 (G2) [49] |
| CloudHealth | Enterprise governance | Policy-driven control | Steep learning curve | 4.5/5 (Capterra) [49] |
| Cloudability | Finance/FinOps teams | Advanced chargeback models | High implementation cost | 4.3/5 (G2) [49] |
| Finout | SaaS/shared costs | Virtual tagging | Smaller ecosystem | 4.5/5 (G2) [49] |
| Vantage | Modern SaaS teams | FinOps as Code (Terraform) | Third-party dependency | - |
| CloudZero | Engineering teams | Unit economics | AWS-centric depth | 4.5/5 (Capterra) [49] |
| Harness CCM | DevOps/CI-CD | CI/CD pipeline visibility | Ecosystem lock-in | 4.8/5 (G2) [50] |
These comparisons highlight the diverse approaches to cloud cost management. By understanding the strengths and limitations of each platform, teams can select the tool that aligns best with their financial goals and operational priorities.
Conclusion
This guide's exploration of cost tracking, reporting, and integration features highlights that choosing the right tool is just the starting point. For organisations navigating complex, multi-cloud environments, tools like CloudHealth, Flexera, and Cloudability stand out with their detailed reporting and cost allocation capabilities. Meanwhile, teams prioritising FinOps best practices and unit economics might find CloudZero and Finout better suited, while Harness is particularly effective for DevOps teams aiming to integrate cost management into their CI/CD pipelines.
That said, tools are only a small piece of the puzzle. As a FinOps expert from StarAgile | Tech Bytes puts it:
The tool is maybe 20% of the equation. The other 80% is people, process, and executive support. Choose a tool that fits your culture, not one that tries to change it[51].
While tools provide the visibility needed for cost management, achieving meaningful cost optimisation demands changes in organisational processes, team collaboration, and executive backing.
For businesses ready to go beyond tool implementation, expert guidance can make all the difference. Firms like Hokstad Consulting specialise in embedding best practices in cloud cost management and DevOps transformation. Their strategic approach has helped organisations reduce cloud expenses by as much as 30–50%. If your organisation spends over £10,000 monthly on cloud infrastructure or manages multi-cloud setups, partnering with experienced consultants can fast-track results, establish sustainable FinOps practices, and turn cloud cost management into a proactive strategy for financial governance.
FAQs
Which cloud cost tool fits my team (Finance, Engineering, or DevOps)?
The right cloud cost tool largely hinges on your team's specific needs. For finance teams, tools that emphasise cost analysis, budgeting features, and optimisation capabilities are a great fit. Engineering teams, on the other hand, will benefit from tools that provide detailed resource insights and seamless integration with cloud platforms. Meanwhile, DevOps teams should look for tools that excel in automation, real-time monitoring, and predictive analytics. Picking a tool that aligns with your team's responsibilities can make a big difference in managing costs and improving efficiency.
How do these tools allocate shared and untagged costs accurately?
These tools rely on resource tagging, allocation models, and audits to distribute shared and untagged costs effectively. Tags play a key role by associating expenses with specific teams, projects, or departments, allowing for precise tracking. For costs that lack tags, automated detection and reporting come into play, helping to pinpoint resources. Allocation is then managed using either usage-based or account-based models. Regular audits, paired with automation, enhance accuracy by spotting unused resources and anomalies, ensuring costs are allocated correctly.
What data and access do I need to set one up safely?
To set up cloud cost management tools securely, you’ll need access to detailed billing and cost data from your cloud providers. This usually means having the right permissions to view billing information, resource usage, tagging, and associated metadata.
It’s also important to enable APIs or billing export features to collect this data effectively. Make sure you have access to monitoring metrics as well - these are essential for accurate cost tracking and a thorough analysis of your cloud expenses.