
Want to cut cloud costs while improving DevOps performance? Start by tracking these five metrics that align your spending with team efficiency:
- Cost per Deployment: Measure cloud expenses per code deployment to spot inefficiencies early.
- Cost per User/Transaction: See how much you're spending for each user or transaction to ensure your infrastructure scales effectively.
- Infrastructure Utilisation: Identify underused resources like idle CPUs or GPUs to reduce waste.
- Deployment Frequency & Lead Time: Speed up code delivery without overspending by automating cost checks in pipelines.
- Change Failure Rate & MTTR: Reduce errors and recovery times to minimise unexpected costs from incidents.
These metrics help UK businesses manage cloud budgets in GBP, meet regulatory standards (e.g., GDPR), and optimise DevOps workflows. Tools like Infracost, Terraform, and OpenCost can simplify tracking, saving up to 40% on cloud expenses when used effectively.
Key takeaway: Integrate cost insights into engineering decisions for better control over cloud spending and improved team performance.
::: @figure 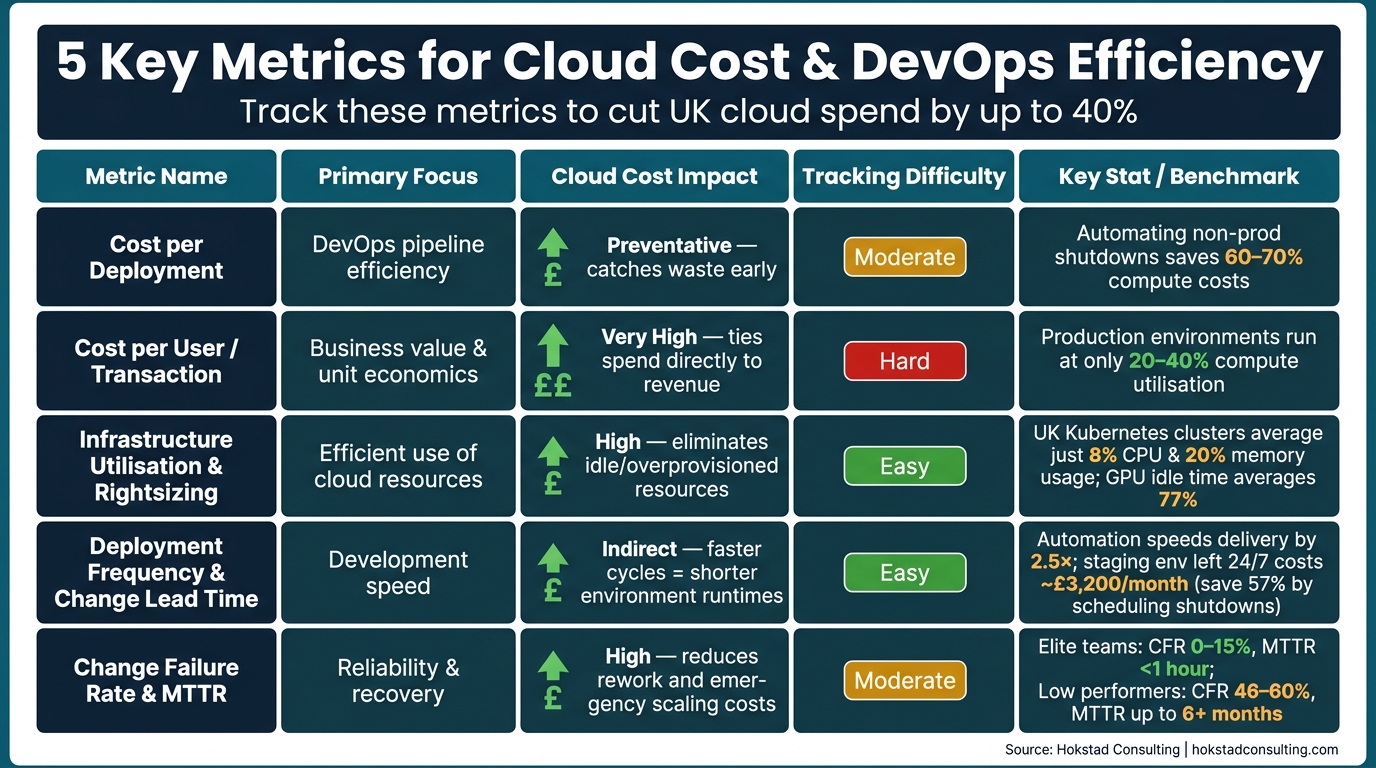 {5 Cloud Cost & DevOps Metrics: At-a-Glance Comparison}
:::
{5 Cloud Cost & DevOps Metrics: At-a-Glance Comparison}
:::
Datadog Cloud Cost Management: Make cost a key metric for engineers
Need help optimizing your cloud costs?
Get expert advice on how to reduce your cloud expenses without sacrificing performance.
1. Cost per Deployment
Cost per deployment measures the cloud expenses incurred every time code is deployed. This is calculated by dividing the total direct costs (like compute and storage) and proportional indirect costs (such as networking, support, and platform services) by the number of deployments within a specific time frame [7][8].
To measure this effectively, proper tagging is essential. Each resource should have a unique deployment ID assigned during provisioning. Tags for team, environment, service, and cost centre should also be incorporated through Infrastructure as Code (IaC) templates to make cost data easily traceable.
Cloud Cost Management Benefits
By tracking cost per deployment, your CI/CD pipeline can act as a checkpoint for expenses. For example, tools like Infracost can be integrated into GitHub Actions to show a cost diff
on every pull request, projecting the monthly financial impact [3]. This allows teams to set cost thresholds - such as blocking a merge if the proposed changes increase monthly costs by more than £500. Addressing costly decisions, like oversized Kubernetes pods or unnecessary cross-zone traffic, during development is much more economical [3][6].
Relevance to DevOps Metrics
Cost per deployment is now being viewed as an additional DORA metric, alongside deployment frequency, lead time, change failure rate, and mean time to recovery [1]. By treating cost as an operational signal - similar to latency or error rates - teams can quickly identify if a deployment increases the cost of delivering value [5].
Non-production environments often run continuously, even when they’re not actively used. Automating shutdowns outside UK business hours (e.g., 8pm–8am and weekends) can reduce compute costs by 60–70% [1][3].
UK-Specific Business Considerations
UK engineering teams must consider financial and regulatory requirements when calculating and managing deployment costs:
| UK Consideration | Impact on Cost Accuracy | Relevant Standard |
|---|---|---|
| Currency (GBP) | Prevents unexpected exchange rate fluctuations on invoices | UK Accounting Standards |
| Data Sovereignty | Storage location affects per-deployment costs | GDPR / Data Protection Act 2018 |
| Financial Oversight | Ensures auditable cost tracking for risk controls | FCA Handbook / PRA Rulebook |
| Public Sector | Demonstrates Value for Moneyfor deployments |
Government Cloud First Policy |
Cloud providers like AWS, Azure, and GCP offer billing APIs (e.g., AWS Cost Explorer, Azure Cost Management, GCP BigQuery Billing Export) that provide daily cost details within 24–48 hours of deployment [1]. For multi-cloud environments, creating a unified reconciliation schema is often necessary to handle differences in billing formats and tagging capabilities.
At Hokstad Consulting, we help optimise DevOps workflows and manage cloud infrastructure costs with tailored strategies. By enforcing precise tagging and integrating cost estimation tools early in the process, UK businesses can ensure every deployment is efficient and financially sound.
Next, we’ll explore Cost per User or Transaction to deepen the connection between cloud spending and DevOps performance.
2. Cost per User or Transaction
This metric is all about understanding how efficiently your infrastructure scales. To calculate it, you simply divide your total infrastructure cost by the number of product units delivered. These units could be anything - active users, completed orders, API calls, or payment transactions [4].
The idea here is to shift the focus from just sticking to a budget to evaluating the value you're getting for what you spend. As Lyne Carolyne from CloudZero puts it:
The question that should drive every cloud-native investment is not 'are we under budget?' It is 'was it worth it?'[10]
This is a crucial distinction because many production environments run at only 20–40% compute utilisation while still paying for full capacity [4]. If your cost per transaction stays the same or even rises as you scale, it might be a sign that your architecture isn’t as efficient as it could be.
Cloud Cost Optimisation and DevOps Efficiency
Two main culprits can inflate this metric: cross-zone network traffic and oversized compute resources. For example, keeping microservices that frequently communicate within the same Availability Zone can help you avoid cross-AZ transfer fees, directly cutting costs as you scale [12]. On the compute side, tools like Karpenter or the Vertical Pod Autoscaler (VPA) can dynamically adjust resource requests to match actual usage, potentially reducing node costs by 20–60% [12].
These adjustments also serve as a performance check for architectural changes. Whether you’re moving from a monolithic structure to microservices or adopting containerisation, tracking this metric helps determine if those changes are genuinely improving efficiency or just redistributing costs [4]. Monitoring this over time strengthens the connection between engineering decisions and business outcomes, aligning cloud cost management with DevOps goals.
Tracking Across Cloud Providers and Tools
Application telemetry tools, such as AWS CloudWatch or Azure Monitor, make it easier to track this metric. They log the execution time and duration of key functions, allowing you to link cloud runtime costs directly to individual transactions [11]. For businesses using multiple cloud providers, the FOCUS (FinOps Open Cost and Usage Specification) standard is becoming a go-to for normalising billing data across platforms like AWS, Azure, and GCP [12].
Here’s how transaction units can differ by business model:
| Business Type | Transaction Unit | Example Calculation |
|---|---|---|
| SaaS | Active user | Total infrastructure cost ÷ active users [4] |
| E-commerce | Completed order | Monthly infrastructure cost ÷ orders processed [9] |
| Fintech | Payment transaction | Compute + database cost ÷ transactions [4] |
| API Platform | 1,000 API requests | Gateway + Lambda cost ÷ API calls [12] |
| AI/ML | Model inference | GPU cost ÷ number of inferences [4] |
UK Business Considerations
For businesses in the UK, reporting in GBP and adhering to the GDPR and Data Protection Act 2018 by excluding personally identifiable information (PII) ensures compliance while maintaining precise financial tracking [13][14]. At Hokstad Consulting, tracking unit economics is a key part of their approach, often helping UK companies cut cloud spending by 30–50%. This metric provides a clear, auditable view of the actual cost per unit of value delivered, making it an essential tool for evaluating cost efficiency and planning further cloud expenditure optimisations.
3. Infrastructure Utilisation and Rightsizing Efficiency
In 2026, data from the UK reveals an eye-opening reality: Kubernetes clusters are operating at just 8% CPU usage and 20% memory usage, leaving a staggering 92% of resources idle [16]. This highlights a critical opportunity to align infrastructure use with cost-effective DevOps strategies, complementing other metrics like cost-per-deployment and cost-per-transaction.
Cloud Cost Optimisation Impact
Rightsizing is all about aligning cloud resources - CPU, memory, storage, and network - with actual workload demands [15][19]. It’s often the first and most impactful step in managing cloud costs, requiring no code changes or long-term commitments [15]. Organisations that implement rightsizing effectively can typically cut compute waste by 25–40% [15]. However, it’s vital to rightsize before committing to Reserved Instances or Savings Plans, as locking in mis-sized resources only solidifies inefficiencies [15][6].
As CloudZero aptly puts it:
Rightsizing vs downsizing isn't about spending less. It's about spending right.- CloudZero [15]
In some cases, switching to a different instance family - like moving from general-purpose to memory-optimised - can resolve bottlenecks and lower costs [15][19]. Below is a quick guide to common overprovisioning issues and the adjustments that can help:
| Resource | Overprovisioning Signal | Recommended Action |
|---|---|---|
| CPU | Usage consistently below 20% | Downsize or switch to burstable (T-family) [15] |
| Memory | Average usage below 30% | Move to a memory-optimised instance (e.g., R-family) [15] |
| Disk IOPS | Usage below 20% of provisioned | Switch to a lower IOPS tier (e.g., gp3) [15] |
| GPU | Average usage below 40% | Switch to a CPU instance or a smaller GPU [15] |
GPU waste is becoming a major concern. In AI/ML workloads, idle GPU time averages 77%, with some teams using as little as 5% of their GPU capacity [6][16]. Addressing these inefficiencies can significantly enhance resource utilisation and cost management.
DevOps Efficiency and Performance Relevance
In Kubernetes environments, a practical starting point is using the Vertical Pod Autoscaler (VPA) in Recommendation Mode. This approach gathers real usage data, which can then inform decisions before enabling Auto Mode for stateless workloads [16][17]. For accurate sizing, rely on P95 or P99 metrics rather than averages, ensuring peak demand is accounted for [17][18]. A handy guideline is the p99 / 0.85
rule: size to the 99th percentile of usage and add 15% headroom to manage traffic spikes [18].
Tracking Across Cloud Providers and Toolchains
To make rightsizing easier, cloud providers offer native tools like AWS Compute Optimizer, Azure Advisor, and GCP Cloud Recommender, which help identify underutilised resources [15][19]. For Kubernetes-specific insights, OpenCost (an open-source tool under the Apache 2 licence) provides real-time cost allocation at the pod and namespace level [22]. Additionally, tools like Infracost integrate directly into CI/CD pipelines and IDEs, offering pre-deployment cost analysis for over 1,100 resources across AWS, Azure, and GCP [20][21].
UK Business Considerations
For UK businesses, tools like Infracost Cloud can be tailored to include custom price books, incorporating negotiated Enterprise Discount Programme rates and displaying costs in GBP instead of USD [21]. This ensures accurate financial reporting and budgeting. At Hokstad Consulting, rightsizing assessments are a cornerstone of our cloud cost engineering services, helping businesses in the UK cut unnecessary expenses before committing to long-term cloud investments.
4. Deployment Frequency and Change Lead Time
Deployment frequency tracks how often your team pushes code into production, while change lead time measures the time it takes from merging a change to seeing it live. These two metrics are part of the DORA metrics quartet, and as of 2026, they’ve evolved from being purely engineering KPIs to business-critical indicators. They now play a direct role in ensuring revenue stability and managing cloud costs efficiently [24]. Elite teams set the bar high, deploying multiple times daily with lead times under an hour. On the other hand, low-performing teams can take over six months to move from merge to production [24][25]. While automation can speed up delivery cycles by 2.5× [23], speed alone doesn’t always translate into cost savings.
Cloud Cost Management
These metrics now influence more than just the speed of code delivery - they’re tightly linked to managing cloud costs. Faster deployments are undoubtedly beneficial, but they also highlight how continuous integration/continuous delivery (CI/CD) pipelines can inadvertently accelerate cloud spending. For instance, a single unreviewed pull request could provision costly infrastructure in mere minutes [6]. The solution? Integrate cost gates into your pipeline. Tools like Infracost generate a cost diff
for every pull request, giving engineers a clear view of the financial impact of infrastructure changes before they’re merged [3][6].
Automating environment lifecycles is another critical factor. For example, a staging environment left running 24/7 could cost around £3,200/month. By shutting it down outside UK business hours (09:00–17:30) and on weekends, you could reduce that cost by approximately 57%, saving £1,800/month [6]. Taking it a step further, automatically destroying branch environments once a pull request is closed can help eliminate overlooked environments that unnecessarily drive up costs.
Aligning DevOps Metrics with Performance
Beyond cost gates, refining how you define and measure these metrics can align DevOps performance with financial goals. For instance, count a “deployment” as a successful deploy-to-production workflow run, and measure lead time starting from merge-to-main rather than from when a developer initially opens a branch. This approach removes irrelevant delays from your data [26]. Tools like Datadog or Grafana can help you correlate deployment timestamps with infrastructure metrics, making it easier to identify if a spike in cloud costs aligns with a specific release [24][25]. Another useful metric to monitor is the Deployment Rework Rate, which tracks the percentage of unplanned deployments triggered by production issues. This can act as an early warning for stability problems [26].
Considerations for UK Businesses
For organisations operating in the UK, specific factors add complexity to deployment and cost management. GDPR compliance, for example, may restrict the choice of cloud regions, which can increase both latency and costs. Similarly, Change Advisory Board (CAB) processes, common in industries like finance and healthcare, can add around 40% to lead times. Automating low-risk Standard Changes
can help recover some of this lost time.
Seasonal demand surges, such as Black Friday, also require rapid scaling capabilities. Adopting a hybrid pricing model that combines Reserved and Spot instances can deliver cost-effective scalability. Additionally, UK Working Time Regulations may influence on-call response times, so calibrating alerts to avoid engineer burnout is essential.
| Consideration | Impact on Metrics | Recommended Action |
|---|---|---|
| GDPR Compliance | Limits cloud regions, affecting latency and cost | Use IaC to enforce data residency tags |
| CAB Approvals | Adds ~40% to lead time in finance/health sectors | Automate low-risk Standard Changes |
| UK Working Time Regulations | Impacts on-call response and recovery | Adjust alerts to reduce burnout |
| Seasonal Spikes | Requires rapid scaling (e.g., Black Friday) | Combine Reserved and Spot instances for cost efficiency |
At Hokstad Consulting, we focus on improving deployment frequency and reducing lead times as part of our DevOps transformation services. This includes building CI/CD pipelines and implementing automated environment policies to maintain fast delivery without letting cloud costs spiral out of control.
5. Change Failure Rate and Mean Time to Recovery
Change Failure Rate (CFR) measures the percentage of deployments that lead to a production incident, while Mean Time to Recovery (MTTR) tracks how quickly normal service is restored after a failure. These two metrics form the stability side of the DORA framework and have a direct impact on financial outcomes, making them critical for any organisation focused on efficiency and cost management.
According to DORA benchmarks, elite teams maintain a CFR between 0–15% and an MTTR of under one hour. On the other hand, low-performing teams experience failure rates of 46–60% and recovery times ranging from one week to over six months. This disparity doesn't just affect engineering teams - it has a ripple effect on revenue, customer trust, and cloud expenses.
Cloud Cost Optimisation Impact
Failures can drive up cloud costs due to unexpected resource consumption, such as emergency rollbacks or unplanned scaling. As Ethan Mercer, Senior Cloud Infrastructure Editor, explains:
A cloud program that only reports 'lower server costs' is undermeasuring itself. Track change failure rate, mean time to restore... to reveal the real ROI picture.[2]
For example, in 2025, a UK-based SaaS company partnering with Hokstad Consulting uncovered £120,000 in annual savings by addressing overprovisioning and improving recovery processes. This shows how tracking CFR and MTTR can expose hidden inefficiencies and lead to meaningful cost reductions [2].
DevOps Efficiency and Performance Relevance
Reducing MTTR often starts with decoupling deployment from release, a strategy that leverages feature flags. This approach allows teams to disable problematic features in seconds, avoiding the need for full rollbacks [30]. Conducting blameless post-mortems also helps identify root causes and creates a culture where rapid recovery is encouraged [28][30].
Another metric gaining traction is the DORA Rework Rate, introduced in 2024. This measures the proportion of unplanned deployments caused by production incidents, serving as an early warning sign for rising CFR [27][29].
Ease of Tracking Across Cloud Providers and Toolchains
Tracking these metrics effectively across multiple platforms can be challenging. For example, if your application pipelines use GitHub Actions but your infrastructure relies on Jenkins, you'll need a normalised event model to link deployment events with incidents. Without this, CFR data can become fragmented and unreliable. It's also worth noting GitHub's REST API rate limit of 5,000 requests per hour per token, which can introduce gaps in monitoring [29].
Tools like New Relic can help address these challenges. In June 2025, Onefootball's engineering team transitioned to Kubernetes and adopted New Relic’s observability platform. This allowed them to monitor deployment impacts alongside application performance, reducing incidents by 80% and freeing up 40% of developer time previously spent on troubleshooting [2].
Alignment with UK Business Considerations
For UK businesses, closely tracking CFR and MTTR is essential not only for operational stability but also for managing costs and meeting regulatory requirements. Industries like financial services and healthcare must comply with FCA and NHS Digital standards, which include strict rules on incident reporting and service continuity. High MTTRs in these sectors can lead to compliance issues and SLA penalties, which are often calculated in GBP and can escalate quickly during extended outages. Improving CFR and MTTR is therefore a direct way to control costs and enhance DevOps performance.
| Performance Category | Change Failure Rate (CFR) | Mean Time to Recovery (MTTR) | Stability Impact |
|---|---|---|---|
| Elite | 0%–15% | Less than 1 hour | High stability; maximum innovation time |
| High | 16%–30% | Less than 1 day | Strong stability; minimal disruption |
| Medium | 16%–30% | 1 day to 1 week | Moderate stability; frequent fixes needed |
| Low | 46%–60% | 1 week to 6+ months | Poor stability; significant business risk |
Hokstad Consulting uses CFR and MTTR improvements to design resilient CI/CD pipelines and automate recovery processes, reducing downtime and cutting unnecessary cloud expenses.
Comparison Table
Here’s a breakdown of how different metrics contribute to cloud cost management and DevOps efficiency. The table below outlines the focus areas, suitability, tracking complexity, and overall cost impact of each metric. It’s worth noting that priorities will vary depending on the business model - whether it’s a UK-based e-commerce platform preparing for peak trading seasons or a SaaS startup striving to keep infrastructure costs under 30% of CLTV.
| Metric | Primary Focus | Best Suited For | Tracking Ease | Cloud Cost Impact |
|---|---|---|---|---|
| Cost per Deployment | Efficiency in DevOps pipelines | SaaS / Fast-paced development teams | Moderate (requires CI/CD integration) | Preventative - identifies waste early |
| Cost per User/Transaction | Business value and unit economics | E-commerce / Fintech / SaaS | Hard (needs usage data and billing correlation) | Very high - ties spending directly to revenue |
| Infrastructure Utilisation & Rightsizing | Efficient use of cloud resources | All businesses, particularly infrastructure-heavy ones | Easy (native tools available) | High - reduces idle and overprovisioned resources |
| Deployment Frequency & Change Lead Time | Development speed | SaaS / Digital products | Easy (standard DORA metrics tools) | Indirect - faster cycles mean shorter environment runtimes |
| Change Failure Rate & MTTR | Reliability and recovery | E-commerce / Mission-critical services | Moderate (requires incident management data) | High - reduces costs from rework and emergency scaling |
For UK SMEs, Infrastructure Utilisation serves as the easiest entry point. Platforms like AWS, Azure, and Google Cloud offer built-in tools to track utilisation, making it a straightforward way to lower monthly costs.
Meanwhile, Cost per User or Transaction shines for SaaS and e-commerce businesses. Although it demands more advanced integrations, the insights it provides are invaluable - it’s the only metric that directly evaluates whether infrastructure spending aligns with the revenue it generates [31].
To improve cost tracking, enforce consistent tagging practices using tools like Terraform or CloudFormation. Additionally, converting multi-cloud expenses into GBP ensures better cost attribution. These foundational actions align with the metrics discussed, paving the way for streamlined cloud cost management and DevOps efficiency.
Conclusion
The metrics discussed above do more than just track performance - they serve as a roadmap for smarter cloud cost management. By focusing on efficiency, these metrics ensure that cloud infrastructure grows in a way that supports profitability, rather than just scaling with usage demands[4][32]. They help align technical decisions with broader business goals, turning cloud cost management into a refined, strategic process.
Cloud cost optimisation has the potential to cut expenses by 15–25% within the first two months, with savings climbing to as much as 40% through ongoing refinement[32]. The key to these results lies in consistently monitoring and acting on the metrics, rather than relying on last-minute reviews of monthly bills.
Integrating automated cost controls directly into CI/CD pipelines - using tools like Infracost - shifts cost management from a reactive chore to a proactive engineering practice[3]. When combined with enforced tagging through infrastructure-as-code, every pound spent becomes traceable and accountable.
Practical implementation is where theory meets results. Hokstad Consulting partners with UK businesses to put these frameworks into action. Their services range from cloud cost audits and rightsizing strategies to full-scale DevOps transformations with automated pipelines. Their focus? Cutting costs by 30–50% while enhancing deployment speed and reliability. For companies hesitant to commit, their No Savings, No Fee model eliminates financial risk, as fees are tied to the actual savings achieved.
To truly optimise cloud costs and maintain efficient DevOps performance, businesses must treat cost and performance reviews with the same priority as uptime and latency metrics[3][5]. Regularly revisiting and automating these practices ensures long-term success in cloud cost management.
FAQs
How do I calculate cost per deployment accurately?
To determine the cost per deployment, simply divide your total infrastructure expenses by the number of deployments within a specific timeframe. For more precise tracking, Hokstad Consulting recommends tagging resources with unique deployment IDs during provisioning, which can be done through Infrastructure as Code templates. Then, use tools like AWS Cost Explorer to query your cloud provider’s cost data using these tags. Finally, visualise the results on a dashboard to track trends and identify potential inefficiencies.
What’s the best way to measure cost per user or transaction without using personal data?
To calculate cost per user or transaction without relying on personal data, you can turn to infrastructure-based unit economics. This involves assigning cloud costs to specific services, features, or product lines using an effective tagging system. In multi-tenant environments, costs can be distributed proportionally based on overall usage metrics, such as total requests. By dividing the total service costs by measurable business outcomes, like the number of transactions processed, you can create an efficiency metric that scales - without needing to track individual users.
Which metric should we start with to get quick cloud savings?
To start saving on cloud costs right away, the first step is to calculate your total monthly cloud expenditure. Break it down by provider, account, and project to get a detailed picture of where your money is going. Once you have this baseline, you can pinpoint areas of waste, such as idle servers or instances that are larger than necessary. This clear snapshot of your spending allows you to tackle inefficiencies effectively and sets the stage for deeper cost optimisation efforts.