
Most teams should not rely on one forecast model. If your cloud spend is steady, use a trend model. If it follows repeat cycles, add seasonality. If cost jumps come from launches or campaigns, use release-based scenarios. And if several signals move spend at once, use AI.
Cloud overspend is common: 69% of organisations went over budget in 2023, and about 28% of public cloud spend is wasted each year. So the first thing I’d look at is not the model. It’s your error limit. If finance can live with ±15% on £100,000, that means a working range of £85,000 to £115,000. If the limit is ±5–10%, you’ll need tighter data and a stronger setup.
Here’s the short version:
- Trend-based forecasting fits steady SaaS spend and often lands around ±5–10%
- Seasonality-aware forecasting fits repeat peaks like retail cycles and often targets MAPE below 15%
- Release-driven forecasting fits roadmap-led cost changes, with about ±10–20% error for repeat release types
- AI-based forecasting fits mixed, fast-changing signals, with about ±6–10% over 30 days and ±10–20% over 3–6 months
Use these inputs to choose:
- billing history
- live usage data
- release plans
- campaign calendars
- business drivers like users, orders, or sessions
The trade-off is simple: plain models are easier to run, but they drift when spend changes fast. More advanced models can cut forecast error, but they need cleaner data, more checks, and more team input.
::: @figure 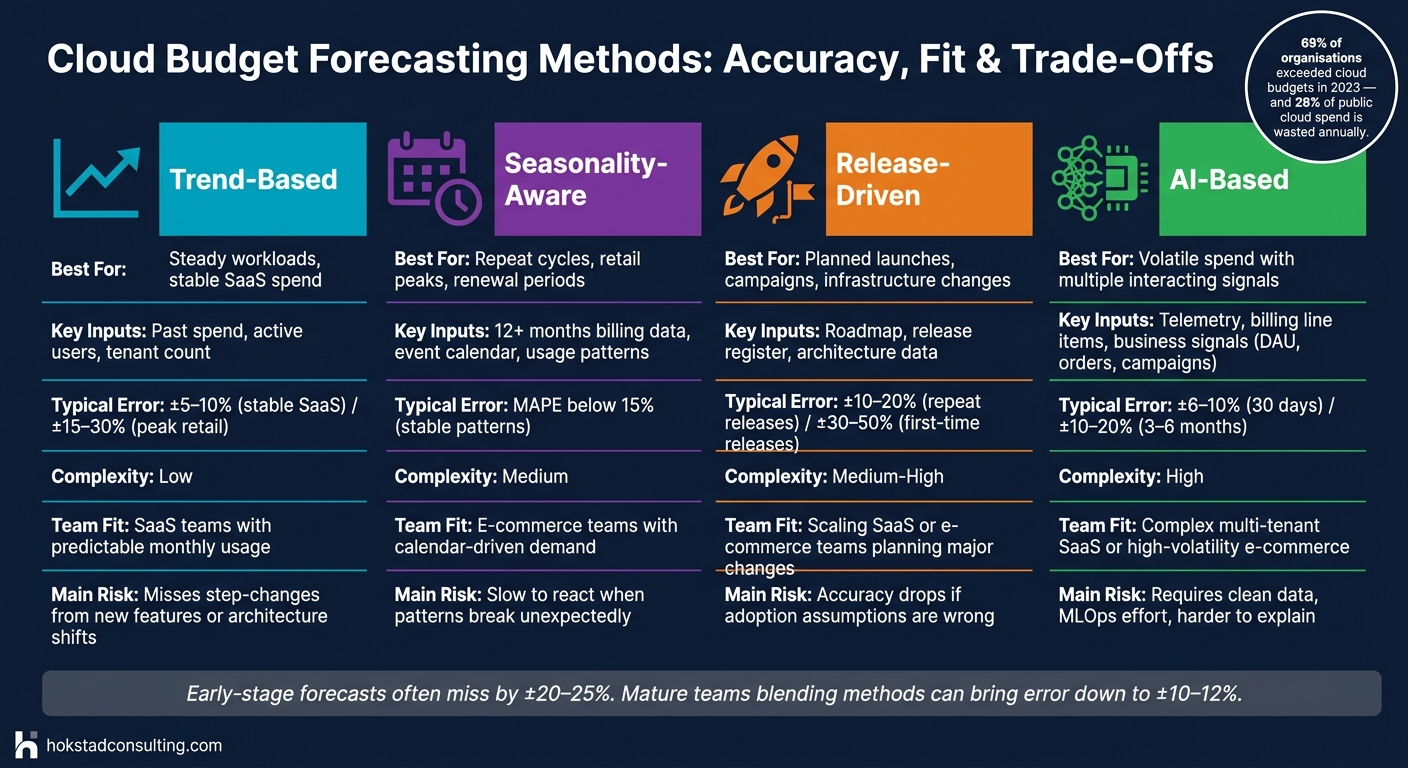 {Cloud Budget Forecasting Methods: Accuracy, Fit & Trade-Offs}
:::
{Cloud Budget Forecasting Methods: Accuracy, Fit & Trade-Offs}
:::
Cloud Cost Forecasting | Forecasting Cloud Spend and Usage | Flexera
Quick Comparison
| Method | Best for | Main inputs | Typical error |
|---|---|---|---|
| Trend-based | Steady workloads | Past spend, user or order growth | ±5–10% for stable SaaS; ±15–30% in peak retail periods |
| Seasonality-aware | Repeat cycles | Daily/weekly spend, event calendar, usage patterns | Often MAPE below 15% when patterns are stable |
| Release-driven | Launches and planned change | Roadmap, release register, architecture data | ±10–20% for repeat releases; ±30–50% for first-time releases |
| AI-based | Volatile spend with many inputs | Telemetry, billing line items, business signals | ±6–10% for 30 days; ±10–20% for 3–6 months |
If I had to sum up the article in one line, it would be this: use the simplest mix of models that keeps your forecast inside the range your team can act on.
1. Trend-Based Forecasting
Trend-based forecasting uses past cloud spend to estimate what comes next. Most teams look at 12–18 months of clean billing data, smooth out one-off spikes, and then extend that trend forward. It works best as a baseline for spend patterns that don't swing too much.
Data inputs
Start with monthly cloud spend by service category such as compute, storage, networking, and managed databases. Commitment costs should already be amortised into those figures.[8][4]
You get a better forecast when you add usage drivers too. For SaaS, that might be active users or tenant count. For e-commerce, it could be orders or site sessions.[3][9] This matters because it links cloud cost to business activity. Instead of treating spend like a stand-alone budget line, you can tie it back to the sales forecast and see how growth is likely to affect infrastructure cost.
Responsiveness to change
The weak spot here is lag. If a product launch lands, traffic jumps, or the team changes infrastructure, spend can drift away from the forecast pretty fast.[7]
A simple way to tighten this up is to use a rolling 3–6 month window and give more weight to recent data than to older months. It also helps to pair the forecast with real-time usage alerts so any drift shows up early, not at month-end.[4][5] If your business has peaks that come back again and again, this approach on its own usually isn't enough.
Margin of error
This model is only useful if its error stays inside the team's planning range. For stable SaaS workloads with good tagging and clean data, monthly error often sits around ±5–10%. In e-commerce, where demand can move with campaigns and promotions, error can stretch to ±15–30% during peak periods if you don't adjust for seasonality.[6]
Fit for SaaS vs e-commerce teams
| Factor | SaaS teams | E-commerce teams |
|---|---|---|
| Core use | Core forecasting tool for steady workloads | Baseline forecast that needs event-based overlays |
| Anchor metric | Active users or tenant count | Orders per day or site sessions |
| Typical error | ±5–10% monthly | ±15–30% during peak periods |
| Main risk | Missing step-changes from new features or releases | Underestimating seasonal spikes |
For SaaS teams, trend-based forecasting can do most of the heavy lifting when growth is fairly steady. For e-commerce teams, it's better used as the baseline, with separate uplift factors for events like Black Friday or end-of-season sales.[1][10] If those peaks show up on a calendar rhythm, a seasonality-aware model is the next move.
2. Seasonality-Aware Forecasting
Where trend-based forecasting draws a line through past data, seasonality-aware forecasting looks for repeating patterns in spend and models them on purpose. Instead of ironing out those regular peaks, it builds them in. That means your budget is based on patterns you already know tend to show up. The main question is simple: how well does the model respond when those patterns stop behaving as expected?
Data inputs
You need at least 12 months of billing and usage data, broken down by day or week, to spot annual patterns with enough confidence.[12][13][14] For shorter cycles, like weekday versus weekend demand or business-hours spikes, 60–90 days of clean, tagged data is often enough.[11]
Raw spend data helps, but it shouldn't work alone. It also helps to bring in:
- deployment calendars
- marketing dates
- business-event dates
An events calendar can make a big difference here. Dates like Black Friday, month-end processing runs and quarterly reporting cycles help the forecast tell the difference between repeat seasonality and planned events.[11][2] Live usage data should then be checked against the seasonal pattern each week.
Responsiveness to change
This method has a clear weak spot: responsiveness. It works best when patterns repeat in a steady way, but it can react slowly when that rhythm gets thrown off. A pricing change, a shift in customer behaviour or an architecture change can all do that.
Because the model depends on repeated patterns, it needs to be re-fitted monthly or quarterly and used alongside real-time alerts.[11]
Margin of error
When recurring cycles are strong and the data is clean, seasonality-aware models usually beat a plain trend forecast. FinOps teams often target mean absolute percentage error (MAPE) below 15% for medium-term cloud cost forecasts with this method.[11]
That said, the error grows when campaign noise, missing data or irregular spikes get mixed into the baseline. Peak events such as Black Friday should be handled as separate budget scenarios, not folded into the seasonal baseline.[15]
Fit for SaaS vs e-commerce teams
| Factor | SaaS teams | E-commerce teams |
|---|---|---|
| Core use | Weekday load, month-end closes, renewal periods | Recurring retail cycles with separate event overrides |
| Typical seasonal trigger | Office-hours peaks, month-end processing, renewal windows | Retail calendar events, promotional periods, end-of-season sales |
| Forecast shape | Often fairly tight when cycles are stable | Usually wider when promotions are folded into the baseline |
| Main risk | Missing pattern breaks from architecture or pricing changes | Treating promotional spikes as recurring seasonality |
For SaaS teams, this approach works well when demand follows clear operating rhythms, like office hours, month-end closes or renewal periods. For e-commerce teams, it tends to work best as a base layer, with separate traffic multipliers added for known retail events.
If demand moves more around launches than seasons, release-driven forecasting is the better fit.
3. Release-Driven Demand Forecasting
Release-driven forecasting ties your forecast to the roadmap, then checks it against what past releases did to spend. In practice, each planned release, infrastructure change, or marketing campaign becomes a forecast input. You model the cost effect before it lands, not after. That makes this method a good fit when spend shifts come from known events instead of slow, steady growth.
Data inputs
Use roadmap data plus the historical impact of similar releases to estimate the change in traffic, storage, or compute for each planned event. Keep releases in a shared release register that includes:
- release date
- affected services
- expected usage change
- estimated monthly cost uplift (£)
You also need the current architecture details: instance types, autoscaling rules, reserved capacity, and any committed use discounts. Miss those out and the estimate turns into little more than guesswork.
Responsiveness to change
This is where release-driven forecasting stands out from trend and seasonality methods. Because the forecast is linked to specific events, you can update it the moment scope shifts. After each release, compare the forecast with actual spend, then feed that gap into the next estimate.
Use this method when the event is known. Use AI when the pattern is too volatile to map by hand.
Margin of error
Accuracy depends a lot on how well the release is understood. For repeatable release types - such as a quarterly feature bundle or a similar promotional push - teams usually see forecast error of about ±10–20% on incremental cloud spend when they have solid historical data behind them. For first-time releases, like launching an AI-powered feature or entering a new geographical market, that error can widen to ±30–50%.[16][17]
Accuracy is strongest when the release has a close historical analogue.
Fit for SaaS vs e-commerce teams
| Factor | SaaS teams | E-commerce teams |
|---|---|---|
| Primary use | Capacity planning around platform changes | Event-driven spike planning |
| Key release types | Multi-tenant expansions, API changes, multi-region resilience | Marketing pushes, site redesigns, new payment or fraud systems |
| Main benefit | Predicting baseline cost shifts that affect subscription margins | Handling traffic spikes without overspending |
| Biggest risk | Underestimating new AI or data-intensive workloads | Treating campaign traffic as predictable when it can vary sharply |
For SaaS teams, this method works best around major platform changes where the cost effect is large enough that it needs to be weighed against SLA commitments. For e-commerce teams, it tends to matter most when working closely with marketing - turning campaign expectations into traffic and cost estimates.
When releases come thick and fast, overlap each other, or are hard to price by hand, AI-based forecasting is the next move.
4. AI-Based Forecasting
Use AI when cloud spend moves because of several signals at the same time. In these cases, one trend line, one seasonal pattern, or one product release rarely tells the whole story.
AI-based forecasting pulls together usage data, billing data and business signals to spot cost patterns that simpler models miss. Machine learning models such as gradient boosting, random forests and neural networks can look at many inputs at once. That means they can pick up links that rule-based models often miss.
For example, a model might learn that costs jump when request volume rises and cache miss rate goes up at the same time. Or it might spot that a certain feature flag tends to trigger a sudden increase in database spend.
Data inputs
Good AI forecasting usually relies on three layers of data:
- Technical telemetry: CPU and memory utilisation, container replica counts, autoscaling events and network bandwidth
- Billing data: detailed cloud provider line items, shown in GBP with consistent FX rates applied
- Business context: daily active users, orders placed, marketing spend, campaign identifiers, feature flags and release dates
Business context often explains the biggest cost swings. A £50,000 Q4 marketing campaign can hit cloud costs very differently from organic growth of a similar size.
Responsiveness to change
AI models can be updated often as new data comes in, instead of waiting for a monthly review. That matters when cost behaviour changes fast.
A common setup looks like this:
- Use shift detection to flag sudden changes
- Retrain the model when cost behaviour changes
- Version models in CI/CD
- Train on new data
- Track forecast error on a dashboard
Margin of error
Short-term AI forecasts can get to low single-digit error when the environment is stable. For 30 days, ±6–10% is a sensible range. For 3–6 months, ±10–20% is a more honest estimate.
For UK stakeholders, it helps to show the range in pounds, not just percentages. A note like Q4 forecast: £120,000 ± £12,000 is much easier to act on than a percentage by itself.[18][19][20]
Fit for SaaS vs e-commerce teams
| Factor | SaaS teams | E-commerce teams |
|---|---|---|
| Key inputs | Active seats, API calls, feature usage and contract renewals | Daily orders, basket size, ad impressions, discount codes and UK seasonal markers |
| What the model learns | How subscription metrics drive compute, memory, database load and network usage | Sharp peaks and troughs linked to campaigns, promotions and seasonal demand |
| Primary use case | Per-customer margin analysis and capacity planning for enterprise deals | Preparing for traffic spikes and managing CDN and search costs around promotions |
E-commerce teams often need models that can handle sharp, non-linear spikes. SaaS teams usually care more about tracking cost per customer as usage and subscriptions change.
The trade-off is simple: you often get better accuracy, but you also take on more data work, more upkeep and less transparency.
Strengths and Trade-Offs by Team Type
All four methods use live usage data, but they don't treat that data in the same way. That's the bit that matters.
The best fit depends on your spend pattern:
- Trend-based works best for stable workloads
- Seasonality-aware suits repeatable peaks
- Release-driven fits roadmap-linked change
- AI-based is better for volatile setups with several moving signals
The table below compares accuracy, upkeep and team fit at a glance.
| Method | Pros | Cons | Most suitable team context |
|---|---|---|---|
| Trend-Based | Quick to set up using existing billing exports; transparent enough for finance to explain in board packs; reliable for steady day-to-day spend | Undershoots during Black Friday, Boxing Day sales or flash promotions; breaks down after architectural changes such as a move to serverless | SaaS teams with steady subscription growth and predictable monthly usage |
| Seasonality-Aware | Handles known UK retail peaks and payday effects well; supports temporary budget uplifts for known peaks | Needs at least 12–24 months of tagged historical data; cannot anticipate novel campaigns or unexpected external shocks | E-commerce teams with strong calendar-driven demand patterns |
| Release-Driven | Ties cloud spend directly to the product roadmap; improves collaboration between product, engineering and finance | Relies on accurate adoption assumptions; forecasts date quickly if marketing delays a campaign or a feature sees only 20–30% of expected uptake | Scaling SaaS teams onboarding large enterprise clients, or e-commerce teams planning major site changes |
| AI-Based | Handles multiple interacting signals at once; adapts as new data arrives; provides probabilistic ranges rather than single-point estimates | Requires clean, granular data and ongoing MLOps effort; harder to explain than simpler models; can be overkill for smaller teams with relatively low cloud spend | Complex multi-tenant SaaS platforms and e-commerce businesses where spend is volatile and driven by many variables simultaneously |
The main difference isn't just forecast accuracy. It's also the amount of cross-team work each method demands.
Some approaches need only light input from finance. Others depend on close coordination across finance, engineering and product. So the right choice comes down to a simple question: how much shared effort can your team support without slowing everything else down?
Simpler methods are easier to run and easier to explain. More advanced methods cut forecast error only when the data is clean and the operating process is in good shape.
Conclusion
Use a portfolio: trend for baseline spend, seasonality for repeat cycles, release-driven scenarios for planned change, and AI when data quality and volatility justify it.
The right mix comes down to three things: volatility, data quality, and how much error your team can live with. The strongest real-time forecasts usually combine at least two methods, then update them with live billing data. Early-stage forecasts often miss by ±20–25%. More mature teams that blend methods can bring that down to ±10–12%.[21]
In practice, the best forecast is the one your finance and engineering teams can review and act on without delay. Keep it as simple as possible while staying inside your planning range. For stable services, that often means trend-based forecasting with a monthly review. For more volatile platforms, it usually means richer models and weekly or daily recalibration.
Where AI, DevOps and cloud cost engineering need to work together at scale, Hokstad Consulting can help align strategy, implementation and automation.
FAQs
How do I choose the right forecasting method for my cloud spend?
Choose your approach based on workload stability, business maturity, and goals.
In stable, predictable environments, trend-based models such as ARIMA give you a solid baseline from past data. They work well when patterns don’t shift much from one period to the next.
If usage moves around because of product launches, scaling, or swings in demand, driver-based forecasting is often the better choice. It links forecasts to the factors that actually push usage up or down.
For more complex or fast-changing environments, AI-driven methods can spot non-linear patterns and seasonality more effectively. In many cases, a hybrid approach gives the best mix of accuracy and agility.
What data do I need for real-time cloud budget forecasting?
You need live billing and usage data from your cloud providers, plus 12–18 months of past records to spot trends and seasonality.
Key inputs include:
- usage data and cost-driver metrics
- normalised billing data, including amortised costs and tags
- business events, such as bank holidays or launches
- consistent metadata, including time zones, regional pricing, and GBP reporting
Without that mix, it’s hard to see what’s normal, what’s changed, and what’s likely to happen next.
When is AI forecasting worth the extra effort?
AI forecasting is worth the extra effort in fast-moving settings like e-commerce, fintech, and media streaming, where demand can swing hard and old-school manual models or simple trend lines just can’t keep pace.
It works best when the picture is messy: lots of variables, seasonal peaks, and sudden market moves all happening at once. In that kind of setup, AI can sharpen forecast accuracy, cut forecast variance from 40–60% to around 10%, and help avoid budget overruns with proactive, real-time cost optimisation.