
If I had to boil this down to one point, it’s this: observability in microservices works when I standardise telemetry early, alert on user impact, trace the most important paths, and keep data volume under control.
In plain terms, I need logs, metrics, and traces to work together. That means using the same IDs and field names across services, building alerts from SLOs and error-budget burn, and focusing tracing on paths like checkout, login, APIs, and async jobs. It also means watching cost: retention, sampling, and label discipline can stop telemetry spend from climbing as traffic grows.
If I were putting this into action today, I’d focus on:
- One telemetry standard for every service
- Structured JSON logs with
trace_id,span_id, andcorrelation_id - Golden-signal metrics: latency, traffic, errors, saturation
- SLO-based alerts tied to what users feel
- Distributed tracing on the flows that hit revenue and support load
- Short hot retention and sampling rules to limit storage cost
- Dashboards and runbooks built around services and user journeys
- Release checks for canaries and post-incident updates
A few figures stand out. Trace-led root-cause work can cut time to find the cause by 60–78%. Keeping high-detail traces for only 3–7 days, access logs for 7–14 days, and audit logs for 30–90 days can help control spend. And cutting log retention from 90 days to 30 days may trim storage bills by 30–50%, depending on volume.
I’d treat observability as a team practice, not just a tool choice. Tools matter, but shared rules matter more.
Core best practices to put in place first
Standardise telemetry across every service
As your service count grows, telemetry needs to be standardised early. If you skip that step, each team will end up with its own schema, and comparing data across services becomes messy fast.
Set a versioned telemetry contract before you instrument services. That contract should cover log format, required fields, metric label rules, and trace propagation. Then roll out a shared logging library or middleware for each language so every service follows the same rules, no matter which team owns it.
Every structured JSON log should include:
-
timestamp -
level -
service_name -
environment -
correlation_id -
trace_id -
span_id -
message
For HTTP services, logs should also include method, path, status code, and latency. Generate correlation IDs at the edge - usually the API gateway or ingress - and pass them downstream in a header such as X-Correlation-ID.
Use OpenTelemetry to standardise resource attributes, trace context, and auto-instrumentation across mixed-language services. Define service names and metric names in one central place, then enforce them in CI templates.
Once every service emits the same fields and identifiers, alerts and traces become much easier to compare across the estate.
Design metrics and alerts around user impact
Alert on user impact, not on noisy infrastructure signals. The four golden signals - latency, traffic, errors and saturation - are the best place to start.
For an e-commerce checkout, that means tracking p95 and p99 response time from Place Order to confirmation, the share of successful checkout attempts, requests per second at the checkout API, and database pool usage on the orders service.
| Signal | Key indicator | Example alert threshold |
|---|---|---|
| Latency | p95 checkout response time | p95 > baseline for 10 minutes |
| Traffic | Requests per second | 50% drop versus recent baseline |
| Errors | Checkout success rate | Below 99.5% target |
| Saturation | Database pool usage | Sustained near-capacity usage |
Write SLOs in user terms. For example: 99.5% of checkout requests complete successfully in a rolling 30-day window.
Then use error-budget burn-rate alerting. In plain English, alert when you're burning through a day's error budget in an hour, not when one stray data point jumps over a line. That gives you fewer pages, better signal, and a clearer view of business impact from the start.
Tracing then helps explain why the slowdown happened and which service or dependency caused it.
Use distributed tracing for critical request paths
Don't try to trace everything on day one. Start with the request paths where failure or delay hits hardest: checkout flows, authentication, public API gateways and background jobs that fan out across many services.
Research on trace-based root-cause analysis found it reduced mean time to identify the root cause by 60–78% compared with manual investigation.[1] That sort of gain comes from seeing where time is spent across service boundaries, not just inside one service at a time.
Name spans after business operations, not HTTP primitives. CheckoutService.AuthorisePayment tells you far more than a generic http.post. Add span attributes such as http_status_code, db_statement_type, and queue_name, but avoid high-cardinality values like raw user IDs.
Also link traces back to logs by including trace_id and span_id in every log line. That way, an engineer can jump from a slow span straight to the matching log entries without bouncing between tools.
For high-throughput systems, use tail-based sampling. During peak periods, increase sampling on revenue-critical flows. Keep full traces for 3–7 days, then store aggregate statistics for longer. It's a simple way to keep storage spend under control without losing the data you need for diagnosis.
With the core signals aligned, the next step is to control telemetry volume before costs rise with traffic.
Need help optimizing your cloud costs?
Get expert advice on how to reduce your cloud expenses without sacrificing performance.
Patterns that keep observability useful at scale
Control telemetry volume, retention and cost
As traffic grows, observability costs can get out of hand fast, and trace storage is often where the pain shows up first. The fix isn’t to collect less blindly. It’s to collect smarter. Set a sampling policy that gives more weight to errors, slow requests, and revenue-critical paths. That way, the data you keep is the data you’re most likely to need when something goes wrong.
For logs, keep access logs for 7–14 days, but hold onto security and audit logs for 30–90 days. For metrics, keep high-resolution data at 15-second intervals for two weeks, then downsample it into 5-minute roll-ups for longer-term history [8][9].
Tiered storage helps keep this under control without throwing away the long view:
| Storage tier | Retention | Typical use |
|---|---|---|
| Hot | 7–14 days | Incidents |
| Warm | 30–90 days | Trends and SLOs |
| Cold | 1+ years | Audit and archive |
Metric labels also need discipline. Keep them stable. Don’t use user IDs, raw URLs, or other fast-changing values. Use route templates and bucketed values instead. If you don’t, the number of distinct time series can blow up, which makes storage and queries far more expensive.
Cost control only helps if teams can still get answers without digging for ages. Once telemetry is under control, the next step is to package it into service-level views that people can use straight away.
Build dashboards, alerts and runbooks around services
Each microservice should have one main dashboard built around the four golden signals: request rate, error ratio, p95/p99 latency and resource saturation, such as CPU, memory and pod restarts. Build these views around services and user journeys, not infrastructure nodes. The goal is simple: someone should be able to look at the dashboard and understand service health in seconds.
Alerts should follow SLOs, not raw thresholds. So instead of paging a team because CPU hit 80%, page them when the error budget is burning down too fast. A solid rule of thumb is a fast-burn warning when 2% of the monthly error budget is used in one hour, and a slow-burn ticket when 5% is consumed over six hours [2][3]. That cuts noise and keeps alerts tied to what users are feeling.
Every alert should point straight to a runbook. That runbook should name the alert, show the first checks, and spell out the safe mitigation step. It also needs a clear point for escalation - for example, if the error rate goes above 10% for more than 30 minutes. Runbooks only stay useful if teams keep updating them after incidents. If that stops, they tend to gather dust.
Those same views should feed directly into rollout decisions and incident reviews.
Embed observability into deployments and incident reviews
Good observability doesn’t stop at spotting faults. It also helps teams make safer release decisions and learn more from each incident. In practice, the same signals used during incidents should also guide deployments.
For canary releases, send 5–10% of traffic to the new version and compare its error ratio and p99 latency with the baseline. If the canary crosses SLO thresholds within a set window, automated rules should stop the rollout and mark the alert as deployment-related. For blue–green deployments, version-specific dashboard panels help teams check that the new environment matches or beats the old one before traffic is switched [4][5].
Post-incident reviews are where observability often delivers its biggest long-term payoff. Use logs, metrics, and traces to rebuild the exact chain of events: when symptoms first showed up, how they spread between services, when alerts fired, and what slowed the response. Then use that review to update thresholds, instrumentation, and runbooks. Over time, this starts to show recurring patterns: noisy alerts that keep wasting time, tracing blind spots, or capacity limits that get hit again and again. Those become the next targets for improvement [6][7].
Technology stack and architecture choices
Logging, metrics and tracing components
The right stack turns standardised telemetry into searchable logs, usable metrics and actionable traces. For most microservices setups, five parts need to work together:
- centralised logging
- time-series metrics
- distributed tracing
- dashboards
- alert routing
A common open-source setup looks like this: Prometheus for metrics, Grafana for dashboards, ELK or Loki for log aggregation, Jaeger or Zipkin for tracing, and Prometheus Alertmanager or Grafana Alerting for notification routing. OpenTelemetry collectors standardise how telemetry leaves each service.
But tools alone don't fix anything. The stack only works well when the same labels and IDs are enforced everywhere.
Choose ELK when deep log search matters most. Choose Loki when lower-cost retention matters more. Put simply: ELK is the better fit for full-text search, while Loki is often the better fit when you want to keep logs for longer without pushing storage spend too high.
For tracing, Jaeger is often the stronger option for larger production microservices estates. It supports direct OpenTelemetry input and works well with Grafana.[10][11][13] Zipkin is lighter and simpler to deploy, but it tends to fit smaller systems better.[12] A sensible approach is to instrument once with OpenTelemetry, then route telemetry to whichever backend suits your setup.
Keep trace IDs, service names and environment labels consistent across logs, metrics and traces. If those drift, correlation becomes messy fast.
| Stack component | Common choice | Primary role |
|---|---|---|
| Metrics collection | Prometheus | Time-series scraping and alerting |
| Dashboards and alerting | Grafana | Visualisation and trend analysis |
| Log aggregation (search-heavy) | ELK (Elasticsearch, Logstash, Kibana) | Full-text log search and analytics |
| Log aggregation (cost-focused) | Grafana Loki | Label-indexed, object-storage-backed logs |
| Distributed tracing | Jaeger | Trace collection, storage and querying |
| Instrumentation standard | OpenTelemetry | Vendor-neutral telemetry emission |
Kubernetes and service mesh observability
Kubernetes gives you a clean way to add the same context to all telemetry. In practice, three label types work well:
- environment labels, such as
env=production - ownership labels, such as
team=payments - standard Kubernetes application labels, such as
app.kubernetes.io/versionandapp.kubernetes.io/part-of[14][15]
When Prometheus, logging agents like Fluent Bit, and your OTel collector all inherit these labels on their own, day-to-day work gets much simpler. Filtering in Grafana, searching in Loki or ELK, and routing alerts to the right team all become easier.
Namespaces add another layer of context. Segmenting workloads by environment and domain - for example, prod-payments or staging-core - makes incident scope visible at a glance in dashboards and log queries. In hybrid or multi-cluster estates that span on-premises infrastructure and public cloud regions, label taxonomies and namespace naming rules need to stay consistent across every cluster. If not, cross-cluster dashboards become unreliable and alert routing starts to fall apart.
Use a service mesh only when you need per-route metrics, zero-trust networking or traffic shaping. Mesh overhead differs quite a bit between options, so weigh that cost against the observability result you need: faster diagnosis, better request-path visibility and clearer incident scope. That kind of consistency keeps dashboards, alerts and traces lined up across clusters.
| Service mesh | Sidecar memory (per pod) | Complexity | Observability strengths |
|---|---|---|---|
| Istio (sidecar mode) | ~50 MB | High | Deep L7 visibility, rich traffic metrics |
| Istio (ambient mode) | No sidecar | Moderate | Reduced overhead, node-level proxy |
| Linkerd | ~10 MB | Low | Zero-config mTLS, lightweight metrics |
| Consul Connect | ~30 MB | Moderate | Hybrid and multi-cluster support |
Comparison tables
Use the tables below to pick the lightest stack that still supports your alerting and tracing workflows.
Logging stack categories
| Category | Representative tech | Scalability | Search capability | Storage cost (£/GB/month) | Operational overhead |
|---|---|---|---|---|---|
| Full-text indexing | ELK (Elasticsearch) | High | Excellent | £0.08–£0.40 | High |
| Label-indexed, object storage | Grafana Loki | Very high | Good | ~£0.02 | Low |
Tracing backends
| Backend | OpenTelemetry support | Sampling flexibility | Resource usage | Best suited for |
|---|---|---|---|---|
| Jaeger | Native OTLP | High | Moderate | Large microservices estates |
| Zipkin | Via exporters | Basic | Low | Small systems or learning |
Service mesh observability options
| Option | Complexity | Per-pod memory overhead | Performance impact | Key observability feature |
|---|---|---|---|---|
| Istio (sidecar) | High | ~50 MB | Moderate | Full L7 metrics and tracing |
| Istio (ambient) | Moderate | None | Low | Reduced overhead, no sidecar |
| Linkerd | Low | ~10 MB | Very low | Automatic golden-signal metrics |
| Consul Connect | Moderate | ~30 MB | Low–moderate | Hybrid and multi-cluster support |
For UK teams running hybrid estates, it often makes sense to run collectors locally and forward telemetry to regional backends. That helps support data-residency requirements while keeping telemetry flow predictable.
OpenTelemetry: Adding Observability to Any Microservices Environment, with Glenn Versweyveld
Conclusion: A practical observability roadmap for UK teams
::: @figure 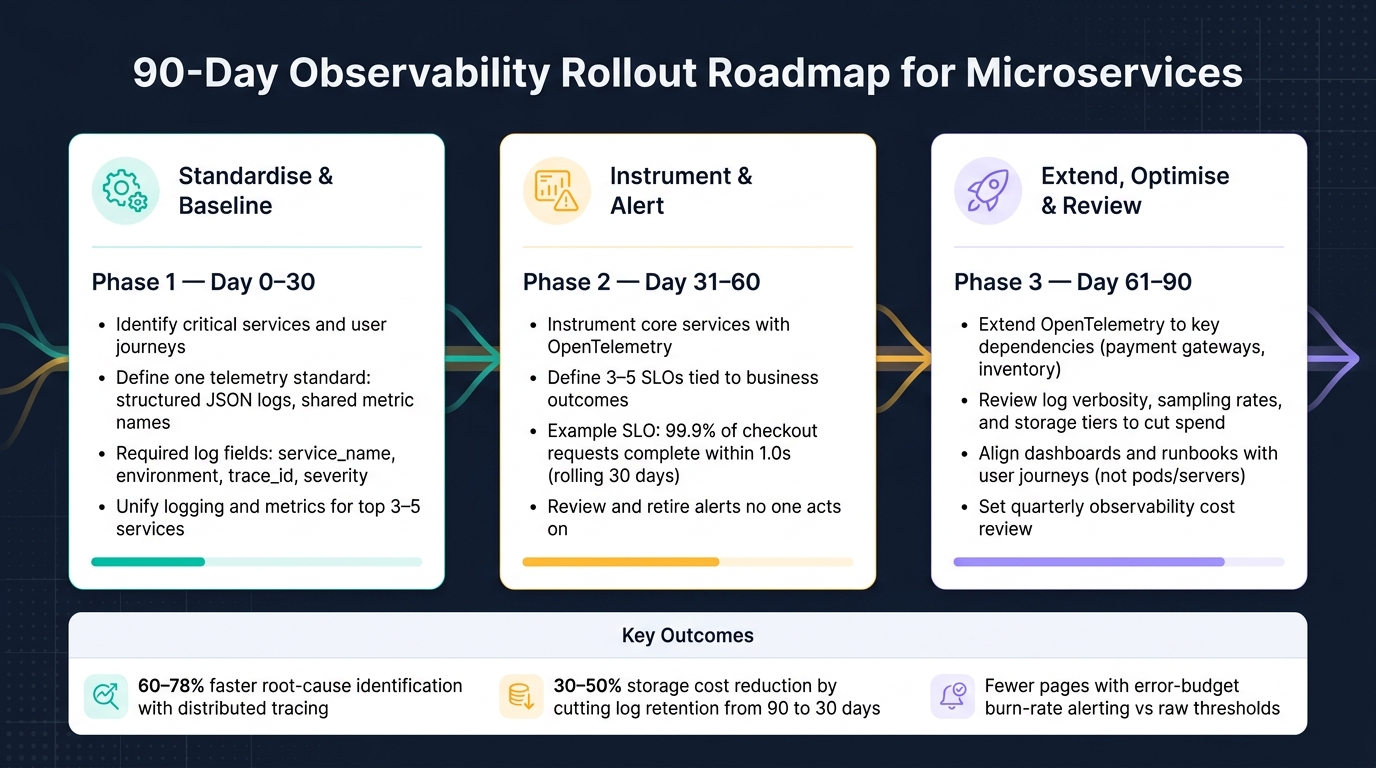 {90-Day Observability Rollout Roadmap for Microservices}
:::
{90-Day Observability Rollout Roadmap for Microservices}
:::
To put the earlier advice into action, use a 90-day rollout. Focus on four things: standardise telemetry, link alerts to user impact, trace the flows that matter most, and keep telemetry spend under control.
One mistake shows up again and again: treating observability as just a tooling issue. Tools matter, of course. But they matter far less than a shared way of working. If teams don’t agree on log formats, metric names, and correlation IDs across every service, even good platforms will flood you with noise instead of signal.
There’s a cost angle here too. Cutting log retention from 90 days to 30 days can reduce storage spend by 30–50%, depending on volume.[17] Shorter retention, tail-based sampling, and per-service sampling help keep costs predictable instead of letting them drift.
Teams that need support across hybrid estates can get help with observability design and cloud cost engineering from Hokstad Consulting.
Key steps for the next 90 days
Break the rollout into three clear phases.
By Day 30 - List your critical services and user journeys, then set one telemetry standard for the team: structured JSON logs, shared metric names, and required fields such as
service_name,environment,trace_id, andseverity. Bring logging and metrics together first for your top three to five services.By Day 60 - Instrument core services with OpenTelemetry on the user journeys that matter most. Define three to five SLOs tied straight to business outcomes. For example, 99.9% of checkout requests complete within 1.0 seconds over a rolling 30-day window.[16] After that, review alerts and retire or combine the ones no one acts on.
By Day 90 - Extend OpenTelemetry coverage to key dependencies like payment gateways and inventory services. Review log verbosity, sampling rates, and storage tiers to cut spend. Then line up dashboards and runbooks with user journeys, not pods or servers, and set a quarterly observability cost review so telemetry spend stays tied to business value.
FAQs
Where should I start with observability in microservices?
Start with your most critical services, especially the ones with high traffic or direct business impact. That lets you introduce tracing while keeping production risk as low as possible.
Use a standardised approach such as OpenTelemetry. Start with broad layers first, like API gateways, web frameworks, and RPC. Use auto-instrumentation where you can, then add manual instrumentation for the workflows that matter most, such as payments.
It helps to tie tracing, metrics, and logs together instead of treating them as separate streams. A simple way to do that is to use the RED method or the Four Golden Signals, so your team can spot issues faster and understand what’s going wrong without jumping between disconnected tools.
How do I reduce observability costs as services scale?
As services grow, keep observability spend under control by being more selective with data. Don’t collect everything just because you can. Use sampling for distributed traces, give priority to error states, remove duplicate metrics, and shorten retention periods so logs aren’t stored forever.
There’s also money to save on the infrastructure side. Trace data can help you spot resources that are oversized or barely doing any work. That might mean merging idle volumes or scaling down services with low utilisation. Hokstad Consulting specialises in these cost engineering strategies.
Which user journeys should I trace first?
Start with the paths that affect the most users, especially critical operations like logging in, searching, and checkout.
Then use trace clustering to spot the journeys people take most often, along with the paths that cause the most trouble. It also makes sense to focus on operations that involve database queries, external API calls, and internal service-to-service communication, because those are often where the biggest bottlenecks show up.