Want smoother CI/CD pipelines with fewer errors and faster deployments? Here's the key: monitor every stage - build, test, and deployment - to spot issues early and fix them fast.
Key takeaways:
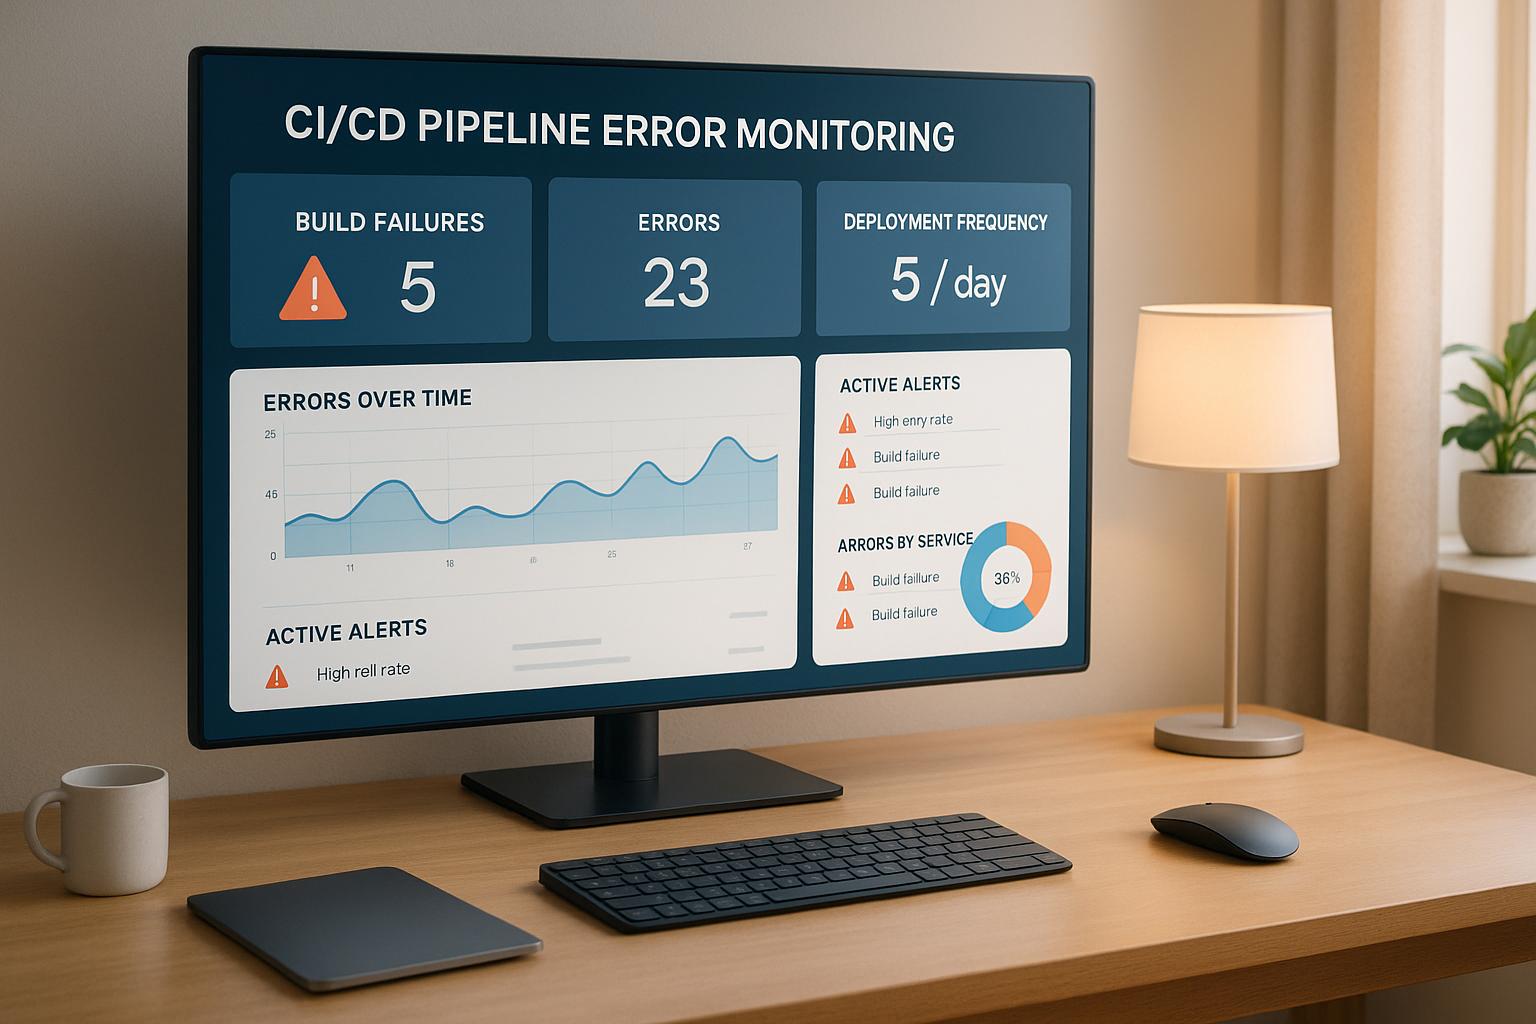
- Track critical metrics like build duration, test success rates, and deployment frequency.
- Use tools like Jenkins, GitHub Actions, and monitoring platforms (e.g., Datadog, New Relic) for real-time alerts and insights.
- Monitor infrastructure (CPU, memory, network) to avoid bottlenecks and resource failures.
- Implement early error detection methods like pre-commit hooks, automated tests, and static code analysis.
- Set performance baselines to identify regressions and optimise pipeline health.
Why it matters: Companies using robust monitoring report up to 90% fewer errors, 75% faster deployments, and significant reductions in downtime. Early detection saves time, reduces costs, and ensures reliable releases. Whether you're a startup or an enterprise, these practices can transform your software delivery process.
How Do You Monitor CI/CD Pipeline Performance Effectively? - Next LVL Programming
Key Metrics for CI/CD Pipeline Monitoring
Tracking the right metrics is crucial for effective CI/CD monitoring. Metrics like build duration, test success rates, commit-to-deploy time, deployment frequency, failure rate, and mean time to recovery (MTTR) form the backbone of pipeline analysis[4][3].
Each of these metrics provides insight into specific pipeline issues. For example, a sudden increase in build duration might point to resource bottlenecks or inefficient build scripts. A dip in test success rates could highlight problems with code quality or unstable dependencies. Monitoring commit-to-deploy time helps uncover delays in the delivery process, while deployment frequency can reveal obstacles that slow down regular releases[4][3].
To illustrate, one team discovered that a new dependency was significantly increasing build times. By optimising the build process, they restored normal performance and improved overall productivity. In another case, a failing test suite was blocking releases; fixing the issue allowed the team to resume a regular release schedule[2][4].
Performance Indicators for Pipeline Health
Now that the key metrics are established, let’s look at how they reflect the overall health of your pipeline.
- Build success rates: These should remain above 95%. A noticeable drop often signals issues with code quality or integration stability and requires immediate attention[5].
- Test pass rates: Healthy pipelines typically exceed 90%. A decline in this metric could foreshadow production problems, making it essential for early detection. Real-time monitoring helps teams identify flaky tests or environmental issues before they escalate.
- Deployment frequency: This should enable continuous releases. A low frequency might indicate automation gaps or process inefficiencies that slow down release cycles.
- MTTR (Mean Time to Recovery): This measures how quickly services are restored after a failure. Leading teams aim for recovery within an hour, reflecting strong monitoring and incident response practices. Longer recovery times often point to gaps in monitoring or unclear response procedures.
Tools like Site24x7 and New Relic make it easier to monitor these metrics. They provide real-time analytics and alerts, integrating seamlessly with CI/CD platforms such as Jenkins, GitHub Actions, GitLab CI, and CircleCI. These platforms ensure comprehensive data collection across your entire toolchain[5][6].
Performance Thresholds and Standards
Industry benchmarks offer clear targets for optimising pipeline performance.
- Build times: High-performing teams aim for builds under 5 minutes, though under 10 minutes is generally acceptable. Longer builds can hinder developer productivity and discourage frequent commits, ultimately affecting code quality.
- Test and deployment success rates: Both should exceed 95%. Frequent failures slow down delivery and increase the risk of production issues.
- Lead times: These should ideally be measured in hours, not days or weeks. Faster lead times improve responsiveness and adaptability[3][4][5].
Teams should establish a baseline for performance using historical data and monitor deviations to identify regressions early. For instance, if a new optimisation reduces build time on a development branch, comparing it to the main branch baseline can confirm the improvement[2][4]. Automated alerts can detect performance dips before they disrupt delivery schedules.
Research from Splunk reveals the impact of robust monitoring: over 90% of Fortune 100 companies use their observability platform, with half reporting faster time-to-market for new applications[6]. These findings underscore how proper metric tracking enhances software delivery and business agility[3][4].
When setting thresholds, it's important to balance industry standards with your organisation's specific needs. For example, a fintech company might enforce stricter test success rates due to regulatory requirements, while a startup might focus on faster deployment to gather market feedback. Regularly reviewing these thresholds ensures they align with changing business objectives and industry trends[4][3]. By maintaining these standards, teams can reduce failures, streamline recovery, and strengthen their CI/CD monitoring processes.
Infrastructure Requirements for Reliable Pipelines
The performance and reliability of your CI/CD pipeline are closely tied to the infrastructure it runs on. When build agents face memory shortages or network latency spikes, pipelines can slow down or even fail. Understanding the link between infrastructure health and pipeline performance can help teams avoid costly delays and keep delivery schedules consistent. This knowledge plays a crucial role in ensuring smooth and efficient deployments.
Infrastructure bottlenecks can bring the entire delivery process to a halt. For instance, a team using Jenkins encountered frequent build failures due to high memory usage on their build agents. By integrating Datadog for automated monitoring, they set up real-time alerts for memory usage thresholds. This allowed them to scale their infrastructure and balance job loads, ultimately reducing build failures and speeding up deployment cycles [4][7].
It’s essential to monitor all layers of infrastructure, including servers, containers, and cloud-native services. The complexity increases when pipelines span multiple environments or rely on hybrid cloud setups. Systematic monitoring ensures teams maintain visibility and control over their infrastructure.
Resource Usage and Performance Tracking
Monitoring key metrics like CPU usage, memory consumption, disk I/O, and network latency is critical for maintaining pipeline performance [4]. These metrics help identify bottlenecks early, enabling teams to resolve issues before they escalate.
For example, tracking CPU and memory usage can highlight overloads or out-of-memory errors, while monitoring disk I/O and network latency can uncover storage bottlenecks or connectivity problems. Establishing baselines for resource usage during different pipeline stages is equally important. By measuring average and peak usage, teams can set up alerts for when thresholds are breached. For instance, if build agents typically operate at 60% CPU usage during peak times, setting an alert at 85% provides an early warning before performance suffers.
Tools like Prometheus and Grafana are excellent for collecting and visualising metrics, while platforms like Datadog and Splunk Infrastructure Monitoring integrate seamlessly with CI/CD tools such as Jenkins, GitHub Actions, and GitLab CI. These solutions offer real-time alerts and historical trend analysis, helping teams stay ahead of potential problems.
Automated monitoring workflows can also track resource usage at each pipeline stage. For example, if test execution consistently consumes more memory than expected, it may signal oversized test datasets or memory leaks in the testing framework. This level of detail allows teams to focus on specific issues rather than broadly scaling infrastructure, making optimisation more effective.
Container and Kubernetes Monitoring
Containerised environments introduce additional complexity, requiring specialised monitoring practices. Metrics like pod CPU and memory usage, node resource allocation, cluster health, container restart counts, and scaling events are critical for ensuring pipeline stability [4].
Monitoring pod resources ensures that containers have enough CPU and memory to complete their tasks. Unlike traditional servers, containers can be terminated and rescheduled when resources are limited, which may disrupt pipeline progress. Tracking the gap between resource requests and actual usage helps teams fine-tune container specifications, reducing waste while maintaining performance.
Node-level monitoring focuses on the health of Kubernetes worker nodes that host pipeline workloads. Overloaded or failing nodes can lead to pod rescheduling, causing delays. Metrics like API server responsiveness and etcd performance provide a snapshot of cluster health, helping teams assess overall capacity and stability.
Frequent container restarts often signal resource constraints, application errors, or deeper infrastructure issues. Monitoring scaling events also helps evaluate whether autoscaling policies are meeting demand effectively. By correlating pod lifecycle metrics with pipeline performance, teams can pinpoint and resolve resource-related issues.
Setting appropriate resource limits and requests for pipeline containers is an ongoing process. Regularly reviewing historical usage data allows teams to adjust container configurations, ensuring efficient resource use without compromising the reliability of the pipeline.
Early Error Detection Methods
Spotting errors early in your CI/CD pipeline is a game-changer. It can save time, money, and resources by addressing issues before they spiral into bigger problems. When errors sneak into later stages, they become much harder - and costlier - to fix, potentially throwing your entire deployment schedule off track.
The idea is simple: catch issues as soon as possible. Doing so not only reduces debugging time but also ensures faulty code doesn’t disrupt your pipeline. Teams that prioritise early error detection often enjoy faster feedback loops and more dependable releases. Let’s explore how these methods can seamlessly integrate into your CI/CD workflow.
Modern CI/CD tools offer several checkpoints to identify issues early. From pre-commit hooks that intercept syntax errors before code even enters your repository, to automated tests that verify functionality right after integration, these measures act like safety nets throughout your development process.
Fail-Fast Approaches
Fail-fast strategies are all about stopping problematic code in its tracks. They focus on providing instant feedback, allowing developers to fix issues while they’re still fresh in their minds.
Pre-commit hooks are a great example. Tools like Husky and pre-commit run automated checks - such as linting, unit tests, and static code analysis - before any code is committed. This means errors are caught before they enter your main branch. For instance, adding an ESLint check to your pre-commit hooks can flag JavaScript syntax issues or style violations on the spot. Similarly, running unit tests at this stage ensures new code doesn’t accidentally break existing functionality.
Another critical checkpoint is automated unit testing during the early stages of CI. Platforms like Jenkins and GitHub Actions can execute comprehensive test suites right after code is pushed. If the tests fail, the build stops immediately, preventing unvalidated code from moving further down the pipeline.
Static code analysis tools, such as SonarQube, add yet another layer of defence. These tools analyse your code for vulnerabilities, code smells, and other maintainability issues before integration. By addressing these concerns early, you can avoid the snowball effect of technical debt.
Automating these checks ensures they’re consistently applied, regardless of deadlines or workload. This maintains high-quality standards across the board.
Detection Time and Cost Impact
The timing of error detection has a huge financial and operational impact. Studies show that fixing a bug becomes up to 10 times more expensive with each stage it advances through the pipeline [5].
The costs aren’t just financial. Late-stage issues take longer to debug, often involving multiple team members and more complex processes. In production, these errors can lead to emergency rollbacks, disrupt customer experience, and even hurt revenue.
Catching errors early also significantly improves Mean Time to Recovery (MTTR). Problems identified during development can often be resolved in mere hours, while production-level issues might take days to fix. This difference doesn’t just save money - it boosts team productivity and keeps customers happy.
Infrastructure costs also climb with delayed error detection. Failed builds that run too long waste CPU, memory, and storage resources. Early detection eliminates this waste. For example, Site24x7’s monitoring platform tracks build success rates and resource usage, helping teams identify and address inefficiencies [5].
Real-time alerting systems further reduce detection time. According to Splunk, 50% of users reported faster time-to-market for new apps thanks to real-time monitoring and alerts [6]. These systems notify teams immediately when something goes wrong - whether it’s a failed build, a test that didn’t pass, or a deployment issue - allowing for rapid response and resolution.
The benefits of early detection ripple through your entire workflow. Teams that catch errors early can deploy more frequently and with greater reliability, creating a positive cycle of quicker feature delivery and fewer setbacks. By tracking metrics like build success rates, deployment times, and error detection efficiency, teams can fine-tune their fail-fast strategies and continue improving over time.
Need help optimizing your cloud costs?
Get expert advice on how to reduce your cloud expenses without sacrificing performance.
Complete Pipeline Visibility
A complete view of your CI/CD pipeline tracks every stage, from the moment code is committed to when it’s deployed in production. It connects errors to infrastructure and application health, helping teams resolve issues faster.
Without this level of visibility, pinpointing the source of a failure - whether it’s a build issue, an infrastructure bottleneck, or an application error - can take hours. Modern CI/CD setups are incredibly intricate. They involve containerised apps, microservices, and cloud infrastructure, each generating its own metrics, logs, and traces. The real challenge is piecing together these scattered data points to form a clear picture of your pipeline’s performance. With that clarity, teams can quickly diagnose and fix problems, ensuring smoother deployments.
To achieve this kind of insight, distributed tracing is a game-changer.
Distributed Tracing for CI/CD Pipelines
Distributed tracing tracks requests as they move through the various stages of the pipeline and across infrastructure components. It uncovers the exact sequence of events that lead to failures - whether during the build, testing, or microservice operations.
In environments packed with microservices, distributed tracing is indispensable. Traditional monitoring might alert you that something’s wrong, but distributed tracing shows you exactly how it went wrong.
Take this example: one team discovered their deployments were often delayed because a specific test suite kept stalling. The root cause? A misconfigured database connection. With this insight, they fixed the configuration, slashing deployment times and boosting reliability.
When combined with monitoring tools, distributed tracing becomes even more powerful. Platforms like Splunk Observability Cloud, trusted by over 90% of Fortune 100 companies, offer real-time monitoring and observability [6]. Meanwhile, New Relic automatically correlates logs, errors, and traces to speed up root cause analysis. Their platform even includes 100 GB of free data ingestion per month [6]. Distributed tracing also shines when identifying performance bottlenecks, whether it’s a sluggish database query, network delays, or resource limitations.
Connecting Monitoring Layers
Integrating application performance monitoring with CI/CD tools creates a unified system for detecting and fixing errors. This connection lets teams link pipeline metrics - like build times or failure rates - with application health metrics, such as response times and error rates.
During incidents, this integration makes it easier to trace application errors back to specific pipeline changes. Instead of jumping between tools, teams get a single view that clearly shows what changed and how it impacted the application.
A good example of this approach is AppDynamics, which uses machine learning to provide instant root cause analysis across hybrid and multi-cloud environments. Modern observability platforms also standardise telemetry data, combining metrics, logs, and traces from every pipeline stage. Tools like Grafana are particularly popular for building unified dashboards that display pipeline metrics alongside application performance, infrastructure health, and even business data. This helps teams see the broader impact of pipeline changes.
Connected monitoring also reduces alert fatigue by delivering contextual alerts that tie pipeline issues to application problems, ensuring teams focus on the most critical events.
The benefits of connected monitoring are substantial. For instance, Splunk users reported cutting their time-to-market for new applications by 50% after adopting their monitoring and observability tools [6]. Faster issue resolution means more reliable deployments and quicker delivery of new features.
For organisations in the UK, full pipeline visibility isn’t just about smoother operations - it can also help cut costs. By identifying inefficiencies and reducing unnecessary cloud spending in GBP, businesses can increase deployment frequency while keeping budgets in check. This makes comprehensive monitoring a smart strategic investment, not just an operational tool.
Setting Baselines and Finding Regressions
Performance baselines are the cornerstone of effective CI/CD pipeline monitoring. They act as a reference point, helping you distinguish between one-off slow builds and patterns that may signal deeper issues. By establishing these benchmarks, you can catch potential problems early, long before they escalate into costly production delays. Think of baselines as the yardstick for measuring your pipeline's health and progress.
To set these baselines, start by collecting historical metrics from your CI/CD pipeline. Metrics you've already identified as critical - like build times or deployment success rates - serve as the foundation. For organisations in the UK, these baselines can also be key when justifying infrastructure investments or proving ROI, especially when expressed in pounds sterling.
One metric to pay particular attention to is Mean Time to Recovery (MTTR). This measures how quickly your team can resolve pipeline failures, which has a direct impact on both delivery speed and operational costs. A well-defined baseline for MTTR helps you spot any upward trends, which could indicate bottlenecks or inefficiencies that need addressing.
Other important metrics include code coverage and test execution times. Monitoring these ensures that while you're pushing for speed, you're not compromising on quality. And as your tools, infrastructure, or processes evolve, updating these baselines regularly ensures they remain relevant and useful.
Creating and Measuring Baselines
Building reliable baselines requires months of historical data from your CI/CD tools, whether you're using Jenkins, GitHub Actions, or another platform. Consistent tracking and analysis of metrics lay the groundwork for meaningful benchmarks.
For example, comparing average build times across different branches can highlight areas ripe for optimisation. You can also use industry standards to see how your pipeline measures up against similar organisations. This can give you a clearer picture of whether your performance aligns with your company's maturity level and goals.
Finding and Fixing Regressions
Once you've established baselines, they become your go-to tool for spotting regressions. By continuously comparing current metrics against these benchmarks, you can quickly identify when something's off. For instance, if build times suddenly spike or failure rates exceed historical averages, automated alerts can notify your team immediately.
Modern tools like Prometheus and Grafana offer real-time dashboards that make it easy to spot deviations. Similarly, platforms like Datadog and Splunk Observability Cloud can automate alerts when performance metrics fall outside acceptable ranges. These tools significantly reduce the need for manual monitoring, freeing up your team to focus on solving problems rather than chasing them.
Regressions often stem from issues like inefficient code changes, infrastructure limitations, or misconfigured pipeline jobs. Early detection is crucial - it allows you to investigate whether recent commits, infrastructure updates, or configuration tweaks are behind the performance drop.
Fixing regressions involves pinpointing the root cause. Sometimes the quickest solution is to revert a problematic change. Other times, you might need to optimise your pipeline, scale infrastructure, or tweak configurations. Whatever the case, having robust monitoring data ensures you can act with precision.
Regular triage sessions are another valuable practice. These meetings allow teams to review incidents, identify recurring problems, and refine development guidelines to prevent future issues. It's a proactive approach that promotes continuous improvement.
Machine learning is also making waves in regression detection. Advanced platforms like AppDynamics use AI-driven analytics to spot subtle performance changes that traditional monitoring might miss. For instance, these tools can reduce Mean Time to Resolution by up to 40% in complex enterprise environments, delivering substantial cost savings for UK organisations managing intricate CI/CD pipelines.
For those looking to refine their baseline management and regression detection processes, expert guidance can make all the difference. Hokstad Consulting, for example, specialises in creating tailored monitoring solutions. By leveraging historical data and industry benchmarks, they help businesses detect regressions early, speed up deployments, and cut operational costs - all while avoiding common pitfalls.
CI/CD Monitoring Implementation with Hokstad Consulting
Setting up effective CI/CD monitoring isn't a one-size-fits-all process. It requires a strategy tailored to your infrastructure, deployment patterns, and business objectives. Hokstad Consulting leverages its expertise in DevOps transformation and cloud cost management to design monitoring systems that not only improve visibility but also enhance deployment speed and reduce costs. Here's a closer look at their detailed implementation process.
The journey begins with a thorough assessment of your current pipeline and requirements, ensuring the monitoring solution aligns perfectly with your workflows, technology stack, and budget.
Custom Monitoring Solutions
Recognising that every organisation has unique needs, Hokstad Consulting develops monitoring systems customised to fit seamlessly into your existing CI/CD tools. They create bespoke dashboards that focus on the metrics that matter most to your operations.
For instance, platforms like Prometheus, Grafana, Datadog, and Splunk Observability Cloud are configured to integrate smoothly with deployment frameworks. Imagine a Grafana dashboard offering real-time insights into pipeline health during your release cycles, or Datadog alerts that notify you when build failure rates exceed acceptable levels. These tools are fine-tuned to provide actionable insights.
Hokstad Consulting also incorporates Observability as Code (OaC) into their solutions. By embedding monitoring directly into pipelines, they minimise manual effort and enable automated, code-driven monitoring. This results in faster feedback loops and a more efficient workflow.
Their approach goes beyond surface metrics, correlating CI/CD data with application telemetry. This makes it easier to pinpoint whether an issue stems from code changes, infrastructure limitations, or deployment mechanics. By reducing investigation time and improving troubleshooting precision, this method supports proactive error detection and recovery, keeping your teams ahead of potential problems.
Improving Deployment Speed and Reducing Costs
Hokstad Consulting stands out by addressing two critical areas: deployment speed and cost efficiency. Their strategies include fail-fast methodologies, automated testing, and parallel job execution, all designed to speed up deployments without compromising reliability.
For example, one client saw deployment times drop by 40% and monthly cloud expenses reduced by 25%. These results not only improved productivity but also demonstrated how faster deployments and cost savings can go hand in hand.
Their monitoring solutions dive deep into pipeline metrics like job duration, queue times, and failure rates. These insights directly impact monthly CI costs and infrastructure provisioning. Teams can analyse average, median, p50, and p95 durations across branches and providers to determine the most economical configurations for their workloads.
For Kubernetes-based and containerised CI/CD pipelines, Hokstad Consulting deploys specialised monitoring systems that track resource usage, container health, and deployment events. These tools offer crucial visibility into distributed pipeline components, making it easier to troubleshoot issues in complex orchestration environments.
A key part of their strategy is setting clear KPIs and performance baselines from the start. Metrics like build time, deployment frequency, success and failure rates, mean time to recovery (MTTR), code coverage, lead time for deployments, and resource usage are carefully chosen. These metrics provide actionable insights that align with business goals, avoiding the pitfall of generating unnecessary data.
Through their DevOps transformation services, Hokstad Consulting has helped clients achieve up to 75% faster deployments and reduce errors by 90%. These improvements lower operational overhead and boost development team productivity, creating a ripple effect of benefits throughout the organisation.
For organisations aiming to implement robust CI/CD monitoring without the usual trial-and-error phase, Hokstad Consulting offers a proven approach. Their expertise ensures that monitoring systems not only collect the right data but also present it in a way that supports quick decision-making and continuous improvement in deployment processes.
Conclusion: Main Points for CI/CD Error Monitoring
Effective CI/CD error monitoring lays the groundwork for quicker deployments, fewer mistakes, and reduced costs. Organisations that adopt thorough monitoring strategies can achieve up to 75% faster deployments and 90% fewer errors [1].
Spotting errors early is key to preventing minor issues from escalating into costly problems further down the line. Identifying failures during the build stage, rather than in production, saves both time and money. Meanwhile, real-time alerting systems enable swift corrective action, cutting down the mean time to resolution. This proactive approach allows development teams to focus on creating value instead of constantly putting out fires.
Achieving full pipeline visibility is another crucial component. Tools that incorporate distributed tracing and integrated monitoring provide a comprehensive view of the process - from code commits to production deployments. This visibility helps teams identify bottlenecks and resolve them before they affect end-users.
Equally important is monitoring the health of your infrastructure. By keeping an eye on resource usage, container performance, and deployment events - especially in Kubernetes setups - you can ensure your infrastructure is robust enough to support reliable pipeline execution. Some organisations have reported up to a 95% reduction in infrastructure-related downtime by fine-tuning these practices [1].
Setting performance baselines and tracking key metrics like build times, deployment frequency, success rates, and recovery times is essential for ongoing improvement. Regular reviews of these metrics help teams detect regressions early and maintain high standards for pipeline performance. This continuous improvement strengthens the entire CI/CD process, ensuring every stage aligns with your performance goals.
For UK businesses, implementing these strategies means identifying the right metrics, automating monitoring processes, and fostering a culture of ongoing improvement. While investing in monitoring tools and infrastructure may seem costly at first, it pays off through reduced operational overhead, increased productivity, and more reliable software releases.
As technology continues to advance, integrated observability platforms are becoming the norm. These platforms combine metrics, logs, traces, and events into a unified system. Features like AI-driven analytics and automated root cause analysis are making advanced monitoring capabilities accessible to organisations of all sizes. The key to success lies in choosing metrics, tools, and practices that align with your specific infrastructure and business needs.
FAQs
What are the best ways to integrate CI/CD pipeline monitoring tools with your existing infrastructure?
To seamlessly incorporate CI/CD pipeline monitoring tools into your existing setup, start by checking that the tools align with your current infrastructure. Whether you're working with on-premises systems, cloud environments, or a mix of both, choose tools that match your deployment setup.
Pay attention to critical metrics like build success rates, deployment times, and error frequencies to pinpoint areas that need attention. Opt for tools that offer real-time alerts and in-depth reporting, so you can tackle problems as they arise. Automation is another essential element - integrating monitoring into your CI/CD workflow helps catch and fix issues during the build and deployment phases.
Make sure your team is well-equipped to use these tools effectively. Regularly analyse performance data to fine-tune your processes and improve over time. By embedding monitoring into your DevOps workflow, you can build a pipeline that's both reliable and efficient.
What challenges can arise when setting performance baselines for CI/CD pipelines, and how can they be resolved?
Setting up performance baselines for CI/CD pipelines can feel like trying to hit a moving target. Metrics can be inconsistent, workloads often vary, and project requirements are always evolving. Without clear benchmarks, spotting problems or tracking progress becomes a real challenge.
The key to overcoming these hurdles lies in defining specific metrics that match your team’s objectives. Focus on areas like build duration, deployment frequency, and error rates. Tools that offer real-time monitoring and historical data can help you track trends and see the bigger picture. It’s also important to revisit and adjust your baselines regularly to account for any changes in your pipeline or workloads. Consistency in how you collect and analyse data is essential to get reliable insights into your pipeline’s performance.
Why is it important to detect errors early in CI/CD pipelines, and how can this be achieved?
Detecting errors early in CI/CD pipelines is critical to preventing costly problems from reaching production, where they can disrupt services and negatively impact user experience. Catching issues early allows for quicker fixes, reduces downtime, and helps maintain high software quality.
To make this happen, use automated monitoring tools to keep an eye on key metrics like build failures, deployment durations, and error rates. Pair this with continuous testing to catch problems at every stage of the pipeline. Automation not only accelerates detection but also reduces the chance of human mistakes, ensuring deployments are smoother and more dependable.