
Want to improve your AWS RDS performance while managing costs? Here's how you can fine-tune your database for better efficiency and reliability.
Amazon RDS simplifies database management but ensuring it performs optimally requires careful tuning. Key strategies include:
- Selecting the right instance class: Match your workload with options like General Purpose, Memory Optimised, or Compute Optimised instances.
- Storage choices: Opt for gp3 for production workloads to decouple performance from storage size.
- Parameter customisation: Adjust settings like
innodb_buffer_pool_size(MySQL) ormax_server_memory(SQL Server) for better resource usage. - Query and index optimisation: Identify slow queries, use indexes effectively, and rewrite inefficient queries.
- Leverage RDS features: Use RDS Proxy for connection pooling, read replicas for scaling, and ElastiCache for caching hot data.
- Monitor metrics: Track CPU, memory, IOPS, and latency to spot bottlenecks early.
Amazon RDS performance optimization: Instance types, storage, and monitoring best practices [#127]
Selecting the Right DB Instance and Storage
::: @figure 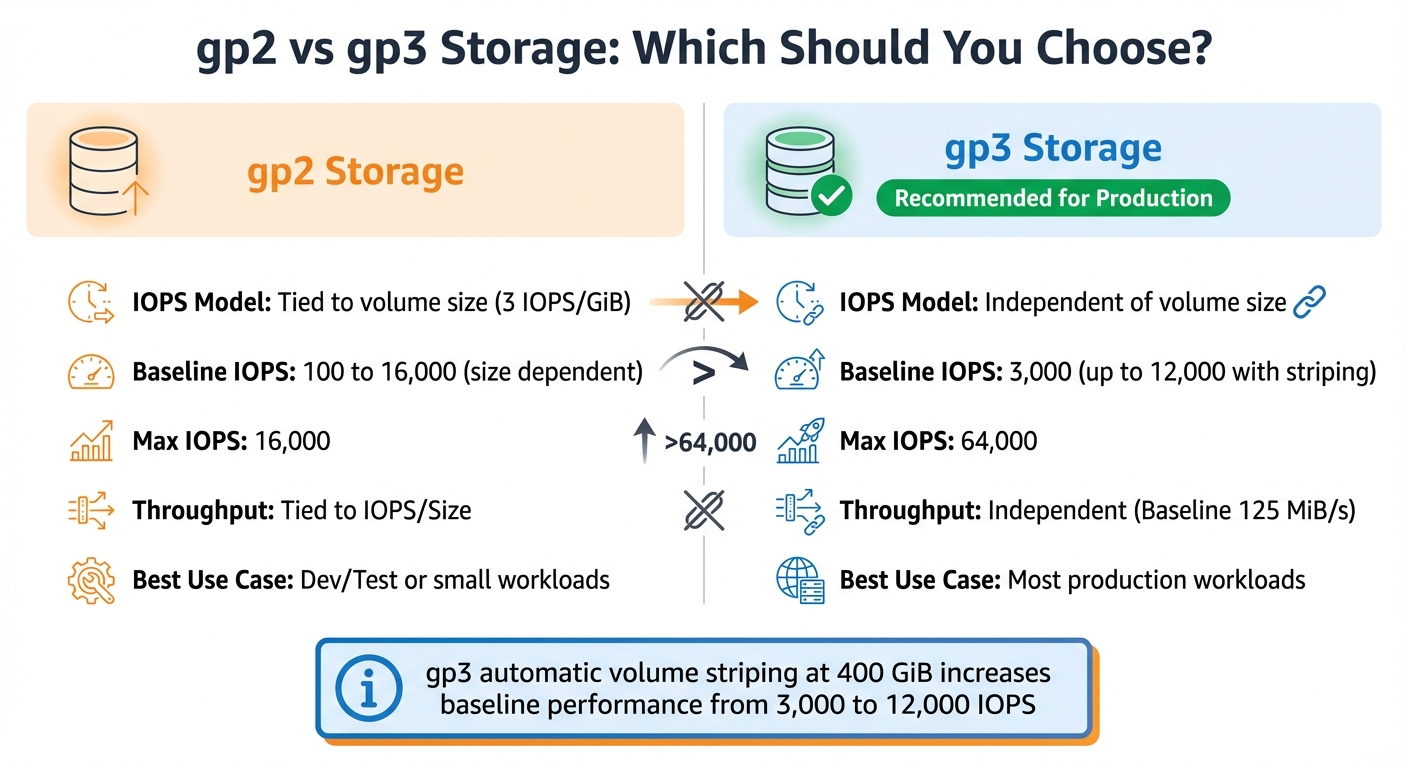 {AWS RDS Storage Comparison: gp2 vs gp3 Performance and Features}
:::
{AWS RDS Storage Comparison: gp2 vs gp3 Performance and Features}
:::
Choosing Your DB Instance Class
Picking the right instance class is a crucial step in ensuring your database runs smoothly and efficiently. AWS RDS instances are grouped into four main categories: General Purpose (M), Memory Optimised (R, X, Z), Compute Optimised (C), and Burstable Performance (T) [1]. The secret to making the right choice lies in understanding your working set - essentially, the data and indexes that are frequently accessed.
An Amazon RDS performance best practice is to allocate enough RAM so that your working set resides almost completely in memory.[2]
For production workloads, Graviton-based instances (e.g., M7g, R7g, or M8gd) are a smart choice, offering better price-to-performance ratios and high memory/throughput [7]. If your database often creates on-disk temporary tables (track this with created_tmp_disk_tables), consider instance types ending in d
like m6gd. These types utilise NVMe-based Optimised Reads, which can boost read performance by as much as 50% [8].
For development and testing environments, T3 or T4g instances are budget-friendly options. Just be aware that they revert to baseline performance once their burst credits are used up [8][1]. If your application is memory-hungry, R-family instances are a better fit, while X2g instances offer the lowest cost per GiB of RAM for databases like MySQL, MariaDB, and PostgreSQL [7].
Keep an eye on metrics like ReadIOPS, EBSIOBalance%, and EBSByteBalance% to ensure your memory and storage are performing as needed [2][8]. If you notice a sharp drop in ReadIOPS after upgrading to an instance with more memory, it’s a sign that your previous instance couldn’t hold the working set in memory [2].
Once you've chosen your instance, it's time to think about storage options.
Storage Options: gp2 vs gp3
When it comes to storage, gp3 is usually the better option for production workloads. It allows you to separate performance from storage capacity, unlike gp2, which ties IOPS to the size of the volume [9]. With gp3, you get a consistent baseline of 3,000 IOPS and 125 MiB/s throughput, regardless of the volume size [10][8].
| Feature | gp2 Storage | gp3 Storage |
|---|---|---|
| IOPS Model | Tied to volume size (3 IOPS/GiB) | Independent of volume size |
| Baseline IOPS | 100 to 16,000 (size dependent) | 3,000 (up to 12,000 with striping) |
| Max IOPS | 16,000 | 64,000 |
| Throughput | Tied to IOPS/Size | Independent (Baseline 125 MiB/s) |
| Best Use Case | Dev/Test or small workloads | Most production workloads |
One standout feature of gp3 is its automatic volume striping at 400 GiB, which increases baseline performance from 3,000 to 12,000 IOPS [8]. This means you can scale performance without paying for unnecessary storage. However, make sure your instance’s network capacity matches your provisioned IOPS; otherwise, you won’t see the full benefits [8].
These storage choices work hand-in-hand with your instance selection to create an efficient and effective database setup.
Multi-AZ Deployment Benefits
For critical applications, Multi-AZ deployments are a must. This setup maintains a synchronous standby replica in a separate Availability Zone, ensuring automatic failover if your primary database fails [1]. It also eliminates I/O freezes during backups, as these operations are performed on the standby instance [1].
Multi-AZ deployments provide robust data redundancy through synchronous replication, safeguarding against both instance failures and entire Availability Zone outages [1]. To ensure your application reconnects quickly after an RDS failover, set the DNS cache TTL to less than 30 seconds [2]. As with instance and storage tuning, regular monitoring in a Multi-AZ setup is key to maintaining steady performance [2].
This configuration strengthens your database's reliability and resilience.
Configuring Parameter Groups
Once you've selected your instance and storage, the next step is to fine-tune your database engine using custom parameter groups. A DB parameter group serves as a container for engine configuration settings that apply to one or more database instances [11]. While AWS provides default parameter groups, these are read-only. To make adjustments, you'll need to create a custom parameter group [11][12]. Keep in mind that parameters can be either dynamic (applied immediately) or static (requiring a reboot) [11][14]. Any changes you make will impact all instances linked to the parameter group [11]. This step is essential for aligning your hardware choices with engine-level performance tuning.
Parameters to Adjust
For MySQL and MariaDB, one of the most important settings is innodb_buffer_pool_size. This should typically be set to 70–80% of your system's RAM to minimise disk I/O. As highlighted by the AWS Database Blog:
This parameter \[innodb\_buffer\_pool\_size\] is one of the most important settings in your MySQL instance, and often 80 percent or more of memory is allocated here.[5]
For high-write workloads, increase innodb_log_file_size to 600 MB [5]. If your queries generate large temporary tables, adjust tmp_table_size and max_heap_table_size to values like 64 MB or 512 MB to keep operations in memory and avoid disk swapping [5][18].
SQL Server users should prioritise the max_server_memory setting, which manages the buffer pool. Deduct 1–4 GB from your total RAM to account for the operating system and thread stack memory when setting this value [6]. Another key parameter is max_degree_of_parallelism (MAXDOP). If your server has more than eight logical processors, setting MAXDOP to 8 or 16 can help reduce CXPACKET wait-time bottlenecks [6]. Additionally, the default value for cost_threshold_for_parallelism is 5, which is outdated for modern processors. Increasing it to 50 can help avoid unnecessary parallelism for smaller queries [6].
| Parameter | Engine | Recommended Value | Effect |
|---|---|---|---|
innodb_buffer_pool_size |
MySQL/Aurora | 70–80% of RAM | Reduces disk I/O by caching data and indexes [5] |
max_server_memory |
SQL Server | Total RAM minus (OS + MTL) | Prevents memory starvation for the OS [6] |
MAXDOP |
SQL Server | 8 or 16 (based on NUMA) | Reduces parallelism-related wait times [6] |
tmp_table_size |
MySQL | 64 MB to 512 MB | Speeds up temporary table operations [5] |
For applications running many unique queries on SQL Server, enabling optimize_for_ad_hoc_workloads can make a big difference. This setting initially caches only a plan stub
, which conserves memory in the plan cache [6][4].
Creating and Applying Parameter Groups
Once you've adjusted the parameters, you'll need to create a custom parameter group to apply them. In the RDS Console, head to Parameter groups and click Create parameter group. Select the appropriate engine family (e.g., mysql8.0 or sqlserver-se-15.0), give your group a name, and click Create [6][13].
After creating the group, select it, go to Parameter group actions, and choose Edit. Search for specific parameters like innodb_buffer_pool_size or max_connections, update the values as needed, and save your changes [6][16]. To attach the custom group to an instance, navigate to Databases, select your instance, and click Modify. Under Database options, switch the DB parameter group to your custom group [6][15].
When saving, you'll be prompted to either Apply immediately or schedule the changes for the next maintenance window [15]. While dynamic parameters take effect right away, static parameters require a manual reboot. Even if you select Apply immediately
, static changes will not activate until the instance is restarted [15][16]. If your instance displays a pending-reboot status, go to Actions and select Reboot to finalise the updates [6][16].
Before rolling out changes in production, test them in a staging environment and monitor performance metrics like FreeableMemory and ReadIOPS in CloudWatch to ensure the adjustments deliver the expected benefits [2][17].
Query and Index Optimisation
Once you've fine-tuned your parameter groups, the next step is improving how your database handles queries and indexes. Even the best hardware and settings can't make up for inefficient queries or missing indexes. The aim here is straightforward: ensure your working set - the data and indexes you use most often - fits into RAM, and make sure your queries pull only the necessary data [2]. The first step is identifying slow queries to locate bottlenecks.
Finding Slow Queries
To spot problematic queries, enable slow query logs. In MySQL and MariaDB, this means turning on slow_query_log and lowering long_query_time from the default 10 seconds to 2 seconds, capturing a broader range of queries [8][21]. For PostgreSQL, adjust log_min_duration_statement to 2,000 milliseconds [20]. In production, always set log_output to FILE instead of TABLE to reduce overhead [21][8].
Tools like Performance Insights can help you monitor database load, measured in Average Active Sessions (AAS) [3]. It's worth noting that Performance Insights will be discontinued on 30 June 2026, so you'll need to transition to the Advanced mode of Database Insights for ongoing support [19]. Use wait event analysis to identify whether bottlenecks are caused by CPU, I/O, or locking. Typically, two or three wait events make up 90% of the database load [3].
To dig deeper into why a query is slow, use the EXPLAIN command to see its execution plan [19][2]. This will show if the query uses an index or performs a full table scan, along with the number of rows examined. Use EXPLAIN ANALYZE for actual execution times [19][2]. MySQL also offers SHOW PROFILE, which breaks down where sessions spend their time [19].
| Database Engine | Parameter | Value | Log Output Parameter |
|---|---|---|---|
| MySQL / MariaDB | slow_query_log |
1 (Enabled) |
log_output = FILE |
| MySQL / MariaDB | long_query_time |
2.0 (Seconds) |
- |
| PostgreSQL | log_min_duration_statement |
2000 (Milliseconds) |
log_destination = stderr |
Once you've identified slow queries, the next step is to optimise indexes for better performance.
Indexing Best Practices
Indexing goes hand-in-hand with query optimisation, ensuring data is accessed efficiently. While indexes can speed up reads, they may slow down writes and consume additional storage [8]. Focus on creating indexes for columns frequently used in WHERE clauses, JOIN conditions, and ORDER BY operations - especially those with high cardinality (many unique values) [8]. Covering indexes are especially useful because they store all the columns a query needs, allowing the database to skip accessing the table rows entirely [8].
Enable the Performance Schema in MySQL and regularly check the sys.schema_unused_indexes view to identify and remove unused indexes that might be slowing down writes [8]. Also, look for overlapping indexes - if you have both INDEX(col1) and INDEX(col1, col2), the first is redundant as MySQL can use the leftmost prefix of the composite index [8]. For long character fields, consider prefix indexing to keep index sizes manageable while maintaining efficiency [8].
Keep your database statistics up to date by running ANALYZE TABLE for MySQL/MariaDB or VACUUM ANALYZE for PostgreSQL [19][2]. This ensures the query optimiser has accurate data distribution information when planning execution. If you notice high and erratic ReadIOPS values in CloudWatch, it often indicates your working set doesn't fit in memory, signalling the need for more RAM [2].
Rewriting Queries for Better Performance
Combining optimised queries with well-designed indexes ensures your working set stays in memory. Always specify the columns you need instead of using SELECT * to reduce I/O and memory usage [23][8]. This is especially crucial for JOIN operations, where fetching unnecessary columns can exponentially increase the data processed [23]. Rewrite nested subqueries as JOINs or Common Table Expressions (CTEs) for better efficiency [23].
Use EXPLAIN to confirm your queries are using the intended indexes - look for Using index
in the Extra column to verify a covering index is in play [19][8]. Avoid long-running or open transactions, as they can increase the InnoDB History List Length, eventually degrading the performance of all queries [19]. If Created_tmp_disk_tables accounts for more than 10–20% of temporary tables, consider rewriting queries to use less memory or upgrading to an instance with Optimised Reads, which can improve read performance by up to 50% for complex queries [8].
| Original Query Pattern | Optimised Query Pattern | Optimisation Benefit |
|---|---|---|
SELECT * FROM products WHERE category = 'Electronics' |
SELECT product_name, price FROM products WHERE category = 'Electronics' |
Reduces data retrieval and I/O [23] |
| Nested Subqueries | JOINs or Common Table Expressions (CTEs) | Often results in a more efficient execution plan [23] |
| Full Table Scans | Queries using Covering Indexes | Enables index-only scansfor maximum speed [8] |
Need help optimizing your cloud costs?
Get expert advice on how to reduce your cloud expenses without sacrificing performance.
Using AWS RDS Features for Performance
AWS RDS goes beyond parameter and query tuning by offering built-in features that help improve performance and scalability. These features focus on managing connections, distributing workloads, and reducing database load - all without requiring changes to your schema or queries. They work alongside earlier optimisation techniques to deliver even better results.
RDS Proxy for Connection Management
RDS Proxy simplifies connection management by pooling database connections. This allows multiple application connections to share the same pool, cutting down on CPU and memory overhead caused by opening and closing connections. It's particularly useful for serverless applications like AWS Lambda, which often have short-lived connections. This setup prevents database exhaustion during traffic spikes.
In failover scenarios, RDS Proxy ensures smoother transitions by routing requests to standby instances while preserving connections. This can reduce failover times to under 35 seconds in Multi-AZ deployments with two standbys [24]. The proxy also helps manage surges by queuing or limiting excess connections, protecting your database from overload. To ensure effective connection pooling, monitor the DatabaseConnectionsCurrentlySessionPinned metric in CloudWatch, as pinned sessions can disrupt multiplexing [26]. Additionally, set the MaxConnectionsPercent at least 30% higher than your recent maximum usage to avoid delays during internal capacity adjustments [25].
RDS Proxy uses a serverless pricing model based on the capacity of the underlying database instances - charging per vCPU for provisioned instances or per Aurora Capacity Unit (ACU) for Aurora Serverless v2 [24].
Read Replicas for Scaling Reads
For read-heavy workloads, read replicas can take the pressure off your primary database by distributing queries across multiple nodes. These replicas are ideal for tasks like analytical queries, reporting, and handling complex joins [27]. To ensure smooth operation, monitor the ReplicaLag metric in CloudWatch to confirm the replicas are staying in sync with the primary instance.
Using separate DB parameter groups for the primary and read replicas allows for specific tuning tailored to read-intensive tasks [5]. In Aurora clusters, matching the DB instance class between writer and reader instances ensures consistent performance [22]. For even faster query processing, consider optimised reads on NVMe-based instance classes, which can speed up temporary table generation by as much as 50% [27]. When combined with query tuning, read replicas make workload distribution more efficient across your RDS setup.
ElastiCache for Data Caching
ElastiCache provides another layer of optimisation by caching frequently accessed data, which reduces the load on your primary RDS instance and delivers response times as low as sub-millisecond [28]. This is especially helpful if your database's working set exceeds the available RAM, leading to higher disk I/O [5].
Individual ElastiCache nodes, whether using Memcached or Redis, can handle up to 65,000 concurrent client connections [28]. Keep an eye on the ReadIOPS metric in CloudWatch - if this metric is high but drops significantly after a RAM upgrade, it might indicate that your working set doesn't fit in memory, making ElastiCache a good solution [5]. Additionally, reviewing the RDS slow query log can help identify queries with full table scans that are ideal candidates for caching [29]. In PHP environments, reusing an existing connection through pooling or persistence can slash latency from 2.82 milliseconds to just 0.21 milliseconds [28].
| Feature | Primary Benefit | Best Use Case |
|---|---|---|
| RDS Proxy | Connection Pooling | Applications with many short-lived concurrent connections |
| Read Replicas | Read Scalability | Distributing read-heavy workloads across multiple nodes |
| ElastiCache | Sub-millisecond Latency | Frequently accessed hot data and session management |
| Optimised Reads | Temporary Table Speed | Complex queries that exceed available RDS RAM |
Monitoring and Maintenance
Keeping an eye on Amazon RDS performance is crucial, especially as workloads evolve. Beyond the initial tuning, consistent monitoring ensures your database continues to operate smoothly. AWS offers a variety of tools to help track important metrics and address any deviations from your established baseline.
Metrics to Track
Amazon RDS provides 1-minute CloudWatch metrics, stored for up to 15 days [30]. Use these metrics - average, maximum, and minimum values - to establish a baseline that reflects your database's typical behaviour [2][32]. This baseline is your reference point for assessing performance.
Acceptable values for performance metrics depend on what your baseline looks like and what your application is doing.(Amazon RDS User Guide) [2]
Here are the key metrics to monitor and what they reveal:
- CPUUtilization: Tracks how much processing power is being used. If usage consistently exceeds your baseline, it might be time to optimise queries or upgrade to a more powerful instance class [31].
- FreeableMemory: Indicates available RAM. Low values suggest your database's working set doesn’t fit in memory [31].
- SwapUsage: High swap usage points to insufficient physical memory [31].
- ReadIOPS and WriteIOPS: Measure disk I/O operations per second. High ReadIOPS or sudden drops after increasing RAM may indicate issues with the working set [31].
- ReadLatency and WriteLatency: These show the average time per I/O operation. Elevated latency could mean disk contention [31].
- DiskQueueDepth: Reflects pending I/O requests. High numbers suggest the storage subsystem is under strain [31].
- ReplicaLag: For read replicas, this measures the delay in syncing with the primary database - a critical metric for maintaining consistency [31].
- BurstBalance: For gp2 storage, this tracks throughput capacity. If it hits 0%, performance is throttled [31].
- CPUCreditBalance: Relevant for burstable instances (e.g., db.t2, db.t3, db.t4g), this ensures you don’t run out of performance credits [31].
- Average Active Sessions (AAS): Monitored via Performance Insights, AAS exceeding the instance's vCPU count indicates a bottleneck. Analysing wait events can help pinpoint whether the issue lies with CPU, disk I/O, or locks [3].
A general rule of thumb is to act when metrics like CPU, memory, or storage exceed 75% of total capacity. For disk space, take action if usage surpasses 85% [2][32].
| Metric | What It Shows | When to Act |
|---|---|---|
| CPUUtilization | Percentage of CPU used | Investigate if consistently high compared to baseline [31] |
| FreeableMemory | Available RAM in bytes | Upgrade if frequently below 25% of total memory [36] |
| ReadIOPS / WriteIOPS | Disk I/O operations per second | Watch for spikes indicating working set issues [31] |
| ReadLatency / WriteLatency | Average time per I/O operation | High latency signals bottlenecks or contention [31] |
| DiskQueueDepth | Pending I/O requests | High values suggest storage struggles [31] |
| ReplicaLag | Replica sync delay | Critical for read consistency [31] |
| SwapUsage | Swap space usage | High usage indicates insufficient RAM [31] |
Setting Up Alerts and Automated Tasks
After identifying the key metrics, set up alerts to catch anomalies early. Use CloudWatch alarms for thresholds like CPU usage (trigger alerts at 70–80%), FreeStorageSpace (alert when less than 15% remains), or sudden ReadIOPS spikes. Configure these alarms to send notifications via Amazon SNS, so you’re instantly informed through email or SMS [30].
Monitoring is an important part of maintaining the reliability, availability, and performance of Amazon RDS and your other AWS solutions.(Amazon Relational Database Service) [34]
To simplify monitoring, Amazon DevOps Guru for RDS uses machine learning to detect unusual database loads or deviations from normal patterns [3].
Other tips for proactive management include:
- DNS TTL Settings: If your application caches DNS data, set the TTL to less than 30 seconds. This ensures quick failover to a new IP address if needed [2].
- Backups: Schedule automatic backups during periods of low write IOPS to minimise performance impact [2].
- Connection Limits: If rising connection counts affect performance, restrict
User Connectionsthrough your parameter group [2]. - Automatic Updates: Enable
Automatic Minor Version Upgrades
to seamlessly receive performance and security improvements [2].
Regular Performance Reviews
While automated alerts are helpful, regular reviews ensure your database keeps up with changing workloads. Revisit baselines every few months to confirm they reflect both peak and off-peak conditions [32][36]. Adjust Key Performance Indicators (KPIs) based on your business goals, such as maintaining 99.99% availability [33].
Before upgrading to a larger instance, optimise resource-heavy queries using tools like Performance Insights and Slow Query Logs [36]. If memory usage frequently exceeds 75%, consider either optimising the workload or moving to a higher instance class [2]. Proactively scaling storage and compute resources before hitting capacity limits helps avoid performance issues [2].
For major updates or schema changes, Blue/Green deployments allow you to test changes in a staging environment, reducing the risk of downtime during switchover [35]. Additionally, the RDS console offers automated recommendations for resizing instances, creating read replicas, or tweaking parameter groups based on historical data [34].
Conclusion
By following steps like instance selection, parameter adjustments, and query optimisation, you can fine-tune your AWS RDS environment for top performance. Keep in mind, though, that this is an ongoing process. Achieving the right balance between infrastructure sizing, storage efficiency, and consistent monitoring is crucial. A key focus should be ensuring your working set - the data and indexes accessed most often - fits into RAM. You can monitor this through the ReadIOPS metric. If increasing memory significantly reduces ReadIOPS, it’s a clear sign that your previous instance was under-provisioned [2]. Additionally, transitioning from gp2 to gp3 storage often boosts baseline performance, particularly with automatic volume striping kicking in at 400 GiB, which enhances IOPS [8].
Cost optimisation is another critical area. If your CPU and I/O usage regularly stay below 30% in production (or 50% in non-production), it’s worth considering downsizing your instance class [37]. Tagging instances with labels like Database Owner
and Application Owner
can help quickly identify stakeholders when reviewing right-sizing opportunities. Also, keep an eye on manual snapshots - unlike automated backups, they aren’t deleted automatically, which can lead to unnecessary storage costs [37].
Fine-tuning parameters is vital to avoid wasting resources and to improve query efficiency. Tools like EXPLAIN can help analyse query execution plans, and removing redundant indexes ensures you’re not using resources on operations that don’t add value [8].
For additional support, consider working with experts to optimise your cloud operations. Hokstad Consulting specialises in services such as DevOps transformation, cloud cost management, and strategic migration planning. Their track record includes reducing cloud costs by 30–50% and improving deployment cycles, making them a valuable asset for organisations looking to enhance both performance and cost efficiency.
To keep your RDS environment responsive and cost-effective as workloads evolve, use tools like Performance Insights, set up automated alerts, and schedule regular reviews. Combining these strategies with proactive resource management will ensure your RDS scales seamlessly with your business needs, keeping costs under control while maintaining optimal performance.
FAQs
How do I choose the right AWS RDS instance class for my application?
Selecting the right Amazon RDS instance class boils down to understanding your application’s specific resource requirements. Begin by reviewing key metrics like CPU usage, memory usage, storage IOPS, and latency during a typical workload period. Ideally, a well-performing instance stays under 70% CPU utilisation and 80% memory usage.
For applications that rely heavily on processing power, a compute-optimised class (such as the C-family) is a solid choice. If memory is the limiting factor, go for a memory-optimised class (like the R-family). For workloads that need a balance of resources, general-purpose instances, such as db.m8gd, offer a good combination of performance and flexibility. Meanwhile, for applications with light usage but occasional traffic spikes, burstable-performance classes (T-family) provide a cost-efficient option.
Once you’ve narrowed down your choice, test it by scaling your database and keeping an eye on performance metrics. A good starting point is a smaller instance size, such as db.m8gd.large, and then scaling up as needed. This method ensures your instance operates efficiently without over-provisioning, keeping costs manageable in pounds (£). For UK-based workloads, Hokstad Consulting can help automate this process, establish monitoring baselines, and fine-tune your instance selection for optimal performance.
What advantages does gp3 storage offer over gp2 for production workloads?
When it comes to production workloads, gp3 storage stands out by offering better performance and cost efficiency compared to gp2. With a baseline of 3,000 IOPS that can scale up to 16,000 IOPS and 1,000 MiB/s throughput, it delivers robust performance while being easier on the budget thanks to its lower per-GiB pricing.
One of the key differences is how performance is managed. In gp2, performance depends on volume size - providing 3 IOPS per GiB, with a minimum of 100 IOPS. However, gp3 breaks this dependency by allowing you to scale IOPS and throughput independently. This means you get consistent, predictable performance, making it an excellent choice for applications that demand high throughput and low latency.
How do RDS Proxy and read replicas help improve database performance?
RDS Proxy boosts performance by pooling and reusing database connections. This approach cuts down the CPU and memory strain that comes with creating new connections, making it easier to handle sudden traffic spikes and ensuring steadier performance during busy periods.
Read replicas, meanwhile, shine in read-heavy environments. By diverting read operations to separate instances, they enhance query throughput and reduce latency. This makes your database more responsive, especially for applications with high read demands.
When used together, these tools help you make better use of your resources and scale your AWS RDS database more effectively.