
Rate limits can slow model extraction - but they cannot prove it has stopped. I test whether controls cut accepted queries, spot distributed activity and alert the right people without blocking legitimate users.
I start with written approval, normal-traffic measurements and a fixed budget in £. Then I check:
- Rate limits: single-key bursts, shared quotas and low-rate traffic spread across identities.
- Detection and alerts: missed attempts, false alarms and time to detection, acknowledgement and response.
- User impact: errors, delays, retries and costs before and after tuning.
Example targets include alerts within five minutes and legitimate-user errors below 0.5% - agreed targets, not measured results. I keep test results separate from estimates, assign owners to unresolved risks and retest after changes.
The key distinction: fewer accepted queries do not prove that copying the model failed. Where approved, I assess that separately.
::: @figure 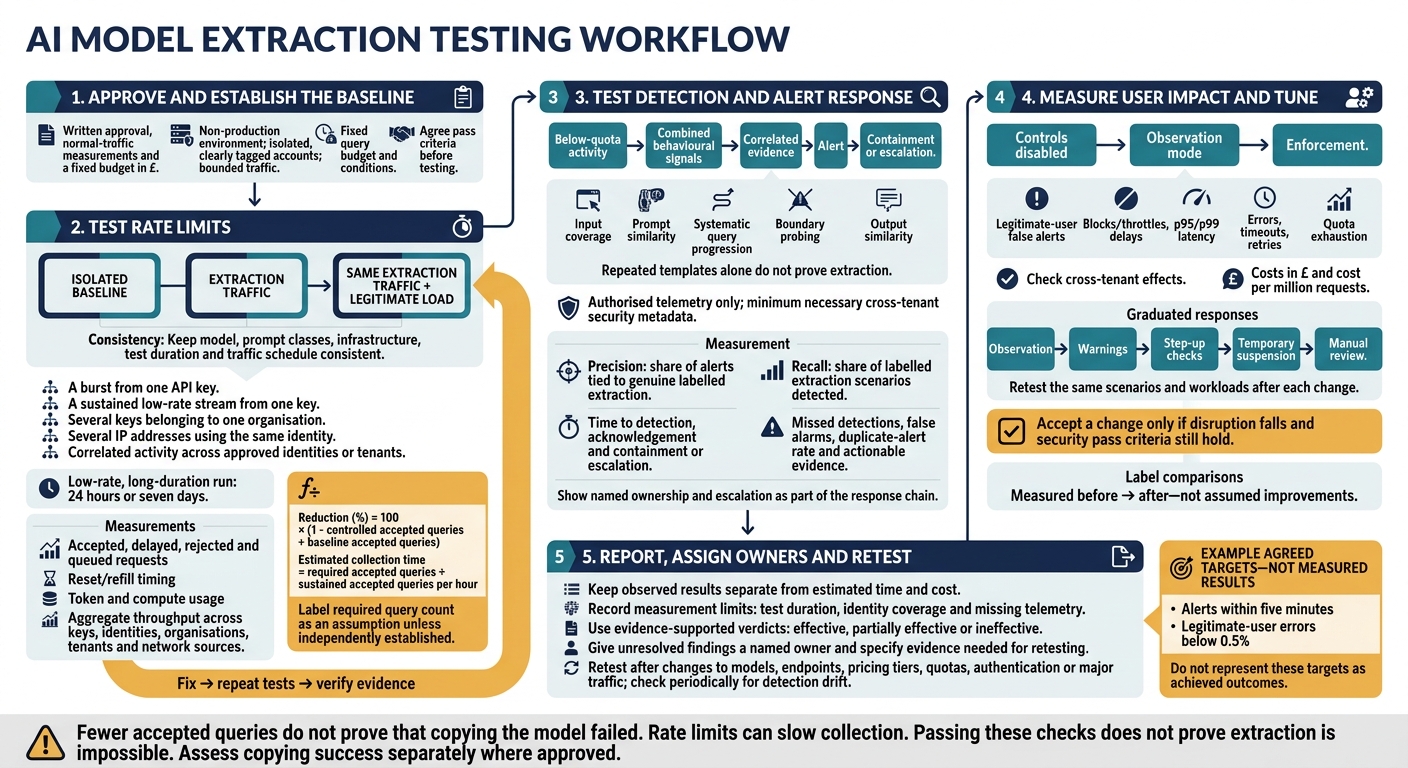 {AI Model Extraction Testing: Limits, Alerts and Retesting}
:::
{AI Model Extraction Testing: Limits, Alerts and Retesting}
:::
Lecture 6: Model Extraction Attacks
Step 1: Test Rate Limits Against Distributed Queries
Use three labelled runs: an isolated baseline with the tested control disabled or set to observe-only; extraction traffic with the control enabled and no legitimate load; and the same extraction traffic alongside representative legitimate load.
Keep the model, prompt classes, infrastructure, test duration and traffic schedule consistent. Run tests in a non-production environment with isolated, clearly tagged accounts and bounded traffic that cannot affect unrelated customers. Keep the agreed query budget and stop conditions fixed across all three runs. This lets you check whether distributed traffic bypasses per-key limits.
Simulate Bursts and Distributed Traffic
Start with the traffic pattern, then check whether limits hold across distributed sources. Test at least five patterns:
- A burst from one API key.
- A sustained low-rate stream from one key.
- Several keys belonging to one organisation.
- Several IP addresses using the same identity.
- Correlated activity across approved identities or tenants.
Add a low-rate, long-duration run over 24 hours or seven days.
Measure reset and refill timing - not just the first rejection. Record token and compute usage too. Even a few requests can be costly if they use long prompts, large outputs or expensive operations. OWASP recommends tuning limits to business needs and considering spending limits or billing alerts alongside request limits.[6]
Check Enforcement Across Keys and Tenants
Change one dimension per run. Check whether counters combine usage across keys, identities, organisations, tenants and network sources, including across serving instances or regions.
Test throttling, rejection, queuing, response downgrading and suspension separately. For each, record accepted, delayed, rejected and queued requests; enforcement and reset times; remaining throughput; status codes; and retry details. A 429 usually marks a throttled request.[8]
Use this table as a recording guide, not as measured results.
| Control dimension | Extraction scenario | Residual evasion risk | Enforcement result to record | User impact |
|---|---|---|---|---|
| API key | Burst followed by sustained requests | Additional keys may create new budgets | Accepted volume, rejection point and reset time | Shared-key workloads may be throttled |
| Identity | One identity across several approved IPs | Additional accounts or shared credentials | Whether requests consume one combined quota | Legitimate roaming users may lose access |
| Organisation | Several keys within one organisation | Separate organisations may retain independent budgets | Aggregate throughput and organisation-level enforcement | Other workloads may exhaust their shared quota |
| Tenant | Correlated activity across approved tenants | Independent tenant budgets permit continued collection | Per-tenant enforcement and remaining combined throughput | Check that unrelated tenants remain unaffected |
| Network source | Distributed approved IP addresses | IP-only limits leave distributed traffic largely unchecked | Per-source rejection and total accepted throughput | Users behind shared networks may be unfairly limited |
| Request cost | Long prompts or large outputs | Request-only quotas miss expensive calls | Token-budget enforcement and output restrictions | Legitimate large requests may be delayed |
Compare accepted queries per hour and absolute counts with the baseline. Calculate the reduction as:
100 × (1 − controlled accepted queries ÷ baseline accepted queries)
Estimate collection time as:
required accepted queries ÷ sustained accepted queries per hour
Clearly label the required query count as an assumption unless it has been independently established. Report estimated model, infrastructure and retry costs in £, alongside legitimate users’ success rate, p95 latency, queue time, 429 rate and completion quality. Break down user impact by tenant, endpoint, tier and region.
Rate limits can slow collection; they do not prove that patient or distributed extraction is prevented.[5][7] Check whether the results show limits on single callers only, or constraints on coordinated extraction too.
Step 2: Test Detection and Alert Response
If rate limits slow extraction but don’t stop it, check whether monitoring still spots the pattern.
Check Behaviour Beyond Query Volume
Run labelled extraction scenarios below quota thresholds alongside legitimate batch jobs.[10] Focus on low-and-slow patterns that simple quota triggers miss. Compare input coverage, prompt similarity, systematic query progression, boundary probing and output similarity against normal behaviour for the same model, endpoint, customer type and time of day. Probe confidence scores only when the system exposes them. Combine signals: repeated templates alone don’t prove extraction.
Analyse request order and category coverage in sliding windows. Measure divergence from the baseline, looking for systematic category sweeps or stepwise input changes after each response.[10] Record whether each signal was available, evaluated and triggered. Explicitly mark unavailable or inapplicable signals, disabled sequence analysis and incomplete telemetry. Otherwise, a missing alert could be mistaken for a clean result.
Correlate activity across keys, IP addresses, identities and tenants only through authorised telemetry. Record the reason for each join and retain tenant-scoped access controls. Cross-tenant investigations should expose only the minimum security metadata needed, such as hashed indicators, counts or risk scores - not another tenant’s prompts or outputs.[11] Test that users without permission cannot access correlated evidence.
Once monitoring spots the pattern, check whether alerts reach the right owners in time.
Check Alert Accuracy and Escalation
Trigger warning, high-severity and critical alerts under the approved response policy. Verify grouping, deduplication, delivery, acknowledgement, named ownership, escalation after missed service-level objectives and closure. Check that one coordinated campaign produces one incident, while unrelated campaigns stay separate.
Each incident needs identities, key identifiers, tenant scope, time range, volumes, signal summaries, triggered controls, evidence references, analyst confidence and a clear reason for its severity.
Measure precision as the share of alerts tied to genuine labelled extraction, and recall as the share of labelled extraction scenarios detected.[9][13] Record the time from the first qualifying signal to detection, then from alert to acknowledgement and from alert to containment or escalation.
Track the duplicate-alert rate and the proportion of incidents with enough evidence to act. Report results by detector and severity, including missed detections and false alarms on legitimate traffic.[12] Carry false alarms and missed detections into Step 3 for threshold tuning.
Step 3: Measure User Impact and Tune Controls
Use the false alarms and missed detections from Step 2 to measure how each control affects legitimate users.
Measure False Alarms and Service Disruption
Replay representative production and test workloads in a safe test environment. Start with controls disabled, then repeat in observation mode and under enforcement. Cover each service tier and tenant. For every test, record the tenant, user or service identity, workload type, request volume, token volume, concurrency and expected service level.
Measure the impact on legitimate runs: false-alert rate, block or throttle rate, and delay rate. Report each by workload, tenant and control. Record added p95/p99 latency, errors, timeouts, quota exhaustion, retries, support tickets and overrides.
Check for cross-tenant effects, too. Do tenants sharing an IP get throttled together? Does one tenant’s batch job consume another tenant’s quota?
Calculate disruption costs from support time, engineering review, extra inference, monitoring, verification and customer credits. Report totals in £ and cost per million requests.
Use these figures to choose the narrowest workable thresholds in the next step.
Tune Thresholds and Compare Results
Tune request, token and concurrency limits by workload and tenant. Apply graduated responses: observation, warnings, soft quotas, throttling, step-up checks, temporary suspension and manual review. Automated agents may need a separate token and tool-call budget.
Every exception must have a named owner, scope, justification, start date, expiry date and monitoring condition. Avoid permanent allow-lists.
After each change, retest the same extraction scenarios and approved workloads. Fill in the table with measured before → after results - not assumed improvements. Accept a change only if disruption falls and the security pass criteria still hold.
| Control and scope | Security benefit: before → after | False-positive risk: before → after | Running cost: before → after | User effect: before → after |
|---|---|---|---|---|
| Per-key rate limit | Extraction throughput; time to intervention | Blocked or throttled legitimate requests ÷ all legitimate requests | Gateway and support cost in £ | Added p95 latency; retries |
| Per-tenant token quota | Extraction token consumption | Legitimate jobs delayed beyond target ÷ all legitimate jobs | Model spend and override labour in £ | Quota exhaustion; completion time; tenant spillover |
| Behavioural alerts with graduated enforcement | Distributed scenarios detected; time to intervention | Legitimate runs alerted ÷ all legitimate runs; blocks separately | Monitoring and investigation cost in £ | Check failures; support contacts; suspension duration |
Conclusion: Report Results and Plan Retesting
Check results against the pass criteria: throttling must reduce extraction throughput, monitoring must detect distributed activity, and the impact on legitimate users must stay within limits. Passing these checks does not prove extraction is impossible.
Use the same metrics from Steps 1–3 so each verdict can be traced back to the evidence.
Document Findings and Remaining Risks
Report accepted requests per minute alongside blocked requests. Keep observed results separate from estimated time and cost, and explain the assumptions behind each estimate.
Use the same format for every scenario so readers can compare rate limits, alerts and user impact directly. Assign effective, partially effective or ineffective against the relevant pass criteria only when the evidence supports that verdict.
| Scenario | Detection signal | Rate-limit outcome | Alert severity | User impact | Residual risk | Verdict |
|---|---|---|---|---|---|---|
| Single-key burst | Request rate; HTTP 429 responses | Accepted and rejected throughput | Recorded severity | Delays and failed requests | Compromised credentials | Record verdict |
| Distributed queries | Correlated activity across identities | Aggregate throughput; throttling | Recorded severity | Shared-quota disruption | Multiple identities; low-and-slow extraction | Record verdict |
| Legitimate workload spike | Traffic and latency changes | Allowed, delayed or blocked requests | Recorded severity | Service-level breaches | False alarms | Record verdict |
State the measurement limits, including test duration, identity coverage and missing telemetry. A short test cannot rule out slow extraction. Record exposure to compromised credentials, multiple identities and activity that looks normal.
Use these residual risks to prioritise fixes and decide what to retest first.
Assign Follow-Up Actions and Retest
Give each unresolved finding a named owner responsible for the fix, and specify the evidence needed for retesting.
Retest after changes to models, endpoints, pricing tiers, quotas or authentication methods. Also retest after major traffic changes or when you suspect detection drift. Schedule periodic checks for detection drift.
If you need support, Hokstad Consulting can help with AI strategy, implementation and custom-agent work. Keep test approval, risk acceptance and follow-up within your organisation.
FAQs
How can I distinguish distributed extraction from legitimate batch traffic?
Identify clients at the gateway and apply per-client rate limits. Use shared counters so every node enforces the same limits.
Legitimate batch jobs run on a schedule, use stable endpoints and process expected volumes. Distributed extraction tends to run more slowly, span multiple hosts or clients, and show unusual timing or resource use. Use AI-assisted monitoring with dynamic baselining to reduce false alarms and alert only on genuine anomalies [1][2].
How do I set rate limits without disrupting legitimate users?
Use tiered rate limits with Sliding Window or Token Bucket algorithms to handle traffic bursts. Apply these limits consistently at your API gateway, with shared state across distributed services [1][2].
Return 429 Too Many Requests with a Retry-After header, and support jittered exponential backoff. To smooth traffic spikes, consider gradual throttling or more granular limits. Monitor saturation and latency, then adjust thresholds to match system capacity [1][2][3][4].
What evidence would show that model extraction succeeded?
Evidence mainly comes from behavioural anomaly detection and API monitoring. Warning signs include unusually high request volumes from particular sources or unexpected query sequences that suggest attempts to map or copy model outputs. Monitoring tools flag activity that differs from past traffic and usage patterns.
Tracking sensitive data in transit and spotting unauthorised endpoint access can also reveal extraction attempts. These checks can trigger alerts when behaviour appears suspicious or breaches compliance rules.