
If I had to cut this down to one answer, it would be this: for large multi-cloud estates, IBM Apptio Cloudability and VMware Tanzu CloudHealth look strongest for finance-led planning; for fast-moving engineering teams, Anodot, Vantage, and CloudZero are easier to line up with day-to-day cost checks; and for Kubernetes-heavy spend, CAST AI is the most focused option. If I were staying in one cloud only, the built-in AWS, Azure, and Google Cloud tools would be the starting point because they are free.
At a glance, this comparison looks at 7 platforms across the points that matter most to UK teams: forecasting method, budget planning, anomaly alerts, multi-cloud support, FinOps reporting, and price fit. The main split is simple: some tools are built for board packs and governance, while others are built for engineering teams that need fast cost signals.
Here’s the short version:
- Anodot: strong on ML-based forecasting and live anomaly alerts
- IBM Apptio Cloudability: strongest fit for finance, chargeback, and planning cycles
- VMware Tanzu CloudHealth: broad cloud and hybrid scope, with long-range forecasts
- Vantage: lighter setup, clear budgets and alerts
- CloudZero: best when you care about cost per customer, feature, or AI call
- CAST AI: focused on Kubernetes forecasts, rightsizing, and automation
- Native AWS, Azure, and GCP tools: free and useful, but single-cloud only
::: @figure 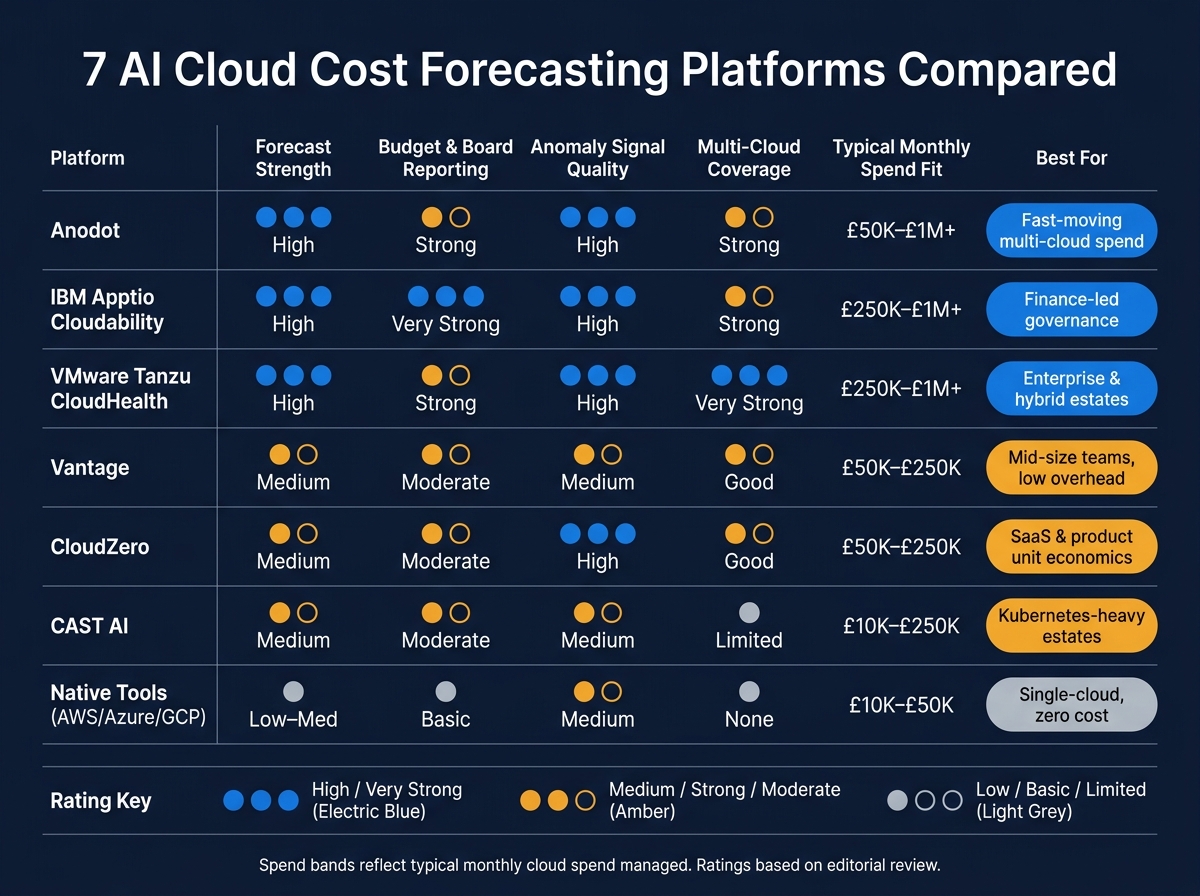 {7 AI Cloud Cost Forecasting Platforms Compared: Quick Decision Guide}
:::
{7 AI Cloud Cost Forecasting Platforms Compared: Quick Decision Guide}
:::
Cloud Cost Estimation & Forecasting using AI with Costix
Quick Comparison
| Platform | Best fit | Forecast depth | Budget/reporting fit | Cloud scope |
|---|---|---|---|---|
| Anodot | Fast-changing multi-cloud spend | High | Strong | AWS, Azure, GCP, Kubernetes |
| IBM Apptio Cloudability | Finance-led teams | High | Very strong | AWS, Azure, GCP |
| VMware Tanzu CloudHealth | Enterprise and hybrid estates | High | Strong | AWS, Azure, GCP, OCI, VMware |
| Vantage | Mid-size teams that want a lighter tool | Medium | Medium | Multi-cloud plus data platforms |
| CloudZero | SaaS and product teams | Medium | Medium | 50+ providers |
| CAST AI | Kubernetes-heavy estates | Medium | Lower for finance packs | EKS, AKS, GKE, OpenShift |
| Native tools | Single-cloud teams | Low to medium | Basic | One cloud at a time |
The key point is simple: if you need £ budget control, chargeback, and quarterly planning, I’d look first at Cloudability or CloudHealth. If you need fast alerts and lower overhead, I’d start with Anodot, Vantage, or CloudZero. If most of your spend risk sits in Kubernetes, I’d look at CAST AI before a broad FinOps suite.
That framing makes the rest of the article easier to scan.
1. Anodot
Anodot started in monitoring, and that shows. Its forecasting and alerting work as one connected system, not as two separate tools bolted together.
It works best when spend forecasting and anomaly detection need to flow through the same process.
Forecast methods
Anodot uses patented machine-learning and deep-learning models to analyse historical cost and usage data and generate spend forecasts automatically.[4][5][6][10] It can work with as little as two months of historical data to produce a one-year forecast, with high forecast accuracy. Forecasts are available in daily, weekly, monthly, quarterly, and annual views, and they refresh hourly.[2][4][5]
That level of detail is handy for UK teams dealing with variable GPU or inference workloads, where costs can shift fast from one day to the next.
Budget planning
The same model also powers its alerting layer.
Budget planning focuses on adaptive forecasting, cost allocation, and scheduled reporting.[1][3][5][8][10] Teams can assign all cloud spend to business dimensions such as product lines, teams, or customer segments, so reports line up with internal cost centres or project codes.[3][10]
Scheduled reports show current spend alongside projected costs for the next three months. That helps with decisions around Savings Plans and Reserved Instances purchases, or when modelling long-term discounts.[5][8][10] UK finance teams can present these views in £-denominated formats aligned to local fiscal calendars.[6][8]
Anodot uses a subscription pricing model, usually scaled to cloud spend volume. For teams that want platform costs they can plan for, that setup is often a good fit.
Anomaly signals
Anomaly detection is one of Anodot's strongest areas. The platform continuously monitors cloud spend and sends real-time alerts when costs move away from learned patterns, using machine learning to read seasonality, correlations, and other relationships in the data.[7][9][12][13]
Alerts include automated root cause analysis, which shows which service, region, account, or Kubernetes resource is behind the spike.[4][9][12][13] That matters because an alert on its own is only half the story. The next question is always: what caused it?
A useful feature here is Business Impact Alerts. This lets teams assign a monetary value to anomalies, so they can see how much an issue has cost so far.[2][15] Anodot's own internal implementation reportedly identified savings of around USD 360,000 per year after five months of tagging, granular monitoring, and AI-based alerts.[14]
Multi-cloud and reporting
Anodot brings together AWS, Azure, Google Cloud, and Kubernetes costs in unified dashboards, with filters for specific clouds, accounts, business units, or projects.[1][2][7][10][11][13] Reporting includes FinOps-focused KPIs such as month-to-date spend, projected costs, budget variance, and top cost drivers across connected environments.[1]
For UK organisations running workloads across AWS London, Azure UK South, and GCP europe-west, Anodot can normalise billing data and produce GBP-based multi-cloud reports suited to chargeback, board packs, or executive review.[1][3][10][11][13] Managed service providers can also use white-labelled portals to give their own customers branded reports while still running on Anodot's engine underneath.[1][2][7][10][11]
Anodot is a better fit for larger multi-account estates or fast-growing scale-ups, where volatile spend and complex cost allocation make a dedicated forecasting and alerting layer worth the spend.
2. IBM Apptio Cloudability
IBM Apptio Cloudability is built for teams that need AI forecasts to fit into finance governance, not just sit in a dashboard. It works well for UK teams that want cloud forecasts to feed straight into finance planning.
Forecast methods
Cloudability's Intelligent Forecasting uses a multi-model ML engine with IBM watsonx to analyse past cloud spend patterns and pick the best-fit model for each line item.[21][30][31] It has been trained on billions of dollars of historical spending patterns, so it can spot seasonality, growth trends, and the ups and downs in cloud usage that show up in day-to-day operations.[17][20]
It also removes past anomalies and outliers before building a forecast.[29][30] That matters when a UK finance team needs figures it can defend in front of a CFO, board, or investor.[20]
The platform supports bottom-up forecasts based on resource data, as well as top-down budgets by business unit, product, or cost centre.[16][18] In plain terms, engineering and finance can work from the same numbers instead of arguing over two different models. The same engine also powers budgeting and variance alerts.
Budget planning
Cloudability's Budgets & Forecasts module lets teams set multiple budgets per View, split by account, tag, product, or team, and track spend against each one across AWS, Azure, and Google Cloud.[17][22][28] Teams get email and in-product alerts when spend is likely to go over budget or already has in the current month.[17][24][26]
For larger UK organisations, Cloudability connects with Apptio Planning so cloud budgets link straight to enterprise finance plans, including a dedicated Cloud tab for managing cloud OPEX alongside other spend categories.[18][19] That's handy when cloud costs need to sit inside the yearly budgeting cycle, not off to one side in a separate FinOps tool.
Its True Cost layer amortises reservations, normalises credits, and allocates shared costs for cleaner finance reporting.[34] Those budgets then feed into anomaly signals and reporting.
Anomaly signals
Cloudability flags unusual spikes or drops before they throw forecasts off course, using historical spend analysis inside its forecasting engine.[20][21] Alerts can also be sent to PagerDuty, so a cloud cost spike can land in the same on-call flow as a production incident.[32]
Multi-cloud and reporting
Cloudability does more than forecasting. It also brings spend allocation and board-level reporting into one place. Reporting across AWS, Azure, and Google Cloud is unified, with business mapping and unit economics driven by tags, accounts, subscriptions, or projects.[16][23][28] Its business mapping engine allocates 100% of cloud spend to internal cost centres, which supports both showback and chargeback across providers.[23]
Unit economics views, such as cost per active user, cost per transaction, or cost per API call, help UK startups and larger firms tie cloud spend to business results instead of just rows of infrastructure charges.[16][18][27][34] UK teams can show these figures in GBP (£) and use monthly or quarterly reporting cycles that fit board packs and finance reviews.
3. VMware Tanzu CloudHealth
VMware Tanzu CloudHealth is an enterprise FinOps platform for AWS, Azure, Google Cloud, Oracle Cloud Infrastructure and VMware estates. In plain terms, it fits best when a company runs across several clouds, plus VMware, and needs a steadier planning view instead of reacting to every short-term spend blip.
Forecast methods
CloudHealth uses up to 12 months of history to forecast the current month and as far as 36 months ahead.[50][36][35] Its models factor in seasonality, repeating usage patterns and past trends, including weekday versus weekend behaviour and quarter-end spikes.[35][36][41]
Finance and FinOps teams can fine-tune projections with a Growth Factor, leave out specific cloud services from the forecast, and narrow forecasts with Perspectives, CloudHealth’s custom cost-grouping feature.[35][36][41][42][46] That longer forecast window is especially useful for fiscal-year planning and budget control.
Budget planning
CloudHealth lets teams set annual budgets that line up with their fiscal year and build multiple budgets by environment, business unit or region.[38] You can view budget, actual and forecast side by side, which makes variances stand out much faster.[35][38][39][41]
Stakeholders can also get alerts when projected spend is likely to go past a budget threshold.[38][43] Governance policies can check conditions such as month-to-date projected cost going over 100% of budget and then trigger alerts on their own.[54] For UK teams, that means closer control over cloud spend without having to wait for the month-end invoice.
Anomaly signals
CloudHealth’s anomaly engine separates sudden changes, outliers, seasonality and repeating usage patterns, which helps cut false positives.[52] It covers AWS, Azure and Google Cloud Platform, including marketplace charges, and flags both spend spikes and unexpected drops.[53][55][56]
Teams can filter anomalies by service, region and account, then sort them by absolute pound value or percentage change so the biggest financial issues rise to the top.[44] If one region suddenly shows a storage jump, for example, it’s easier to spot and check before the bill closes.
Multi-cloud and reporting
Beyond forecasting, CloudHealth turns spend data into reporting that finance teams and leadership can use day to day. Its Perspectives feature maps cloud costs to business groupings such as teams, products, cost centres or Kubernetes namespaces, which supports showback and chargeback across AWS, Azure, Google Cloud and on-premises VMware estates.[42][45][47] It also includes more than 200 pre-built reports, plus FlexReports for custom analysis.[51]
Intelligent Assist answers natural-language queries and builds reports.[37][40][47] Cloud Smart Summary turns spend changes into short board-ready narratives.[40][47] Historical reporting covers up to three years of data.[51]
CloudHealth typically charges about 2.5% of spend under management per year; one public AWS Marketplace example lists US$45,000 per year for up to US$150,000 a month of AWS spend.[48][49]
4. Vantage
Vantage brings forecasting, budgeting, anomaly detection and reporting into the same Cost Reports view. The result is a planning setup that doesn’t just show what you spent, but also where spend is heading and where it starts to look off.
Forecast methods
Baseline Forecasts use machine learning on up to six months of daily service-level cost data, and they refresh each day.[68] That gives teams a rolling view based on recent spend patterns.
Dynamic Forecasts, available on the Enterprise tier, go a step further. They can include business metrics like active users, API calls or transactions, so the forecast follows growth in the business rather than relying only on past cloud spend.[59][65] Those forecasts then feed straight into budget thresholds and variance tracking.
Budget planning
Budgets in Vantage can be set up in a hierarchy up to ten levels deep and tied to Cost Reports broken down by team, product, environment or account.[70] They can run on timelines from weekly to multi-year, with actuals, budget and forecast shown side by side.[69]
Virtual tagging is a handy part of this. Teams can reassign costs to internal groupings without changing the cloud resource tags themselves.[62] That matters when tagging is still a bit messy, but finance and engineering still need clear ownership of spend.
Alerts can be sent to Slack, Microsoft Teams, email or Jira when spend gets close to a threshold.[57][61] The same flow can also flag spend spikes before they start skewing the forecast.
Anomaly signals
Vantage detects anomalies at the service-category level, not just at the total-spend level. So instead of a vague warning, teams can see whether the issue sits in areas like Data Transfer or Compute costs.[58]
It uses a 98% confidence threshold and alerts only on the first detection of a given spike, which helps cut down notification fatigue.[64] Alerts also include enough context to start an investigation straight away. That same context then feeds into one reporting model across cloud and data platforms.
Multi-cloud and reporting
Vantage connects with AWS, Azure, Google Cloud, Kubernetes, plus major cloud and data platforms, and pulls that spend into one cost model.[60][62] For UK organisations running workloads across more than one platform, that means total technology costs can be viewed in GBP, with a Taxes toggle for VAT visibility, and reporting grouped by region, such as EU-West-2.[66]
Pricing is based on spend, with a free tier, paid plans and custom enterprise pricing.[63][67]
5. CloudZero
CloudZero takes a different angle on forecasting. Instead of just projecting your total cloud bill, it focuses on unit economics. So rather than asking, “What will we spend next month?”, you can ask, “What will our cost per customer, per feature, or per AI inference look like as we grow?”[78][74]
That matters a lot when finance needs margin-level and customer-level visibility, not just one top-line cloud number.
Forecast methods
CloudZero allocates 100% of cloud and Kubernetes costs to what it calls Dimensions - groupings such as product, team, environment, or customer.[73][76] From there, its forecasting layer blends past cloud, AI, Kubernetes, and SaaS spend with product, team, feature, and customer data.
The goal is simple: show how metrics like cost per 1,000 daily active users, cost per AI call, and cost per feature are likely to change as the business grows.[72][75][79] That gives teams a much clearer link between spend and business output.
Budget planning
You can set budgets at business-unit, product, or team level, then track actuals against forecasts in near real time.[80][81] Finance teams get views into cost per customer and gross margin impact, while engineering can drill into cost per deployment or per service.[75][76]
Alerts and scheduled reports can be sent through email or Slack, which makes sharing GBP-based summaries fairly simple for UK teams.[76][83]
Anomaly signals
Anomaly detection starts as soon as you connect a cost source. There’s no need to set manual thresholds first.[77][85] CloudZero compares the past 36 hours of hourly spend with 12 months of history, then adjusts thresholds automatically based on trailing 30-day spend.[86][88][82]
Alerts go to the right team through Slack, email, or Google Chat. The platform also suppresses expected cost changes during deployments, which helps cut false positives.[84][86][87] For fast-growing UK startups, where cost baselines can shift from one month to the next, that auto-recalibration can save a lot of noise.
Multi-cloud and reporting
CloudZero pulls in spend from more than 50 providers, including AWS, Azure, Google Cloud, Kubernetes, Snowflake, and AI platforms such as OpenAI and Anthropic, into a single cost model.[71][75][76] Different teams then get dashboards built for their needs, from per-cluster Kubernetes costs to cloud COGS and gross margin views.[75][76][83]
Pricing is quote-based and tied to managed cloud and AI spend.[89] Typical contracts sit at around £8,000–£12,000 per year for companies with £800,000–£1 million in annual cloud spend, and around £55,000–£60,000 per year for those spending £8 million–£10 million.[90][91]
In practice, CloudZero fits best when finance and engineering both need the same cost-to-value picture, rather than a basic spend forecast alone.
6. CAST AI
CAST AI is built for Kubernetes cost control and automation. It works across Amazon EKS, Google GKE, Azure AKS and OpenShift in one management layer. So if Kubernetes is the main source of spend uncertainty, this is where CAST AI fits best.
If your estate goes well beyond Kubernetes, you'll likely need other tools alongside it.[93][95]
Forecast methods
After you connect a cluster, CAST AI produces monthly and month-end forecasts at cluster, namespace and workload level.[92] Its optimisation models look at rightsizing, bin-packing and spot capacity opportunities against current pricing in AWS, Azure and Google Cloud.[92][93][94]
That matters because Kubernetes costs can drift in quiet ways. A cluster might look fine on the surface, while idle capacity, poor pod placement or the wrong mix of spot and on-demand nodes quietly push the bill up.
CAST AI says its benchmark across production clusters shows a 43% average compute cost reduction when teams use autonomous optimisation.[100]
Budget planning
CAST AI breaks spend down by cluster, namespace, workload and tag, with hourly, daily, weekly and monthly views.[93] That gives finance and engineering teams a shared view of where money is going, instead of two groups working from different numbers.
Teams can map spend to internal cost centres and compare current costs with past baselines.[93][96] The platform also shows monthly forecasts and projected savings estimates, which helps budget owners plan against an optimised cost curve rather than today's baseline.[92][97]
For UK teams putting together quarterly or annual budgets, this makes scenario planning much easier. You can model growth in CPU or GPU usage and show the board both current spend and projected savings in GBP.[93][96]
Anomaly signals
CAST AI turns on cost monitoring as soon as a cluster is connected, so teams get immediate visibility into spend trends and usage patterns.[92] It flags issues like unexpected node count increases, sudden jumps in namespace costs, or unusual shifts in the spot/on-demand mix.[93][98]
It also simulates possible savings from automation. That can make expensive resource choices stand out fast, especially when current settings cost far more than an optimised setup.[98][99] In practice, this helps teams catch misconfigured autoscaling or runaway jobs before the bill snowballs.
Multi-cloud and reporting
CAST AI gives teams a single dashboard across connected Kubernetes environments, no matter which cloud provider they use.[93][96] You can compare AWS, Azure and Google Cloud clusters in one view, with breakdowns by workload and tag.[93]
Its OMNI feature can span clusters across regions and clouds, which is handy for organisations reviewing workload placement.[101][102]
Pricing starts with a free cost-monitoring tier for visibility and forecasting. Paid automation starts at around US$1,000 per month for the Growth plan, with custom Enterprise pricing for larger estates.[103][104][105] CAST AI does not natively convert figures into GBP, so UK finance teams need to apply their own FX rates before rolling the numbers into management accounts.
For teams that want provider-native forecasting instead of a Kubernetes-first layer, the next section looks at built-in cloud tools.
7. Native cloud provider forecasting (AWS, Azure, and Google Cloud)
For single-cloud estates, AWS, Azure and Google Cloud each include free forecasting tools in their billing consoles.[128][131][119] That makes them a solid starting point. You can get spend forecasts, set budgets, and spot unusual cost changes without buying another platform.
The trade-off is simple: they work best when your team lives in one cloud. Once you spread across more than one provider, the reporting starts to feel narrow.
Forecast methods
AWS Cost Explorer can forecast up to 18 months ahead. Azure Cost Management shows forecasted spend inside Cost Analysis. Google Cloud Billing forecasts costs up to 12 months ahead at billing-account, project, service, or SKU level.[125][127][131][116][117][118]
AWS has also added AI-powered explanations through Amazon Q in Cost Explorer.[126][130] That can help when someone asks, “Why did spend jump this month?” without forcing you to dig through every line item by hand.
For one cloud, these tools do the job. For many clouds, they don’t give larger teams the level of reporting they usually want.
Budget planning
All three platforms support budgets with threshold-based alerts. They can also warn you when forecasted spend suggests a budget overrun.[106][108][113][107][110][111][114][115]
They display costs in GBP and fit monthly or quarterly reporting. But there’s a gap for finance teams in the UK: they do not model UK fiscal calendars or VAT. So if you need statutory reporting, you still have to export the data and handle that part elsewhere.
Anomaly signals
AWS Cost Anomaly Detection learns a normal spend profile and alerts you when daily spend moves away from that pattern, without needing manual thresholds.[129][132][133] You can still set a minimum impact threshold, such as £40–£50, to cut down noise.[107][109][110]
Azure surfaces anomalies through Insights and Smart views in Cost Analysis. It compares spend against a typical 60-day usage pattern.[106][112][124]
Google Cloud monitors spend hourly and has added early anomaly detection for AI workloads, where costs can shift fast.[114][121]
That difference matters. A slow-moving storage bill is one thing. An AI workload can burn through budget far faster, so hourly checks are a lot more useful there.
Multi-cloud and reporting
The biggest limit of native tools is that each one is single-cloud only.[110][112][114] If your team uses more than one provider, you’ll need a separate consolidation layer for foreign exchange handling and cost-centre mapping.
The table below breaks the three tools out by forecast horizon, anomaly style, and cloud scope.
| Feature | AWS | Azure | Google Cloud |
|---|---|---|---|
| Forecast horizon | Up to 18 months (monthly); up to 3 months (daily) | Forecast shown in Cost Analysis when enough data exists | Up to 12 months |
| Forecast basis | Up to 36–38 months of history | Historical usage data | Historical cost trends |
| Forecast-based alerts | Yes | Yes | Yes |
| Anomaly detection | ML-based, no manual threshold required | 60-day pattern baseline | ML-based, hourly |
| Multi-cloud support | No | No | No |
| Cost | Free | Free | Free |
In the buying-priority comparison below, native tools are the lowest-friction option for single-cloud teams.
Head-to-head comparison by buying priority
The table below turns the seven profiles into a shortlist shortcut. Use it to narrow the field fast, then use the notes that follow to weigh the trade-offs.
| Platform | Forecast strength | Budget planning & board packs | Anomaly signal quality | Multi-cloud & FinOps reporting | Typical UK spend bands (monthly) |
|---|---|---|---|---|---|
| Anodot | High – ML-led forecasting with hourly refreshes [4][2][10] | Strong – scheduled reports fit quarterly planning [5][8] | High – real-time, AI-driven detection [7][134] | Strong – AWS, Azure and GCP in one view [134] | £50,000–£1,000,000+ |
| IBM Apptio Cloudability | High – watsonx-based intelligent forecasting [17][18][20] | Very strong – hierarchical budgets, unit economics, chargeback [17][18][25] | High – anomaly detection paired with forecasting [20][25] | Strong – multi-cloud governance and organisational views [33][135] | £250,000–£1,000,000+ |
| VMware Tanzu CloudHealth | High – ML forecasting up to 36 months [38][50][52] | Strong – fiscal-year budgets, chargeback, policy automation [38][43] | High – multi-algorithm detection cuts false positives [52] | Very strong – AWS, Azure, GCP and hybrid/on-premises [38][50] | £250,000–£1,000,000+ |
| Vantage | Medium – more alert-led than forecast-led [57][58] | Moderate – budget and cost alerts are simple to set up [57][58] | Medium – clear alerts that suit engineering teams [57][58] | Good – multi-cloud with practical FinOps reporting [57][58] | £50,000–£250,000 |
| CloudZero | Medium – led more by cost intelligence than forecasting | Moderate – useful for day-to-day cost tracking | High – granular, real-time signals for engineering-led teams | Good – practical multi-cloud visibility | £50,000–£250,000 |
| CAST AI | Medium – more focused on infrastructure efficiency than forecast modelling | Moderate – less suited to finance-led reporting | Medium – operational signals rather than board-level reporting | Limited – narrower scope than broader FinOps suites | £10,000–£250,000 |
| Native cloud provider tools (AWS, Azure, Google Cloud) | Low–Medium – trend-based, single-cloud alerting [123][136][106][138][122][107] | Basic – threshold alerts help, but board packs need export and rework [123][136][137][108][106][120][122][139] | Medium – useful, but only within one cloud [107][123][136][138] | None – no cross-provider roll-up [110][112][114] | £10,000–£50,000 |
Which platforms have the strongest AI or ML forecasting
Anodot, IBM Apptio Cloudability, and VMware Tanzu CloudHealth sit at the top for forecasting. They’re the best fit when cloud spend moves around a lot and finance teams need more than a simple trend line.
Native tools come last here. AWS Budgets, Azure Cost Management and Google Cloud Billing can work well for stable single-cloud workloads, but they’re less dependable when spend changes fast or usage jumps from one month to the next.
Which tools work best for budget planning and board reporting
For finance-led teams, forecast depth isn’t the only thing that matters. The bigger issue is whether the output can go straight into a board pack without a lot of cleanup.
That’s where Cloudability and Tanzu CloudHealth stand out. Both offer hierarchical budgets, showback or chargeback reporting, and unit economics views [17][18][25][38][43]. Anodot follows closely behind, helped by scheduled reports that line up well with a quarterly review cycle [5].
Which platforms give the most useful anomaly signals
Forecasts are only as good as the data feeding them, so anomaly quality matters a lot. Tanzu CloudHealth looks strongest here, thanks to its multi-algorithm approach, which helps cut false positives [52]. That matters because too many noisy alerts get ignored fast.
Anodot and Cloudability both combine anomaly detection with forecasting [4][20][25]. CloudZero and Vantage are better suited to teams that want fast, granular signals, especially in engineering-heavy setups, rather than polished board reporting. Native tools are fine for single-cloud estates, but they work best when you set a sensible impact threshold so every small spike doesn’t trigger an alert [107].
Which options balance multi-cloud coverage with FinOps reporting
Once a team runs across more than one cloud, breadth starts to matter just as much as reporting depth. Tanzu CloudHealth has the broadest scope of the group, reaching into on-premises and hybrid environments as well as public cloud [38][50].
Anodot's Umbrella module gives cross-cloud visibility across the three main providers [134]. Cloudability mixes multi-cloud data with organisational views and unit economics [33][135], which makes it a strong fit for teams that need both finance and operating detail in the same place. CAST AI has the narrowest scope of the seven, while native tools stay single-cloud by design.
Pros and cons of each platform
Where each platform stands out
This section turns the shortlist into a simple fit-and-risk view.
Anodot stands out for high-accuracy forecasting and real-time anomaly detection when cloud spend is volatile. In vendor-reported tests, its forecast accuracy reached 98.5%.[6]
IBM Apptio Cloudability is a strong pick for finance-led governance, though it takes more work to get up and running.
CloudHealth suits large organisations that need governance across complex estates, but its broad scope can slow procurement and rollout.
Vantage fits teams that want a fast rollout and lower day-to-day overhead.
CloudZero works best for product-led teams. It is a weaker fit for finance teams that put forecasting first.
CAST AI is the best fit when Kubernetes cost reduction is the main goal, with automation and rightsizing doing much of the work.
Native tools make sense for single-cloud use with little friction, but they still fall short on cross-provider reporting.
Where each platform falls short
Those same strengths also set the limits.
The main constraint for each platform is below.
| Platform | Main limitation | Worth noting |
|---|---|---|
| Anodot | Custom, quote-based pricing; can be more than basic budgeting teams need[140][141] | Better suited to medium and large organisations with higher cloud spend |
| IBM Apptio Cloudability | Heavier to implement; less aligned with engineering workflows; likely overkill for smaller teams[144][145] | Stronger fit for enterprise finance and governance use cases |
| VMware Tanzu CloudHealth | Broad platform scope and enterprise procurement can slow adoption for smaller organisations[145] | Best for large, multi-cloud estates |
| Vantage | Less depth for formal chargeback, showback or complex governance[143][145] | Lighter on finance-led controls |
| CloudZero | Less suited to organisations that want traditional forecasting or broad infrastructure governance first[145] | Narrower fit outside SaaS and product-led contexts |
| CAST AI | Narrower scope than full FinOps suites; less suited to board-level reporting or finance-led planning[142][143] | Kubernetes-first, not FinOps-first |
| Native tools (AWS, Azure, GCP) | No cross-cloud roll-up; AWS forecasts use an 80% prediction interval and need enough history to generate at all[126][131] | Free or included, but limited for complex estates |
Native tools are free or low-cost, which is part of the appeal. But that lower price comes with a trade-off: they stay locked to one cloud and don’t do much for teams that need one view across AWS, Azure, and GCP.
Conclusion
The right platform comes down to three things: how complex your estate is, how much detail you need in reporting, and how tightly you need to control spend.
Across the seven platforms reviewed, the main factors are AI forecasting accuracy, budget planning depth, anomaly signal quality, and multi-cloud FinOps reporting.
For smaller UK teams, the decision often comes down to unit economics, lower starting cost, and how much reporting work the tool adds. For many UK startups and scale-ups, Vantage or CloudZero tend to be the best fit when unit economics and low overhead matter most.
For container-heavy estates, the focus changes. You need workload-level visibility, not just top-line cost charts. Kubernetes-heavy teams need pod- and namespace-level cost visibility, along with idle capacity detection. In that case, it makes more sense to choose a Kubernetes-first platform instead of a general-purpose dashboard.
For larger enterprises, the picture shifts again. If governance, chargeback, and hybrid or multi-cloud needs sit near the top of the list, IBM Apptio Cloudability or VMware Tanzu CloudHealth are often the better fit. That’s especially true when shared reporting across finance and engineering is a core need.
Where internal teams need implementation support, Hokstad Consulting provides cloud cost engineering and AI strategy services.
FAQs
How do I choose the right platform?
Choose the platform that fits your setup, your team’s day-to-day work, and your FinOps maturity. Start by comparing your cloud environment - whether that’s hybrid, multi-cloud, or Kubernetes-based - against what each tool does best, like cost allocation, unit economics, or CI/CD integration.
Put extra weight on real-time reporting, automated anomaly alerts, and native GBP (£) support. It’s also smart to run a 30-day pilot with clear goals, such as cutting monthly spend, so you can see if the platform works well for both engineering and finance.
When are native cloud tools enough?
Native cloud tools are often enough for organisations at the start of their cloud cost management journey, especially when workloads are stable and spend is fairly easy to predict.
They give teams a solid starting point for tracking long-term trends and spotting seasonal patterns without adding extra tools too early.
Take AWS Cost Explorer as an example. It offers up to 38 months of historical analysis, 18-month forecasts, and AI-driven explanations. For many teams, that’s more than enough to get a clear view of where money is going.
As needs get more complex, these tools still matter. They often act as a useful baseline before teams move on to more advanced capabilities.
Which tool suits Kubernetes-heavy spend?
Kubecost is a strong fit for organisations with heavy Kubernetes spend. It gives you granular cost tracking at the namespace, deployment, service, and pod level across multi-cluster and multi-cloud setups. That makes it a good option for precise showback and chargeback.
CAST AI is also well suited to Kubernetes, with a focus on automated workload rightsising and scaling. Harness, CloudZero, Vantage, and Finout also give teams solid visibility into Kubernetes costs.