
StatefulSets in Kubernetes are designed for managing stateful applications like databases and distributed systems. Unlike stateless workloads, they have unique requirements: stable network identities, persistent storage, and ordered operations. Monitoring them effectively requires a different approach, focusing on per-Pod visibility, storage health, and sequential deployment tracking.
Key Takeaways:
- Metrics to Track: Monitor replica discrepancies (
spec.replicasvsstatus.readyReplicas), storage capacity (kubelet_volume_stats_used_bytes), and Pod readiness (kube_statefulset_status_replicas_ready). - Storage Monitoring: PersistentVolumes must be checked for capacity, I/O performance, and potential orphaned volumes.
- Application Health: Use readiness, liveness, and startup probes to ensure Pods are functioning correctly and updates proceed in order.
- Observability Setup: Combine kube-state-metrics, Prometheus, and Fluent Bit for metrics and logging. Optimise costs by filtering unnecessary metrics and logs.
- Cost Management: Avoid orphaned volumes, optimise resource requests, and use cost-efficient storage classes.
This guide walks you through monitoring strategies, observability design, and cost-saving tips to ensure reliable StatefulSet operations in Kubernetes.
Kubernetes Monitoring 101: A Practical Walkthrough
Key Metrics and Health Checks for StatefulSets
Monitoring StatefulSets effectively means paying attention to three key areas: Kubernetes-level metrics, which give you a snapshot of workload status; storage metrics, which highlight I/O performance and capacity issues; and application-specific health checks, which ensure your service is running as expected. Each layer offers a unique perspective on the health of your deployment. Below, we dive into the Kubernetes metrics that provide insight into StatefulSet operations.
Kubernetes Metrics for StatefulSets
Start by tracking replica discrepancy - the difference between spec.replicas (desired replicas) and status.readyReplicas (healthy, running replicas). This gap points to potential deployment issues. You can track this using the kube_statefulset_status_replicas_ready metric from kube-state-metrics [6].
Pay attention to rollout progress by monitoring revision fields like currentRevision and updateRevision. Ensure that status.observedGeneration matches metadata.generation to catch rollout delays or controller lags [2][6]. For example, if a pod such as postgres-1 fails its readiness probe, it could block updates to subsequent pods due to StatefulSet's sequential update policy.
To spot pods stuck in a crash loop, monitor the kube_pod_container_status_restarts_total metric. A rapidly increasing restart count usually signals a pod in a CrashLoopBackOff state [8]. Another critical indicator is termination latency. Pods lingering in a Terminating state for over five minutes often point to issues with graceful shutdowns or node connectivity [7].
Also, be mindful of the default revisionHistoryLimit, which retains 10 historical ControllerRevisions for rollbacks. Adjust this to a range of 5–10 to balance rollback flexibility with API server performance [1][2].
With these Kubernetes metrics in mind, let’s move on to storage and I/O monitoring.
Storage and I/O Metrics
Storage monitoring focuses on capacity, I/O performance, and volume health. Use metrics like kubelet_volume_stats_used_bytes and kubelet_volume_stats_capacity_bytes to track how much storage each PersistentVolume is using [9][12]. Set alerts for when capacity usage exceeds 80% for more than 10 minutes [12].
I/O performance metrics, such as disk IOPS and latency, are equally important. High latency or saturated IOPS can cause noticeable slowdowns in stateful applications, like delayed database queries or backlogs in message queues, even if CPU and memory usage appear fine [9].
For deeper volume health insights, enable the Container Storage Interface (CSI) health monitoring feature. The kubelet_volume_stats_health_status_abnormal metric provides a binary gauge - 1 for unhealthy volumes and 0 for healthy ones [10]. Ensure the CSIVolumeHealth feature gate is active to receive abnormal condition alerts on PVCs or Pods [10].
PVC retention policies also require attention. The kube_statefulset_persistentvolumeclaim_retention_policy metric tracks whether PVCs are set to be deleted or retained during scale-down or deletion events [6]. Misconfigurations here can either lead to accidental data loss or orphaned volumes, which can rack up unnecessary storage costs.
After ensuring your storage is in good shape, the next step is to align your application health checks with these metrics.
Application Health Monitoring
Kubernetes offers three types of probes for monitoring application health: Startup, Liveness, and Readiness. Each serves a specific purpose. Use startup probes for applications that take a long time to initialise, readiness probes to manage service traffic and rollout sequencing, and liveness probes to detect unrecoverable states. Set liveness probes with a higher failure threshold to avoid triggering unnecessary restarts [1][3][13].
Readiness probes are particularly crucial for StatefulSets. They govern service traffic routing and rollout sequencing. By default, StatefulSets use the OrderedReady policy, which means the controller waits for each pod to pass its readiness check before creating the next one in the sequence [1][3]. For instance, if mysql-1 fails its readiness probe, the rollout will pause, preventing mysql-2 from starting. This ensures orderly scaling and updates.
Liveness probes should only trigger restarts for critical issues like deadlocks or memory corruption. Keep health check endpoints lightweight, as the kubelet processes only the first 10 KiB of HTTP responses [13].
For domain-specific insights, monitor metrics tailored to your application type. For databases, track replication lag between primary and replica pods. For message queues, keep an eye on backlog depth and consumer lag. In distributed systems like Cassandra or ZooKeeper, ensure quorum is maintained - losing too many pods can render the cluster unusable. Additionally, use the .spec.minReadySeconds field to define a “soak time” for pods. This ensures a pod remains healthy for a set period before the StatefulSet controller considers it available and moves on to the next pod in the update process [1].
Building an Observability Architecture for StatefulSets
::: @figure 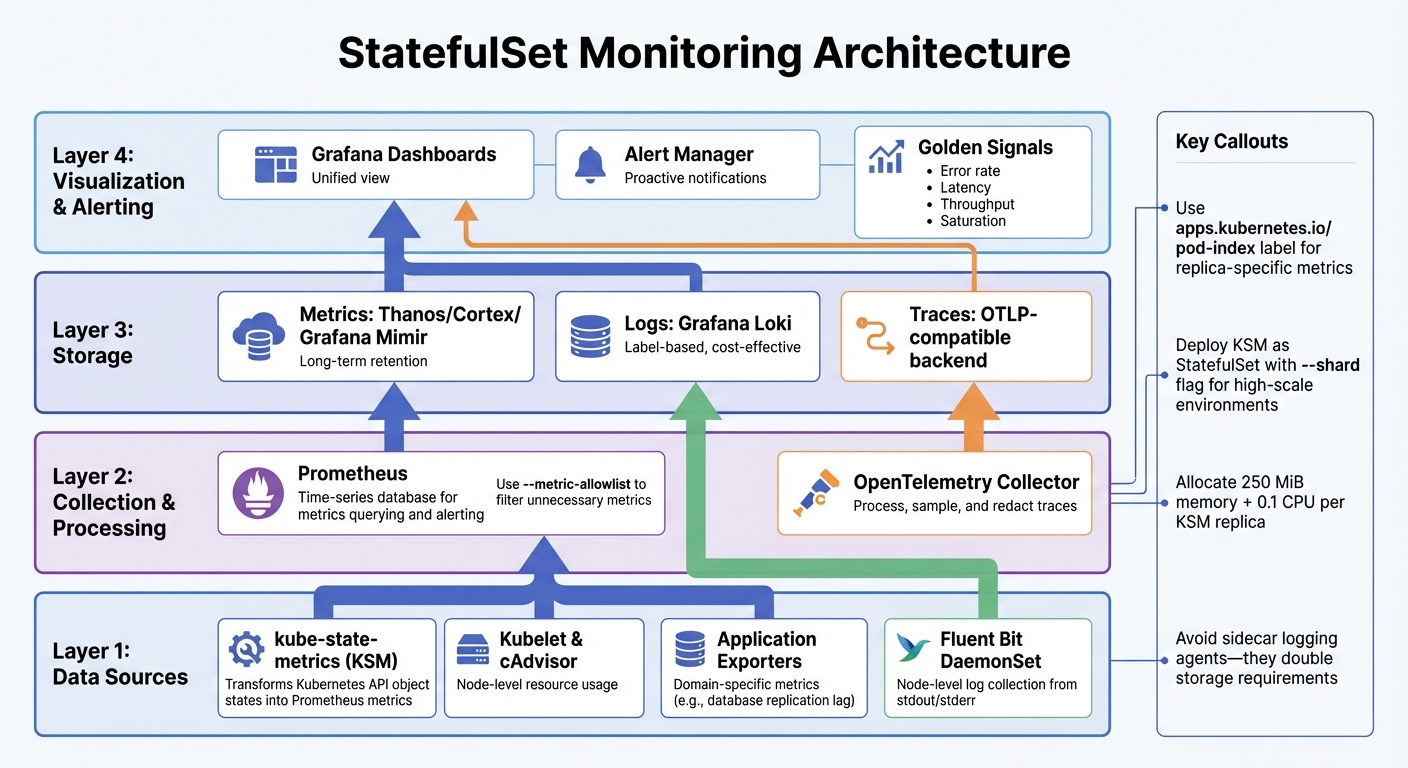 {StatefulSet Monitoring Architecture: 4-Layer Observability Stack}
:::
{StatefulSet Monitoring Architecture: 4-Layer Observability Stack}
:::
Expanding on the earlier discussion of key metrics and health checks, let’s dive into how to create a cohesive observability setup tailored for StatefulSets. Observability here combines metrics, logging, and tracing, aiming to track system health without breaking the bank. The key challenge is capturing meaningful signals without overloading your infrastructure or overspending. Below, we’ll explore how to design a metrics pipeline that balances detail with efficiency.
Metrics Pipeline for Stateful Applications
A solid metrics pipeline for StatefulSets typically relies on four components:
- kube-state-metrics (KSM): Transforms Kubernetes API object states (e.g., replica counts, pod phases) into Prometheus-compatible metrics.
- Kubelet and cAdvisor: Provide insights into node-level resource usage.
- Application-specific exporters: Capture domain-specific metrics like database replication lag.
- Time-series database (e.g., Prometheus): Enables querying and alerting based on collected metrics [14][15].
Kube-State-Metrics is a key component to include in your Kubernetes monitoring strategy because it lets you make decisions based on the states of objects you've created.– James Walker [15]
To link metrics to specific StatefulSet instances, use the apps.kubernetes.io/pod-index label, available since Kubernetes v1.32. This label helps identify metrics for specific replicas like web-0 or web-1 [1]. In high-scale environments, deploy kube-state-metrics as a StatefulSet itself, utilising the --shard and --total-shards flags to distribute processing across multiple pods [15]. For stable performance, allocate at least 250 MiB of memory and 0.1 CPU core per replica [15].
Once the metrics pipeline is in place, the next step is to focus on centralised logging for deeper, replica-specific insights.
Centralised Logging and Correlation
For containerised workloads, writing logs to stdout and stderr is a practical approach, as these streams are natively handled by the kubelet [17]. To efficiently gather logs from all pods, deploy a node-level logging agent like Fluent Bit as a DaemonSet [14][17]. Avoid using sidecar-based logging agents unless absolutely necessary - they double storage requirements and make logs inaccessible through kubectl logs [17].
The pod-index label is invaluable for correlating logs with specific StatefulSet replicas [1]. This is especially useful for troubleshooting distributed systems, where pinpointing issues to a particular replica is crucial. For tracing, Kubernetes 1.35 supports exporting spans via OpenTelemetry Protocol (OTLP). Deploy an OpenTelemetry Collector to process, sample, and redact traces before sending them to your backend - this step helps control costs in high-traffic setups [14].
Cost management is another critical aspect of observability. Let’s look at how to optimise your design to keep expenses in check.
Cost-Optimised Observability Design
Observability can quickly become expensive if not carefully managed, especially with the overhead of monitoring and operational costs. To keep costs under control:
- Use the
--metric-allowlistflag in kube-state-metrics to collect only the metrics you need for dashboards and alerts [15][18]. - Filter namespaces using
--namespacesor--namespaces-denylistto focus on production monitoring and avoid unnecessary metrics [15]. - Set strict CPU and memory limits for kube-state-metrics, ensuring CPU limits are not so low that they throttle processing [15].
The CPU limit setting is especially important, as low limits will cause throttling that prevents Kube-State-Metrics from processing its work queue fast enough.– James Walker, Spacelift [15]
For long-term metric retention, consider distributed storage solutions like Thanos, Cortex, or Grafana Mimir to complement Prometheus [14]. For logs, label-based storage systems like Grafana Loki are a cost-effective alternative to full-text search engines, reducing indexing overhead [14]. Keep an eye on the kube_statefulset_persistentvolumeclaim_retention_policy metric to avoid accumulating unused volumes when StatefulSets are deleted or scaled down, which can unnecessarily inflate storage costs [6].
Need help optimizing your cloud costs?
Get expert advice on how to reduce your cloud expenses without sacrificing performance.
Best Practices for StatefulSet Operations and Monitoring
This section dives into effective strategies for deploying and managing StatefulSets in production environments. These approaches aim to ensure reliability and minimise risks like downtime or data loss.
Deployment Strategies
StatefulSets rely on rolling updates by default, but careful configuration is key to avoiding disruptions in stateful applications. For example, the .spec.updateStrategy.rollingUpdate.partition parameter enables canary-style updates by limiting updates to pods with higher ordinal numbers. If you set partition: 2 in a StatefulSet with three replicas, only pod-2 will be updated initially. This allows you to test the new version before rolling it out to the remaining pods [1].
The .spec.minReadySeconds setting ensures pods are stable before the update process moves forward [1]. For applications with lengthy initialisation times, such as databases, you can use StartupProbes to delay readiness and liveness checks, reducing unnecessary restarts [22].
Pod management policies dictate how pods are created and terminated. The default OrderedReady policy creates pods sequentially (0 to N-1) and terminates them in reverse order (N-1 to 0). This behaviour is crucial for systems with strict startup and shutdown requirements, such as MongoDB or Kafka [1]. On the other hand, if you're deploying independent instances - like several standalone SQL Server databases - podManagementPolicy: Parallel allows simultaneous creation and termination of pods [20].
| Policy | Behaviour | Best Use Case |
|---|---|---|
| OrderedReady (Default) | Sequential creation (0 to N-1) and reverse termination (N-1 to 0) | Systems needing strict startup/shutdown order (e.g. MongoDB, Kafka) [1] |
| Parallel | Simultaneous creation and termination | Independent instances (e.g. SQL Server) [20] |
For stable DNS and peer discovery, pair StatefulSets with Headless Services by setting clusterIP: None [19]. When deleting a StatefulSet, scale it down to 0 replicas first to ensure pods terminate gracefully in the correct reverse order [1].
Lastly, ensure your backup and resilience plans are robust enough to safeguard data integrity after deployment.
Backup, Recovery, and Resilience Monitoring
When it comes to backup and recovery, two key metrics to keep in mind are Recovery Time Objective (RTO) and Recovery Point Objective (RPO). Achieving a sub-hour RTO often requires synchronous replication, which may increase storage costs but helps minimise data loss [5]. Regularly monitor backup completion times and snapshot frequencies to confirm your system can meet these targets.
Latency consistency matters more than average latency. A database with a 500-microsecond average latency but occasional 50-millisecond spikes performs worse than one with consistent 1-millisecond latency.– Pure Storage [5]
For distributed systems with built-in replication, like MongoDB ReplicaSets, you can optimise snapshots by focusing on a single replica to avoid redundancy [21]. Additionally, ensure your storage system supports immutable snapshots that cannot be deleted via API calls, even with admin credentials. This is a critical safeguard against ransomware attacks [5].
Use Pod Disruption Budgets (PDBs) to maintain a minimum number of replicas during voluntary disruptions, such as node maintenance [11]. To monitor rollouts effectively, track metrics like kube_statefulset_status_replicas_ready and kube_statefulset_status_replicas_available. Discrepancies between these metrics can signal issues, such as pods running but failing health checks [6].
Beyond deployment and recovery, efficient capacity planning and cost management are essential for long-term success.
Capacity Planning and Cost Management
Historical metrics are a powerful tool for predicting storage and compute needs. Keep an eye on PVC retention policies to avoid orphaned volumes [2]. The persistentVolumeClaimRetentionPolicy field, stable from Kubernetes v1.32, allows you to set whenScaled: Delete, which automatically removes PVCs when a StatefulSet is scaled down [2].
To balance performance and cost, define multiple StorageClasses. For instance:
- Use
fast-ssd
for active databases. - Opt for
standard
for general workloads. - Reserve
archive
for long-term retention.
Persistent storage typically costs between £0.08 and £0.16 per GB per month, while ephemeral storage is included with compute costs [5]. For non-critical data like caches or temporary files, ephemeral storage is a cost-effective option.
For production workloads, set CPU and memory requests equal to their limits to ensure Guaranteed Quality of Service (QoS). This prevents critical pods, such as databases, from being evicted during resource contention and ensures consistent performance [20]. Keep revisionHistoryLimit between 5 and 10; while the default of 10 provides rollback options, it can create metadata overhead for frequently updated workloads [1].
If you're using a HorizontalPodAutoscaler (HPA), avoid manually setting the .spec.replicas field in your manifest to prevent conflicts with the autoscaler [1]. Finally, monitor the gap between kube_statefulset_status_replicas_ready and kube_statefulset_replicas to identify scaling issues or persistent pod failures [6].
Cost-Aware Monitoring and Automation for StatefulSets
Reducing Monitoring Overhead
Cutting down on monitoring costs starts with effective observability. One major factor driving these costs is high cardinality - essentially, the number of unique label combinations in your metrics. As highlighted in Amazon EKS Best Practices:
Higher cardinality results in larger metric telemetry data size and storage needs which increases cost[23].
To manage this, aggregate metrics at the cluster level and drop unnecessary labels like namespaces or container IDs. For instance, Google Cloud's Managed Service for Prometheus simplifies this with its ClusterPodMonitoring resource. This pre-configured setup focuses on key objects like kube_statefulset, kube_pod, and kube_persistentvolume, trimming ingestion costs while maintaining essential health dashboards [16].
Another way to reduce costs is by setting log levels to ERROR or FATAL in production environments to minimise noise. Tools like Fluent Bit, which is more resource-efficient than Fluentd, can filter out redundant Kubernetes metadata before logs reach your backend [23]. For UK organisations dealing with GDPR compliance, consider tiered log retention: keep logs in Hot
storage for 30 days for quick access, then move them to more affordable long-term storage solutions like Amazon S3 [23]. Keep in mind that Amazon CloudWatch retains logs indefinitely by default, which can lead to unexpected storage costs unless adjusted manually [23]. As of 5th September 2023, Amazon EKS logs qualify as Vended Logs
, making them eligible for volume discount pricing in CloudWatch [23].
You can also optimise metrics collection by increasing Prometheus scrape intervals for non-critical data from 15 to 60 seconds. Use metric_relabel_config to filter out high-volume, low-value metrics like container_network_tcp_usage_total [23]. For tracing, Tail Sampling
is a smart approach - it lets you decide which traces to keep (e.g., those with errors or high latency) after the request is completed, rather than sampling randomly at the start [23].
These strategies not only cut costs but also form a solid foundation for automating observability, as outlined below.
Automating Monitoring and Reporting
Streamline your monitoring setup by embedding definitions directly into Infrastructure as Code (IaC). This allows you to deploy Prometheus rules and Grafana dashboards automatically [4]. Using the Operator pattern, you can manage monitoring more effectively by isolating monitoring code in a dedicated /monitoring subfolder. This simplifies maintenance and ensures consistency across custom resources [24]. Additionally, tools that auto-discover Kubernetes resources can apply pre-configured dashboards and alerts, saving time and effort [4].
To optimise storage, automate the deletion of Persistent Volume Claims (PVCs) using persistentVolumeClaimRetentionPolicy. Keep an eye on unused Persistent Volumes (PVs) to avoid wasting resources [1][4]. Testing is equally important - include unit and end-to-end tests to ensure alerts and metrics are accurate, relevant, and don’t trigger unnecessary noise during cluster upgrades [24].
For organisations that need extra support, expert consulting services can help implement these practices effectively.
Where Hokstad Consulting Can Help
Hokstad Consulting offers tailored solutions to help organisations optimise their observability systems for StatefulSets. Their expertise includes automating PVC cleanups, fine-tuning Prometheus scrape settings to lower cardinality, and embedding monitoring definitions into IaC pipelines. They also conduct cloud cost audits to identify inefficiencies like orphaned storage volumes or excessive metric ingestion, often reducing cloud expenses by 30–50%.
What sets Hokstad Consulting apart is their No Savings, No Fee
model - organisations only pay a percentage of the savings achieved. Whether you’re looking for ongoing support or a one-time audit, they provide customised solutions for public, private, and hybrid cloud setups. With their help, UK organisations can build cost-efficient observability systems without upfront investment.
Conclusion
Monitoring StatefulSets requires a different lens compared to stateless workloads. Their reliance on persistent storage, stable network identities, and sequential deployments calls for a tailored strategy. This guide has highlighted key metrics and practical steps to help you achieve effective monitoring. As Abhilash Warrier from eG Innovations wisely notes:
If you forget the monitoring angle and leave your Kubernetes environment unmonitored, you will know about the problems/issues only after they have occurred. It would be too late by then, and the damage would already have happened.[25]
To stay ahead of potential issues, aim for comprehensive observability across your stack - from infrastructure and platform layers to application health. Leverage proactive Golden Signals alerts [4] and focus on StatefulSet-specific metrics by using tools like kube-state-metrics, ensuring you also monitor storage I/O for consistency.
Operational practices play a crucial role in maintaining system resilience. Keep an eye on PVC retention policies to prevent orphaned volumes from piling up, and use clear labelling to organise your cluster data effectively [25].
Cost management is equally important. Simplify your monitoring by reducing metric cardinality, filtering high-volume data, and automating PVC cleanups. These steps not only cut down on observability expenses but also support the overall reliability of your StatefulSet operations. With 83% of large enterprises now running Kubernetes, getting these basics right is critical for long-term success [25].
FAQs
What key metrics should you monitor to ensure StatefulSet performance and reliability?
To keep your StatefulSets running smoothly and reliably, it's important to keep an eye on some key metrics:
- Replica counts: Check if the number of desired replicas matches the number of ready replicas. This ensures all pods are running as they should be.
- Pod readiness: Verify that pods are in a
ready
state, meaning they're operational and able to handle traffic. - Storage usage: Monitor the binding of PersistentVolumeClaims (PVCs) and keep track of storage consumption to prevent capacity-related problems.
- Pod restarts: Watch for frequent pod restarts, as this could indicate issues with stability or resource constraints.
- Rollout status: Pay attention to the current and updated revision numbers to ensure updates are rolling out smoothly without causing disruptions.
By keeping tabs on these metrics, you can get a clear picture of your StatefulSet's health and tackle any problems before they escalate, ensuring your Kubernetes environment remains stable.
How can I reduce costs while maintaining effective monitoring for StatefulSets in Kubernetes?
To keep costs under control while still effectively monitoring StatefulSets, it's all about focusing on the most relevant data. A smart starting point is using kube-state-metrics to track object-level details like replicas, ready pods, and PVC claims. This approach is far less taxing on your monitoring stack compared to scraping every container's /metrics endpoint. Combine this with the three pillars of observability - metrics, logs, and traces - by prioritising metrics for regular checks and reserving logs or traces for when errors arise.
Consistent labelling of StatefulSet pods and PVCs (e.g., app=postgres, tier=stateful) is key for precise service discovery, ensuring you're only monitoring what's truly necessary. To further optimise resource usage, deploy monitoring agents as DaemonSets and opt for lightweight exporters like cAdvisor for node-level metrics, rather than adding sidecars to each pod.
For a more customised solution, you might want to collaborate with specialists like Hokstad Consulting. They can review your monitoring setup, adjust Prometheus retention policies, and craft cost-efficient alerting rules. With their expertise in cloud cost management and DevOps, they can help you strike the right balance between thorough observability and maintaining predictable expenses in pounds sterling (£).
How can I deploy and update StatefulSets in Kubernetes without causing disruptions?
To keep deployments and updates for StatefulSets running smoothly, opt for the RollingUpdate strategy paired with the default OrderedReady pod-management policy. This approach ensures pods are updated one at a time, in sequence, maintaining uninterrupted service.
Implement strong readiness and liveness probes to keep a close eye on pod health. Additionally, set up a PodDisruptionBudget to reduce downtime during updates. Make sure your PersistentVolumeClaims (PVCs) remain unchanged between revisions to prevent data loss. It's also crucial to version your container images, allowing for safe rollbacks if something goes wrong.
By following these steps, you can achieve reliable updates without compromising the stability of your applications.