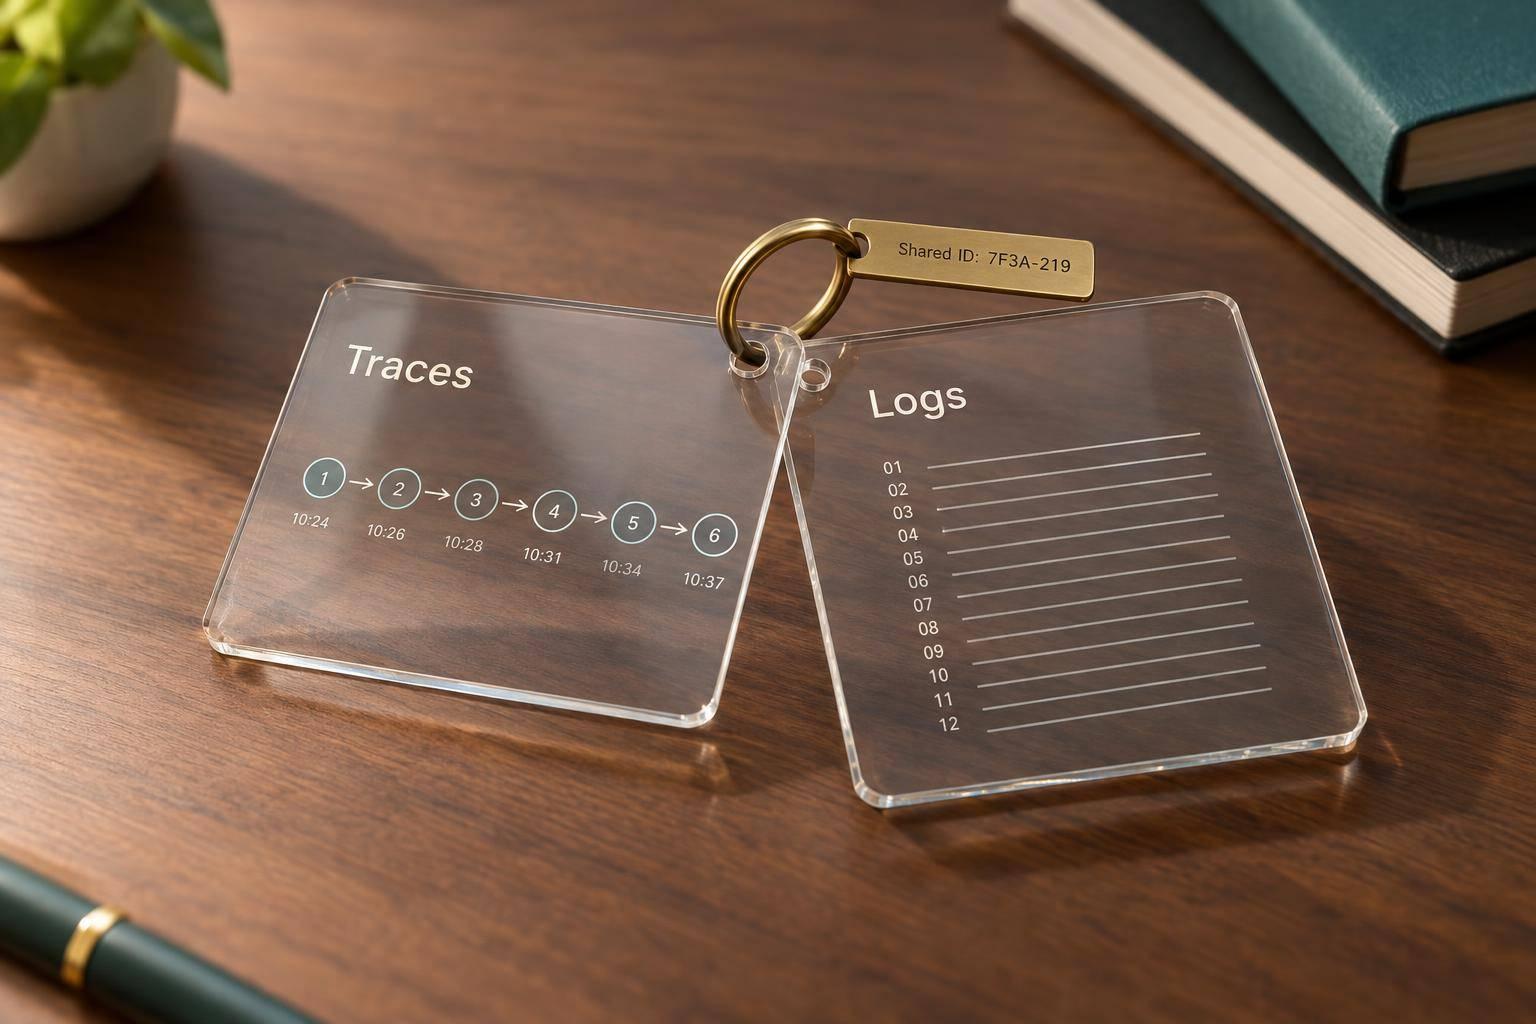
HTTP 200 tells me a tool ran - not that the agent chose the right one. I start by separating three failures: the wrong tool, bad arguments, or a call that wasn’t needed. Then I link selection and execution with shared IDs, rather than matching timestamps.
Here’s what I check:
- Traces: the recorded tool choices, execution order, retries and hand-offs.
- Logs: validation errors, policy checks and reasons for failure.
- Shared IDs: whether the selected tool matches the tool that actually ran.
Quick comparison
| Check | Traces | Logs |
|---|---|---|
| Tool selection | Needs recorded candidates and choice | Needs explicit decision fields |
| Execution flow | Linked spans show sequence and timing | Needs correlation IDs |
| Failure details | Shows where errors occurred | Records rules, exceptions and retry reasons |
| Setup and cost | Context propagation; span volume and sampling | Consistent fields; event volume and indexing |
My starting point is a small decision record: available tools, selected tool, sanitised arguments, versions and outcome. I keep logical call IDs stable across retries, redact sensitive data and set access and retention limits.
The goal is a clear diagnosis, not more telemetry. Once I confirm a wrong-tool choice, I turn it into a regression test and track wrong-tool rate, diagnosis time and cost per successful run in £.
How to Trace and Debug AI Agents in Production
Agent Traces vs Logs: What Each Shows
A structured log can record a tool-selection decision, while a trace span can record validation errors and policy events. The difference comes down to which fields you record and whether you can join them.[2][5]
| Dimension | Traces | Logs |
|---|---|---|
| What it records | Hierarchical spans linking events through timing and parent–child relationships | Discrete events describing decisions, diagnostics and failures |
| Selection visibility | Needs an instrumented selection span or event | Needs explicit selection fields |
| Execution flow | Shows sequence, parallelism, retries and hand-offs | Needs timestamps and correlation fields |
| Searchability | Trace-level filters and span attributes | Exact fields, errors and recurring patterns |
| Sensitive-data risk | Prompts, arguments and results need redaction; sampling may leave out useful context | Payloads, state and stack traces need redaction; unstructured detail is harder to query |
| Instrumentation effort | Context propagation and span design | Consistent schemas and logging discipline |
| Retention | Often shorter or sampled because complete traces can be expensive | Frequently longer, depending on volume and sensitivity |
| Cost | Span volume and high-cardinality attributes | Event volume, ingestion, indexing and storage |
Traces Show Recorded Tool-Selection Paths
Start with what the agent could access when it chose the tool. Record the available-tool snapshot, selected tool, schema versions, sanitised arguments, latency and outcomes. Include the decision source - model, router or fallback - so you can tell model output apart from an application override. Traces show sequence and relationships, not model reasoning or causation.[3]
Check for missing candidates or mismatched registry versions before blaming the model.
Logs Show Diagnostic Details
Structured logs help explain why a choice failed. They record the validation rule, policy check, exception, state or override behind the failure. Stable error codes, alongside tool, model, schema and registry versions, make recurring failures searchable.
Include run_id, trace_id, span_id, tool_call_id and the attempt number. OpenTelemetry supports direct correlation by adding TraceId and SpanId to log records.[2][4]
Where to Start for Each Failure Type
| Failure symptom | Start with | Evidence to inspect |
|---|---|---|
| Wrong tool selected | Trace | Available-tool snapshot, decision source and selected tool versus executed tool |
| Argument-validation failure | Logs, then trace | Failed field, validation rule and schema version linked to the selected call |
| Policy rejection or override | Logs, then trace | Policy result, override reason and affected selection |
| Cross-worker failure | Both | Selection-to-execution links, local state and exceptions |
| Inconsistent retries or hand-offs | Trace, then logs | Attempt links and per-attempt errors |
Missing evidence is not evidence of success. Sampling, redaction or inconsistent field names can hide the cause. Check those gaps before assigning blame.[2][3]
Next, use shared IDs to join selection decisions to execution events, linking each selection event to its execution record.
Link Tool Selection and Execution with Shared IDs
::: @figure 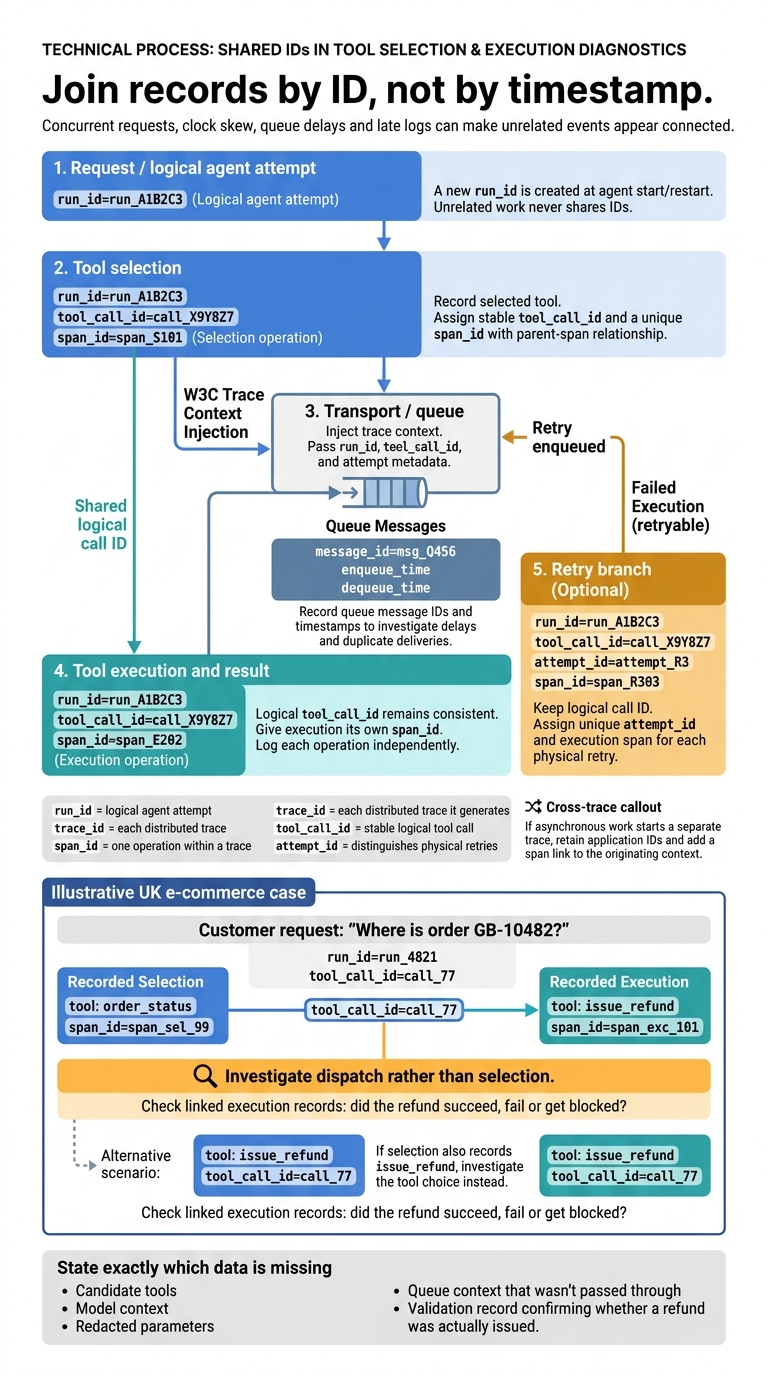 {Debug Agent Tool Calls with Shared IDs}
:::
Join records by ID, not by timestamp. Concurrent requests, clock skew, queue delays and late logs can make unrelated events appear connected. A shared tool_call_id links selection, invocation and result, so you can join the selection path to the execution record across services.[6][7]
Define run_id, trace_id, span_id and tool_call_id
Use run_id for the logical agent attempt, trace_id for each distributed trace it generates and span_id for one operation within a trace. Assign each logical tool call a stable tool_call_id, then use attempt_id to distinguish physical retries. Record parent-span relationships, and define when an agent restart creates a new run so unrelated work never shares IDs.[5][4][2]
Keep tool_call_id unchanged across selection and execution, but give each operation its own span_id. Each diagnostic log should identify its own operation - not copy the selection span’s ID. Then pass these IDs through every hop that could separate selection from execution.
Pass IDs Through Queues and Retries
Inject W3C trace context into outbound requests and queue messages, then extract it in the receiving service. Pass run_id, tool_call_id and attempt metadata through queues, retries and downstream handlers. Keep the logical call ID unchanged on retries, but assign each execution a separate attempt_id and span. If asynchronous work starts a separate trace, retain the application IDs and add a span link to the originating context. Record queue message IDs and enqueue/dequeue timestamps to help explain delays and duplicate deliveries.[7][3][8]
Without stable IDs, it's hard to tell whether the wrong tool was chosen once or replayed many times. With them, you can check the mismatch by joining the records.
Debug a Wrong-Tool Choice
Follow the shared IDs from request to execution. This helps you tell a wrong tool choice apart from an execution linked to the wrong event.
In a UK e-commerce case, a customer asks where order GB-10482 is, but a refund is attempted. Start with
run_id=run_4821, locate the selection span and followtool_call_id=call_77to the execution span and linked logs. Compare requested intent, selected tool and executed tool.The selection says
order_status; the execution showsissue_refund. This mismatch points to dispatch rather than selection. If the selection also recordsissue_refund, investigate the tool choice instead. Check the linked execution records to establish whether the refund succeeded, failed or was blocked.
State exactly which data is missing: candidate tools, model context, redacted parameters, queue context that wasn't passed through, or a validation record confirming whether a refund was actually issued.
Add Observability for Tool Decisions
Once shared IDs link selection to execution, record the decision in a compact event.
Record a Minimum Tool-Decision Event
Create a structured event containing the shared IDs, session/task ID, UTC timestamp, decision time, version references, available tools, selected tool and sanitised arguments. Record validation, policy and authorisation results, along with execution status and the final outcome. Add queue, retry and deployment IDs where relevant. Store timing in spans and diagnostics in logs.[6][5]
Use immutable configuration references or hashes rather than copying full prompts and schemas. Keep the list of available tools, not just the selected one. Treat explanations and confidence scores as metadata - not proof of what caused the decision. Record observable inputs and outputs without collecting private chain-of-thought.
Once the event schema is fixed, set access controls and retention limits.
Limit Payloads, Retention and Access
Separate searchable metadata from large or sensitive payloads. Index low-cardinality fields such as selected tool, validation status, policy result, execution status, environment, model version and deployment release. Avoid indexing prompts, arguments and customer identifiers indiscriminately.
Redact data before export, restrict payload access by role, encrypt stored data and audit access. Document retention periods and deletion rules for each purpose. The UK GDPR does not set a single retention period, so keeping everything is not safer by default.[9][10][11]
Coordinate trace, log and payload sampling so failed runs retain evidence linking decisions to execution where feasible. Keep all failed-run metadata where possible, but sample or delete sensitive payloads separately. Sample routine successful runs more aggressively.
Track failed-run coverage alongside ingestion, storage and query spend in £. Add richer payload capture only when the improvement in diagnosis justifies the cost.
When you confirm a wrong-tool case, turn the recorded event into a fixed test.
Turn Confirmed Failures into Regression Tests
Before writing tests, separate wrong-tool choices from argument, execution, interpretation and dependency failures. Each sanitised fixture should pin versions and context, specify expected and forbidden tools, allow only equivalent tools, and check arguments, policy results and final outcomes.
Run these tests after changes to models, prompts, routing or schemas. Track wrong-tool rate as confirmed wrong choices divided by tool-selection attempts; time to diagnose from the report to a confirmed cause; and cost per successful run, including retries and observability.
Conclusion: Use Traces, Logs and Shared IDs Together
Shared IDs link tool choice to execution, so you can trace a failure and tell whether the wrong tool was chosen or execution failed.
To make this distinction clear in production, standardise identifiers across services and queues. Record the minimum decision event, then use shared IDs to join trace and log views. This lets you follow the path from selection to execution without guessing.
With those IDs and the decision event in place, a single run ID should retrieve the decision, execution and retries. Retries should keep the run ID but use separate attempt and span IDs. An automated test should fail if correlation fields are missing. The test is whether traces and logs make the failure type clear - not whether you collect more telemetry.
FAQs
When are structured logs enough without traces?
Structured logs are enough to diagnose a single service or process boundary when there’s no multi-hop journey to piece together. Each event must include consistent correlation IDs (trace/span IDs), plus the full tool-call and decision context.
Traces are needed when tool selection involves asynchronous hand-offs or multiple agents/services, or when missing correlation leaves gaps in the timeline. Shared run identifiers link selection decisions to execution events [1][2].
How do I judge tool choices when several tools fit?
Before execution, use a router to check each tool choice against the agent’s state, permissions, arguments and prerequisites. Confirm that each choice is needed and valid. Run independent calls in parallel and dependent calls in sequence.
Record every routing decision, including the tool’s name, version and arguments. Use these records to verify outcomes in a stub or sandbox environment and confirm that the tool choice was correct.
How can I detect missing correlation IDs automatically?
Require a shared correlation ID in every log, span and audit record, including across asynchronous hops. Use OpenTelemetry to pass context between services, and structured JSON logs with fixed trace and span ID fields. This lets you join signals automatically.
Map dependencies as a causal graph. Mark a dependency as unknown if you cannot establish its version or identify its originating writer. Highlight these gaps to show where correlation context may have been lost.