
I’d use Activation Clustering to investigate suspicious groups and Spectral Signatures to rank individual records. Both need training data, labels and internal model activations - not just a prediction API.
Here’s my quick comparison:
| Criterion | Activation Clustering | Spectral Signatures |
|---|---|---|
| Looks for | A separate group within a class | A shared shift in class features |
| Returns | Clusters to inspect | Ranked records to review |
| Main settings | Feature layer, dimensions, cluster count and seeds | Feature layer, direction estimate and removal budget |
| Can misread | Legitimate subgroups | Benign outliers or ordinary variation |
| Can miss | Poisoning mixed with clean records | Weak or varied poisoning |
| Costs | Feature extraction, clustering, review and retraining | Feature extraction, SVD, review and retraining |
Neither result proves poisoning - or rules it out. For example, setting k = 2 produces two clusters even when every record is clean. Small classes and poor labels also make either method harder to judge.
My starting rule: review before removing. Keep record IDs linked to results, check disagreements, and test filtered retraining against a baseline using clean accuracy and attack success rate. Budget for compute, storage and review time, and keep personal data only as long as its documented purpose requires.
::: @figure 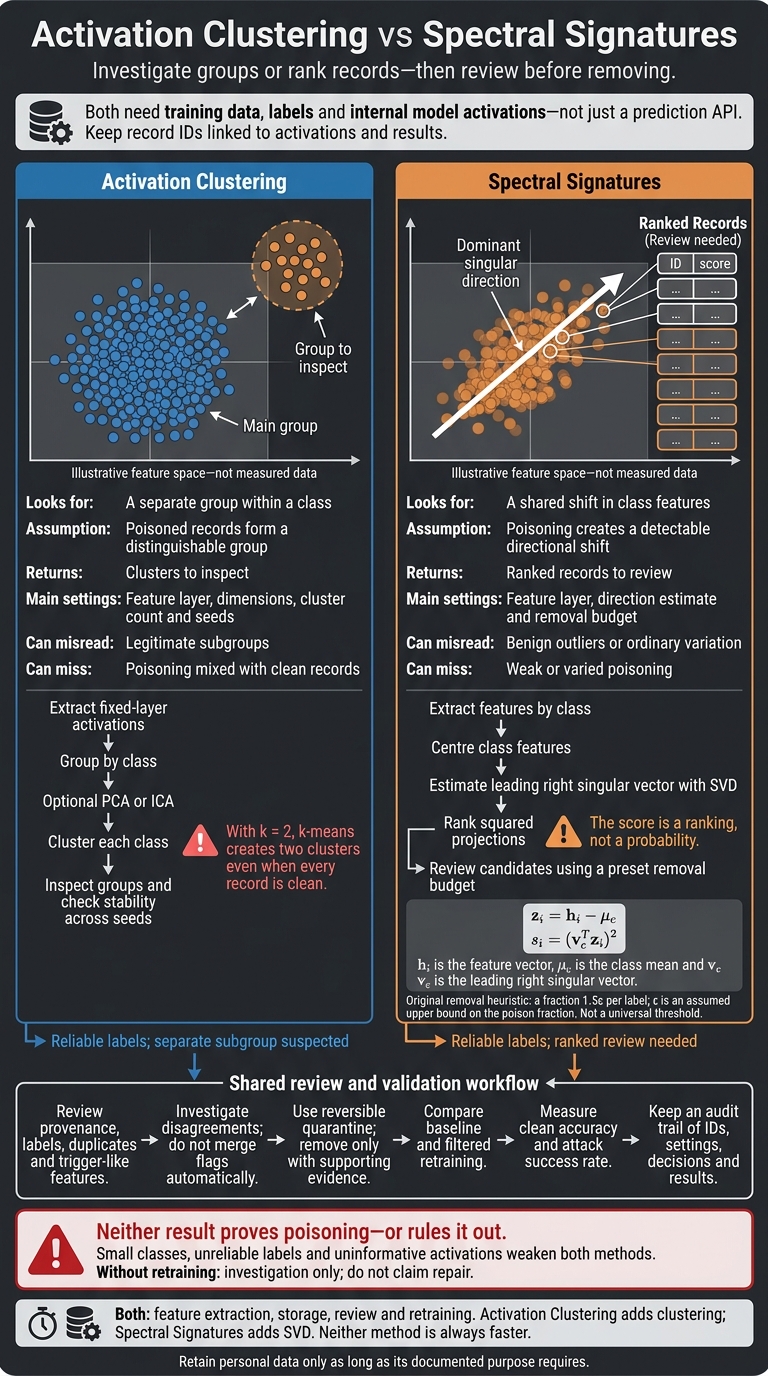 {Activation Clustering vs Spectral Signatures}
:::
Activation Clustering: finding suspicious groups
Activation Clustering screens each class for separate groups within a single label, rather than ranking individual samples.
It assumes clean and poisoned examples produce different hidden representations, usually in the penultimate layer. It works best when poisoned samples remain separate from the main class distribution.[2][6][10]
Data access and clustering steps
Keep the training records, labels and sample identifiers. Extract representations from one fixed hidden layer, then group the vectors by class. You can reduce dimensionality with PCA or ICA before clustering each class separately, usually with k-means (k=2).[2][6]
Two clusters do not prove two kinds of data. With k=2, k-means will split a class even if every sample is clean. A small cluster is a lead, not a verdict.
Inspect both groups for source, timestamp and trigger-like features. Repeat clustering with different seeds to check stability. Remove candidates only when supporting evidence points to poisoning, then retrain and measure clean accuracy and attack success rate.[6][9] An unstable split is not a finding.
Strengths, settings and false positives
The main benefit is a prioritised queue of records to review. You do not need a verified clean reference dataset.[7] But cluster size alone cannot distinguish poisoning from legitimate variation within a class.
| Factor | What to check |
|---|---|
| Representation choice | Start with penultimate-layer activations and record the layer and preprocessing. Another layer may reveal or hide trigger structure. |
| Clustering settings | Record the algorithm, distance metric, k, seed and retained dimensions. Check whether separation holds after small changes to these settings. |
| Overlapping groups | Switch layer or detector if separation remains weak. |
| Naturally varied classes | Check semantic and source differences before removing a minority group; legitimate subtypes can form separate clusters. |
| Poison spread across groups | Do not rely on k=2 alone; vary k and check provenance or sample scores. |
When class splits remain weak or unstable, move to sample-level scoring.
Spectral Signatures: ranking suspicious samples
Activation Clustering looks for a split. Spectral Signatures looks for a directional shift. The idea is that poisoned examples with the same trigger and target label cause a consistent shift in learned representations. After centring, this shift appears as a dominant singular direction that singular value decomposition (SVD) can identify. Clean and poisoned records may still overlap in feature space.[3][11]
Data access and scoring steps
Run the method class by class, using features from a penultimate or late hidden layer rather than raw inputs. This keeps ordinary differences between labels from dominating the signal. Each class needs enough samples to estimate its mean and dominant direction reliably. With very small classes, the direction estimate can be unstable.[3][12][14]
For each class (c), extract feature vectors (h_i) and calculate their mean (\mu_c). Centre the vectors using (z_i = h_i - \mu_c), arrange them as rows in a matrix, and estimate its leading right singular vector (v_c).[3][14] Then rank records within that class by their squared projections:
[ s_i = (v_c^\top z_i)^2 ]
A high score means the record projects strongly onto the dominant direction.[3][12]
The score is a ranking, not a probability. Record the checkpoint, feature layer, preprocessing, class size and seed. Changing any of these can change the ranking.[3][12]
Set the removal budget before inspecting individual candidates. The original method describes removing a fraction (1.5\epsilon) per label, where (\epsilon) is an assumed upper bound on the poison fraction. Treat this as a starting heuristic, not a universal threshold.[4] Test several removal budgets, then retrain from scratch and measure clean accuracy and attack success rate. Clean hold-out data helps with validation, but the scoring step does not require it.[12][13]
Strengths, thresholds and failure cases
Spectral ranking helps when a consistent feature shift exists but there is no clear cluster split. It can rank suspicious records without trusted clean reference data. However, it becomes unreliable when ordinary variation within a class dominates the shift, features are noisy or uninformative, or poisoning is too weak or varied. Attacks designed to avoid a dominant direction can also evade screening.[3][5]
| Factor | Practical implication |
|---|---|
| Direction estimation | Treat small-class rankings cautiously: direction estimates can be unstable.[14] |
| Scoring | Compare scores within each class. There is no universal cut-off.[12] |
| Computation | Feature extraction and SVD add compute and memory costs. Use truncated or iterative SVD to avoid storing the full covariance matrix.[12][13] |
| Benign outliers | Check for shared features. Rare poses, unusual lighting, duplicates and label errors can all produce high scores.[5] |
| Removing too many | You risk losing minority data, distorting class balance and reducing clean-model performance.[8] |
| Removing too few | Poisoned examples may remain, preserving the backdoor after retraining.[15] |
Activation Clustering vs Spectral Signatures: key differences
Activation Clustering supports group-based investigation; Spectral Signatures ranks individual records for review. Both need informative activations. Neither method makes outlier status proof of poisoning.
| Criterion | Activation Clustering | Spectral Signatures |
|---|---|---|
| Assumption | Poisoned records form a distinguishable group | Poisoning creates a detectable directional shift |
| Output | Groups and their members | Ranked records |
| Calibration | Reduction settings, cluster count, seeds and flagging criteria | Direction estimation and removal budget |
| Failure mode | Legitimate groups look suspicious, or poisoning overlaps clean data | Legitimate variation dominates, or poisoning lacks a strong direction |
Use authorised access to internal activations, record the model version and layer, and maintain a one-to-one mapping between activations and training records. Prediction-only access is not enough.
Your choice depends on whether you need to investigate groups or review ranked samples.
Compute, memory and retraining costs
Benchmark the full workflow, not just detection. Record the sample count, feature dimensions, batch size, hardware, number of classes, reduction settings, clustering iterations and solver.
Measure GPU-hours where relevant, CPU-hours, peak memory, reviewer time and retraining costs in £. Neither method is always faster.
| Cost stage | Activation Clustering | Spectral Signatures | Main dependencies |
|---|---|---|---|
| Shared extraction | Forward passes and activation storage | Same requirement | Records, model, batch size, feature dimensions |
| Preparation | Optional dimensionality reduction | Centring and matrix operations | Matrix shape and implementation |
| Detection | Clustering, potentially repeated across classes or parameter settings | Dominant-direction estimation and ranking | Cluster count, iterations, initialisation and solver |
| Peak memory | Activations, reduced features and clustering workspace | Activations, summary statistics and decomposition workspace | Precision, storage and streaming choices |
| Review and retraining | Inspect groups; retrain filtered copies | Review ranked records; retrain filtered copies | Flag volume, removal budgets and training runs |
Weigh these costs alongside label quality and the expected poison rate when choosing your starting method.
Choosing a method for your data
Use this matrix to choose a starting point, not an automatic removal policy. If the expected poison rate is very low, Spectral Signatures may be a practical first choice. It can still miss weak signals.
| Condition | Starting point | Required caution |
|---|---|---|
| Reliable labels; separate subgroup suspected | Activation Clustering | Check whether source or style explains the group |
| Reliable labels; ranked review needed | Spectral Signatures | Validate the removal budget |
| Small classes | Pilot either cautiously | Neither tiny clusters nor unstable directions provide strong evidence |
| Very low expected poison rate | Conservative ranked review, if justified | Weak signals may remain undetected |
| Unreliable labels | Audit labels first | Both methods’ class-wise comparisons weaken |
| Retraining available | Either, followed by validation | Compare filtered and unfiltered training |
| Retraining unavailable | Investigation only | Do not claim screening has repaired the model |
When the methods disagree, inspect the records before deleting anything.
Checking results and investigating disagreement
Do not merge the methods’ flags automatically. Preserve the original records, set aside uncertain candidates and compare the proposed filters on the same training set.
Where trusted evaluation data and controlled attack tests are available, measure detection recall, false-positive rates, clean-task performance and attack success after filtering and retraining. Track removed records, changes in class balance and costs too.
| Result | Investigation |
|---|---|
| Both flag the same records | Prioritise provenance, label, duplicate and trigger checks |
| Activation Clustering only | Compare the group with nearby records; check source, style and augmentation |
| Spectral Signatures only | Inspect score distributions and metadata for rare legitimate modes or diffuse poisoning |
| Disagreement varies by class | Check class size, label quality and representation quality |
| Flags change across layers or seeds | Treat results as unstable; avoid automatic deletion |
| Flags disappear after retraining | Check attack success and clean performance; disappearance alone does not establish repair |
Conclusion: choose and test a screening workflow
Use Activation Clustering to inspect groups and Spectral Signatures to rank candidates for screening. Treat the output as a triage list, not proof.
Before the review, fix the data slice, checkpoint, layer, thresholds and review limit for the pilot. Agree on exclusion criteria upfront, and start with reversible quarantine. Set aside budget for both baseline and filtered retraining, then compare performance on clean validation data.
Keep candidate IDs, scores or cluster assignments, model and layer versions, thresholds, reviewer decisions, and before-and-after results in a single audit trail.
Retain originals for that audit trail only if you have a separate justification. UK GDPR does not set a universal retention period: keep personal data only for as long as the documented purpose requires, then delete or anonymise it.[16][17][18]
FAQs
How can I estimate an unknown poison rate?
If the poison rate is unknown, don’t rely on a single assumed removal fraction. Pair unsupervised anomaly detection with rule-based thresholds.
Use historical data to establish normal behaviour. Then set thresholds, such as an empirical percentile or the median plus k times the median absolute deviation (MAD), to prioritise samples for human review.
How can I distinguish backdoors from legitimate subgroups?
Both backdoors and legitimate rare subgroups can receive high anomaly scores. Don’t rely on a single score or threshold. Check the provenance, labels and metadata of flagged samples. Retrain with and without the suspicious data, then compare trigger behaviour and accuracy on clean data.
Assess subgroup performance separately to avoid disproportionately harming valid niche groups. Keep suspicious records in reversible quarantine, and seek supporting evidence from independent detection methods before deleting anything permanently.
How can I validate screening without known attack samples?
When known attack samples aren’t available, use behavioural anomaly detection and historical baselines to flag unusual patterns [1]. Set thresholds using validation data verified as clean, rather than assumed proportions of poisoned data [2].
Treat screening as a diagnostic tool, not proof of data integrity. Run controlled pilots to compare performance before and after filtering. Keep removal decisions in human hands: quarantine suspicious samples for expert review so legitimate rare data isn’t discarded [1][2][3].